Financial Analysis Report: Comparing Samsung and Apple Performance
VerifiedAdded on 2020/11/12
|24
|5519
|319
Report
AI Summary
This report presents a comprehensive financial analysis of Samsung and Apple, two major players in the telecommunication sector. It begins with an introduction to both companies, detailing their business operations and financial backgrounds. The analysis focuses on comparing their financial performance using ratio analysis, including profitability, solvency, and liquidity ratios, over a period of several years. Charts and tables are used to illustrate key financial metrics and trends. Furthermore, the report includes SWOT analyses for both Samsung and Apple, highlighting their respective strengths, weaknesses, opportunities, and threats. The report also critically examines the Corporate Social Responsibility (CSR) activities undertaken by both companies. Finally, the report concludes by comparing the financial standings of both companies and determining which has a stronger financial position. The report includes financial statements, ratio calculations, and horizontal/vertical analyses to support the findings.
FINANCIAL ANALYSIS
MANAGEMENT AND
ENTERPRISE
MANAGEMENT AND
ENTERPRISE
Paraphrase This Document
Need a fresh take? Get an instant paraphrase of this document with our AI Paraphraser
Table of Contents
INTRODUCTION...........................................................................................................................1
TASK 1(A).......................................................................................................................................1
1.1: Comparing the financial performance and the position of both companies........................1
TASK 1(B).....................................................................................................................................10
SWOT Analysis of Samsung:...................................................................................................10
SWOT analysis of Apple:.........................................................................................................11
TASK 2..........................................................................................................................................12
2.1: Critical analysis of CSR sections over the last couple of years.........................................12
CONCLUSION..............................................................................................................................15
REFERENCES..............................................................................................................................16
APPENDIX....................................................................................................................................17
Income statement of Samsung..................................................................................................17
Balance sheet of Samsung ........................................................................................................18
Income statement of Apple Plc.................................................................................................20
Balance sheet of Apple Plc.......................................................................................................21
INTRODUCTION
Financial analysis management is the process which is related to evaluation of the
activities of business, its budgets and all of the finance related activities that are undertaken in
the organisation so that the managers of the company can analyse the profitability and
performance of the business. Financial analysis is the process that is related to analysing whether
the business organisation is operating in an stable, consistent, liquid, solvent or gainful enough
to invest in the monetary funds. The major purpose behind the financial analysis for an enterprise
is to find the issues that are faced by the company by comparing it with the past performances
and troubleshooting them. The analysis is performed by various method such as Ratio analysis of
the company and Vertical and horizontal analysis.
This project reports is prepared on the two major players in the telecommunication sector
namely Samsung and Apple. The analysis of their financial performance is done using ratio
analysis and by using charts and their strengths and weakness are also discussed here. Finally,
the project will tell which of the two companies have stronger financial grounds. The reports also
discusses the CSR activities undertaken by the companies.
TASK 1(A)
1.1: Comparing the financial performance and the position of both companies
Introduction to Samsung electronics company: Samsung electronics was established in
1969 which has grown rapidly. Now, this can be found that Samsung is currently managing 220
subsidiaries around the globe and is successfully generating a revenue of more than 200 Trillion
KRW per year. Samsung electronics is currently involved in the production of innovative
products and is making serious effort for the purpose of achieving continuous growth and
shaping the future of the consumers by doing continuous Innovations and modifications in the
products which they manufacture. Samsung electronics is currently engaged in providing
consumer products such as printers, monitors, televisions, Refrigerators, Air conditioners, and
the most important technology of the modern world which is Tablets and smartphones. Samsung
main vision behind the manufacturing of its products and services is to create value, generate
convenience and encouraging a smart and fast lifestyle for its consumers around the world
(Arena, 2011).
1
⊘ This is a preview!⊘
Do you want full access?
Subscribe today to unlock all pages.
Trusted by 1+ million students worldwide
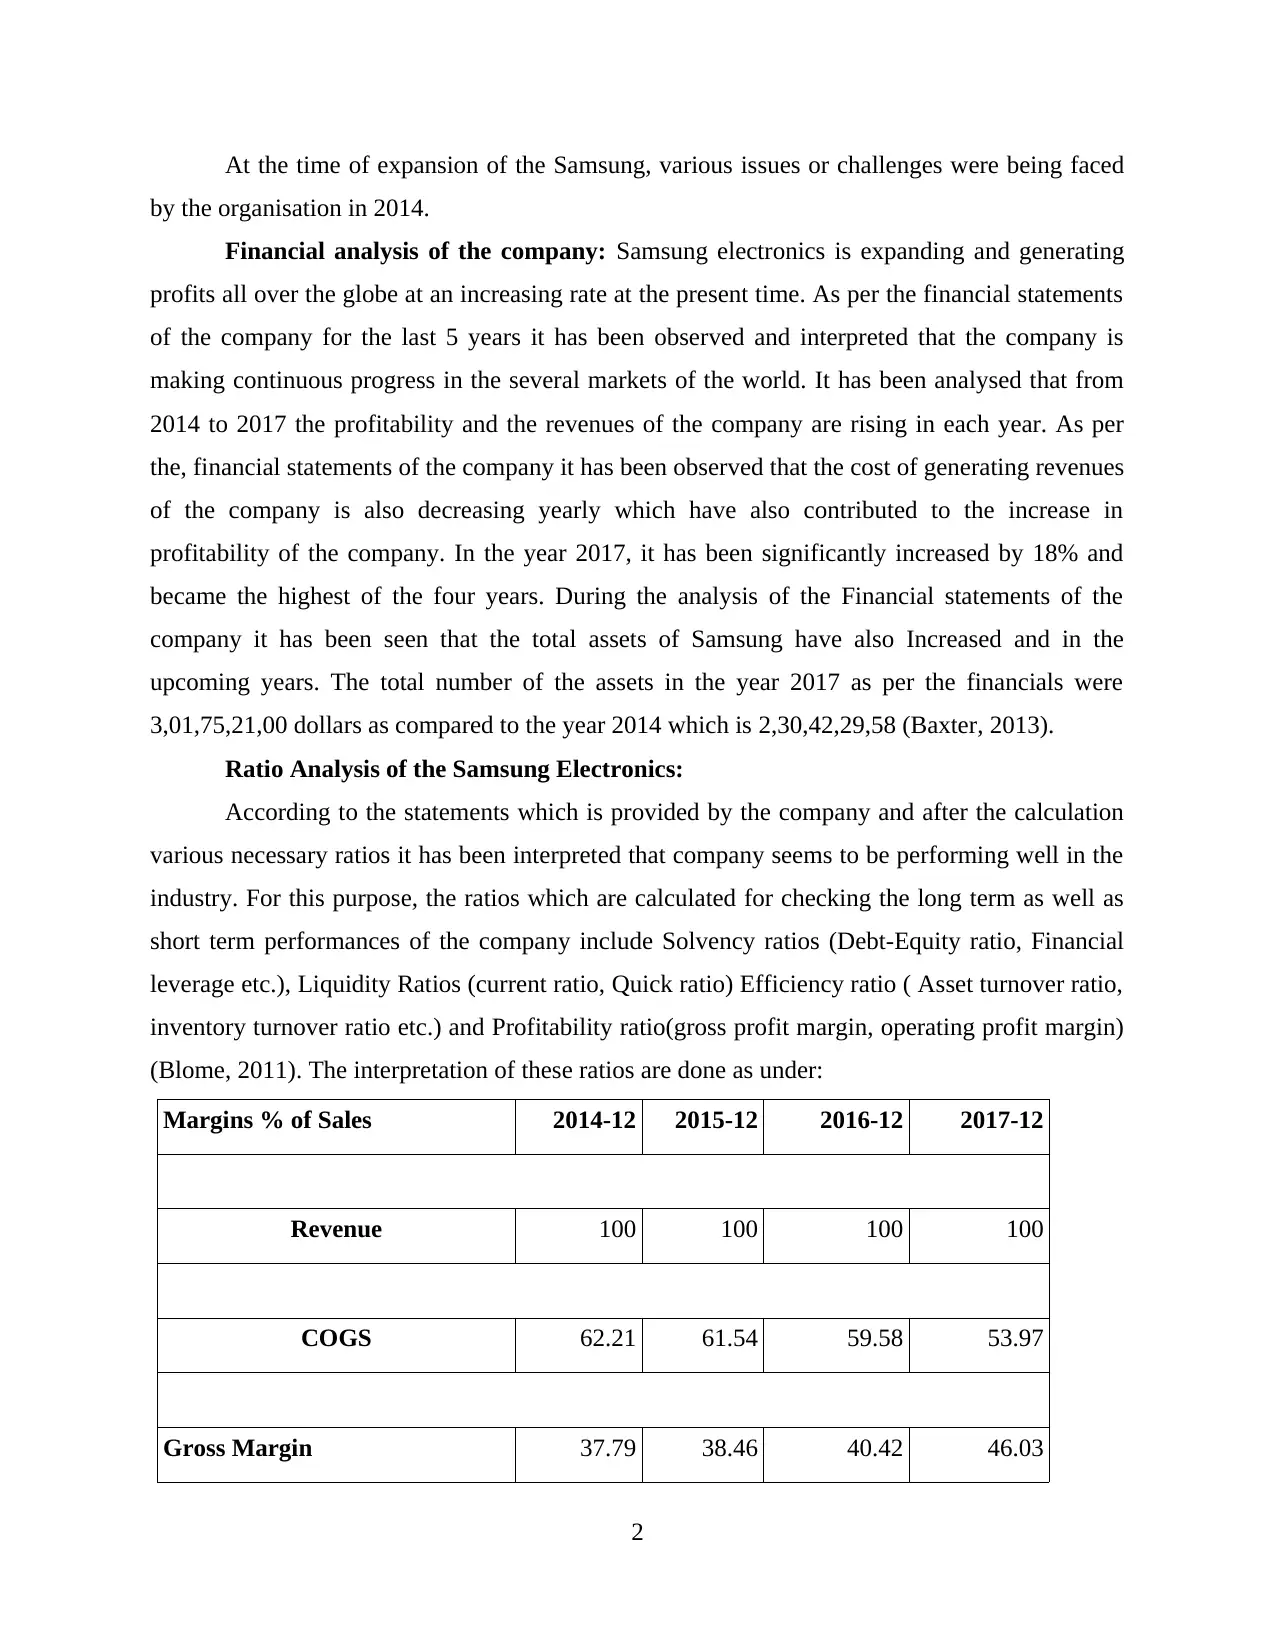
At the time of expansion of the Samsung, various issues or challenges were being faced
by the organisation in 2014.
Financial analysis of the company: Samsung electronics is expanding and generating
profits all over the globe at an increasing rate at the present time. As per the financial statements
of the company for the last 5 years it has been observed and interpreted that the company is
making continuous progress in the several markets of the world. It has been analysed that from
2014 to 2017 the profitability and the revenues of the company are rising in each year. As per
the, financial statements of the company it has been observed that the cost of generating revenues
of the company is also decreasing yearly which have also contributed to the increase in
profitability of the company. In the year 2017, it has been significantly increased by 18% and
became the highest of the four years. During the analysis of the Financial statements of the
company it has been seen that the total assets of Samsung have also Increased and in the
upcoming years. The total number of the assets in the year 2017 as per the financials were
3,01,75,21,00 dollars as compared to the year 2014 which is 2,30,42,29,58 (Baxter, 2013).
Ratio Analysis of the Samsung Electronics:
According to the statements which is provided by the company and after the calculation
various necessary ratios it has been interpreted that company seems to be performing well in the
industry. For this purpose, the ratios which are calculated for checking the long term as well as
short term performances of the company include Solvency ratios (Debt-Equity ratio, Financial
leverage etc.), Liquidity Ratios (current ratio, Quick ratio) Efficiency ratio ( Asset turnover ratio,
inventory turnover ratio etc.) and Profitability ratio(gross profit margin, operating profit margin)
(Blome, 2011). The interpretation of these ratios are done as under:
Margins % of Sales 2014-12 2015-12 2016-12 2017-12
Revenue 100 100 100 100
COGS 62.21 61.54 59.58 53.97
Gross Margin 37.79 38.46 40.42 46.03
2
Paraphrase This Document
Need a fresh take? Get an instant paraphrase of this document with our AI Paraphraser
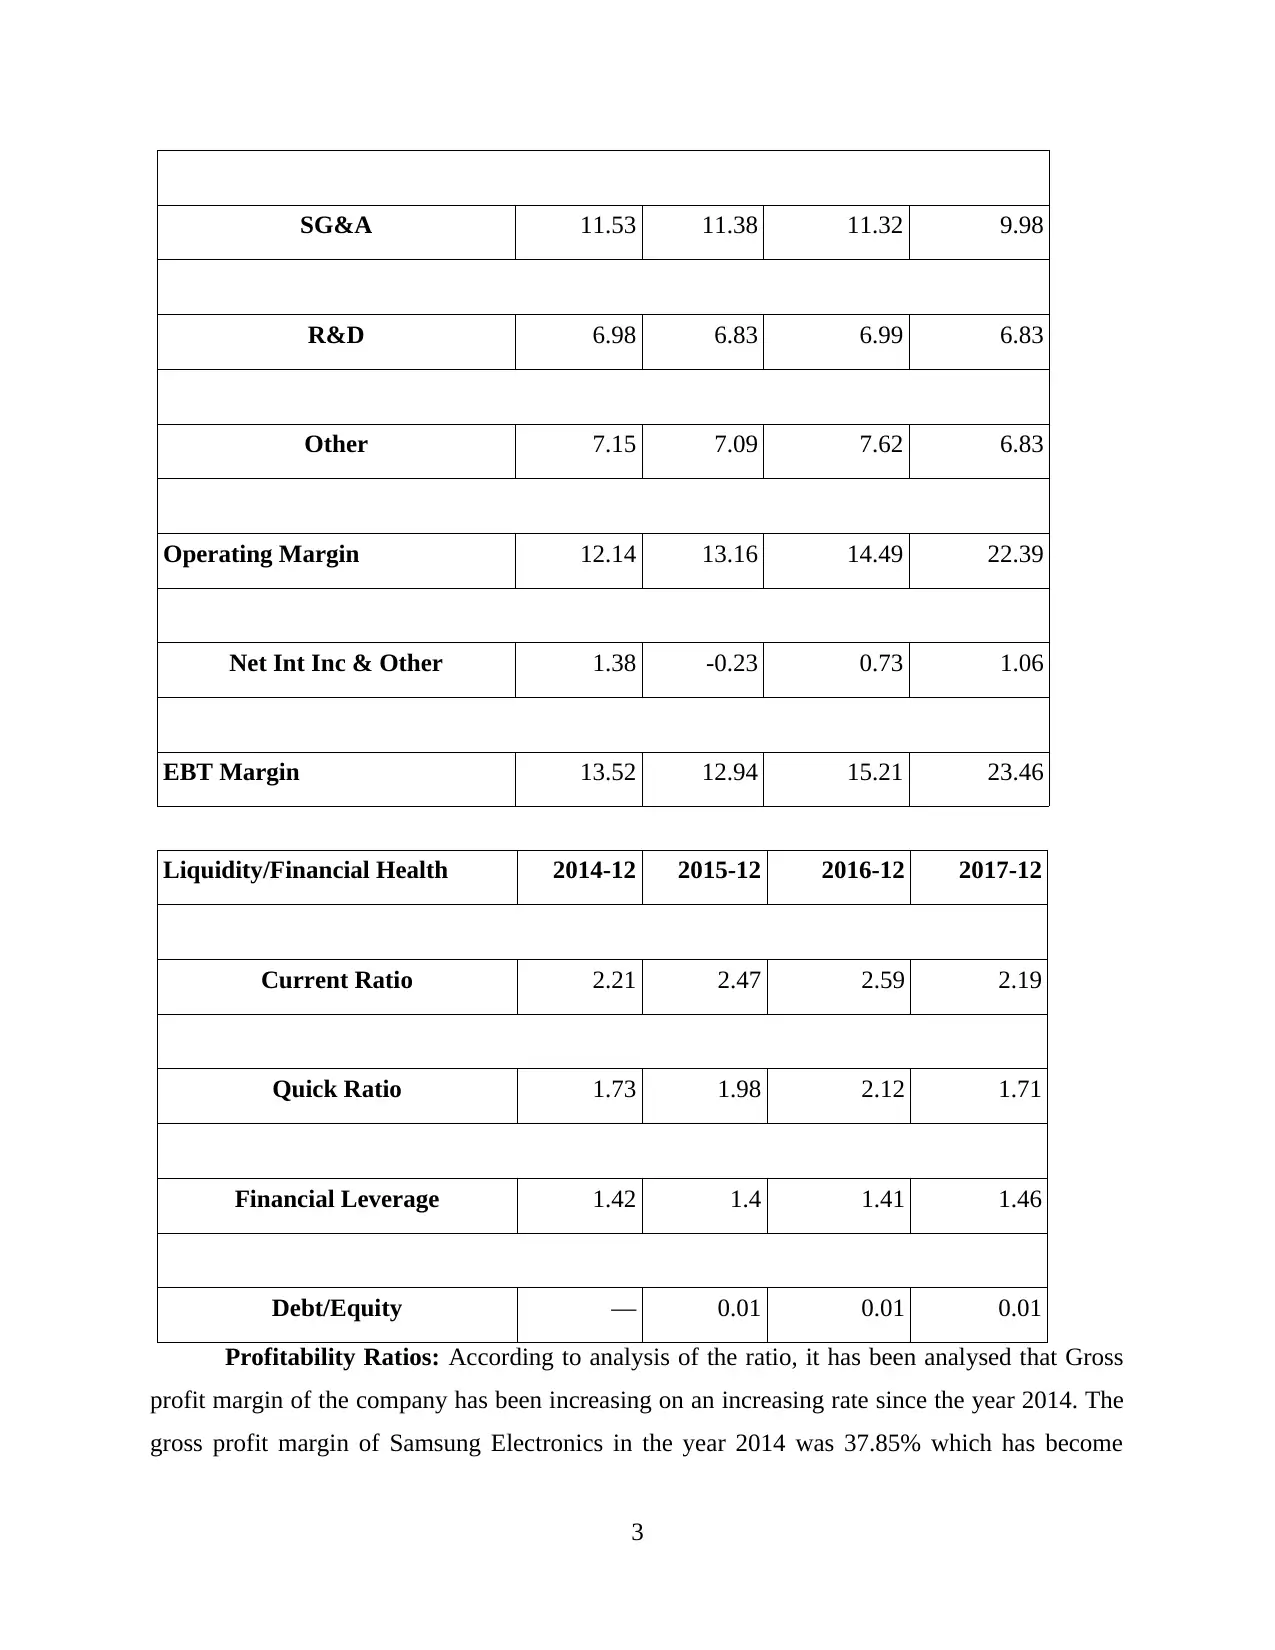
SG&A 11.53 11.38 11.32 9.98
R&D 6.98 6.83 6.99 6.83
Other 7.15 7.09 7.62 6.83
Operating Margin 12.14 13.16 14.49 22.39
Net Int Inc & Other 1.38 -0.23 0.73 1.06
EBT Margin 13.52 12.94 15.21 23.46
Liquidity/Financial Health 2014-12 2015-12 2016-12 2017-12
Current Ratio 2.21 2.47 2.59 2.19
Quick Ratio 1.73 1.98 2.12 1.71
Financial Leverage 1.42 1.4 1.41 1.46
Debt/Equity — 0.01 0.01 0.01
Profitability Ratios: According to analysis of the ratio, it has been analysed that Gross
profit margin of the company has been increasing on an increasing rate since the year 2014. The
gross profit margin of Samsung Electronics in the year 2014 was 37.85% which has become
3
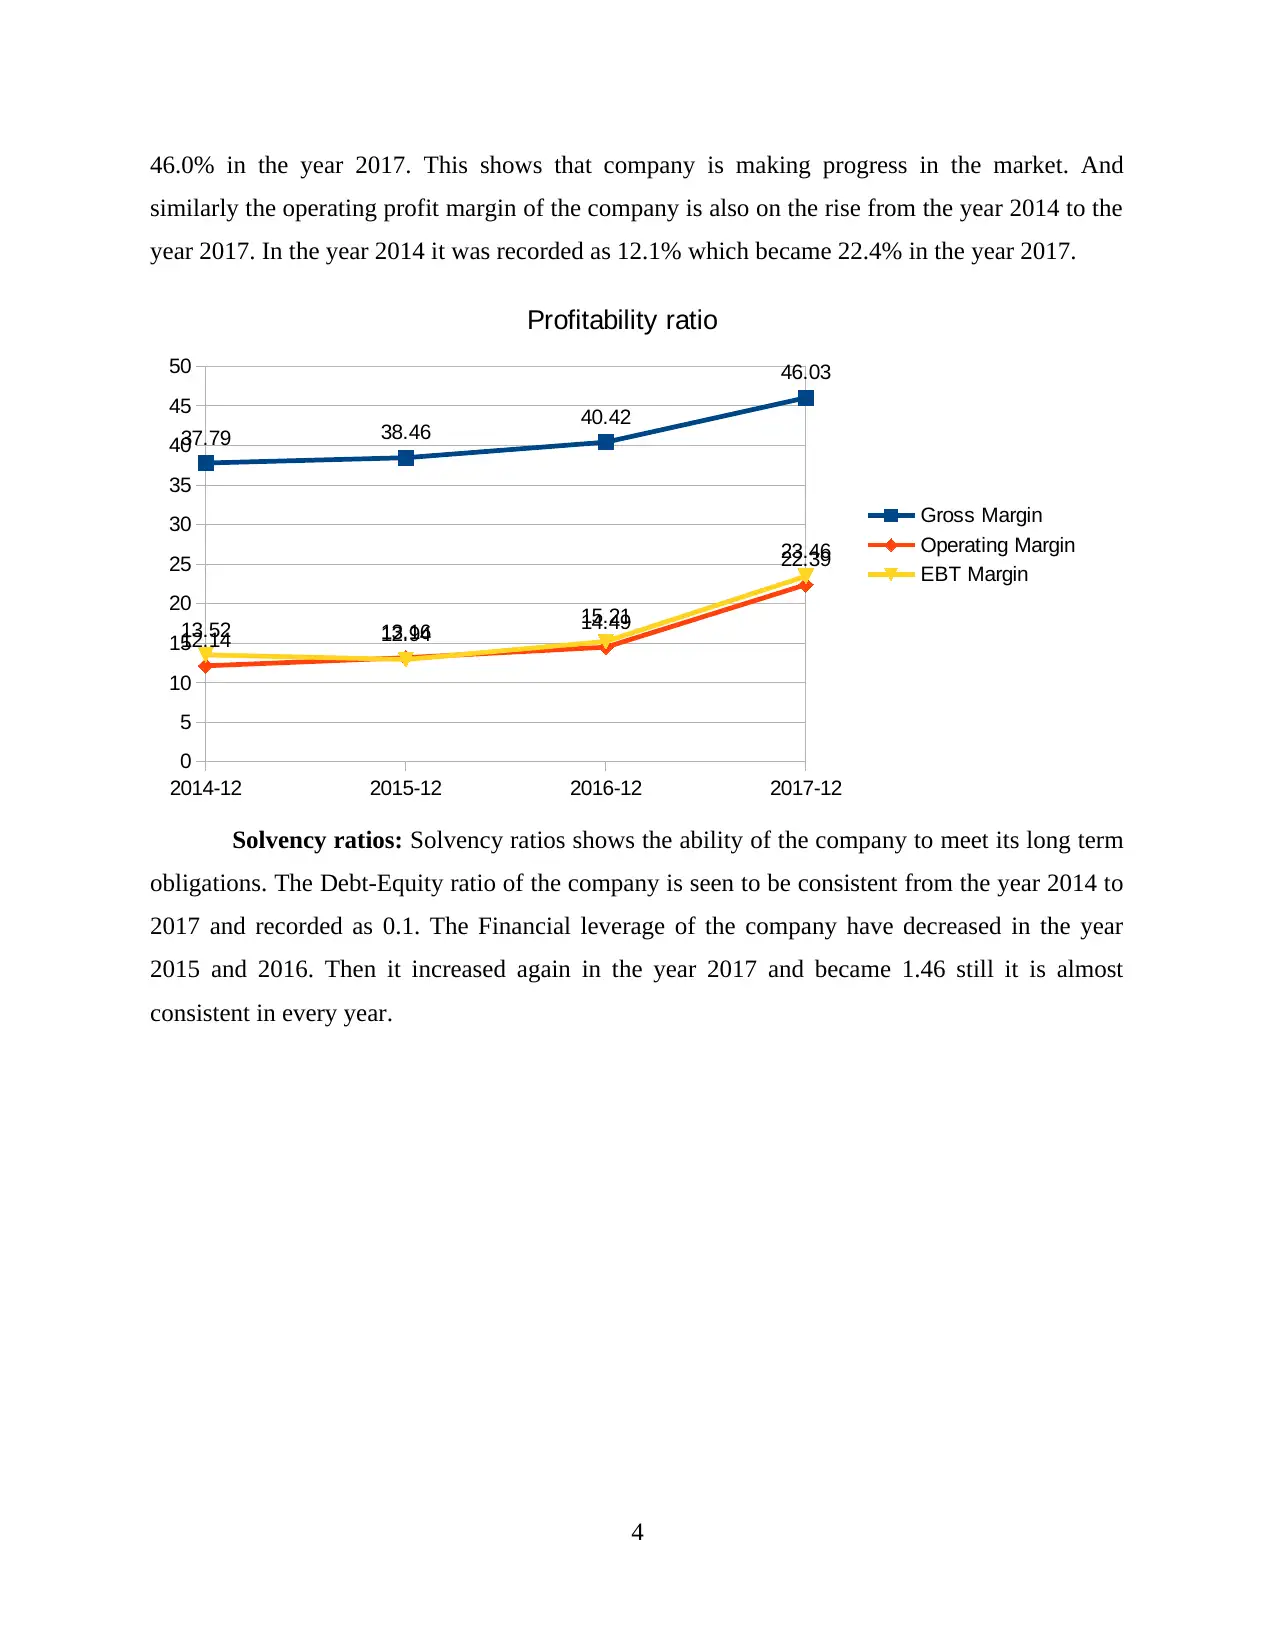
46.0% in the year 2017. This shows that company is making progress in the market. And
similarly the operating profit margin of the company is also on the rise from the year 2014 to the
year 2017. In the year 2014 it was recorded as 12.1% which became 22.4% in the year 2017.
2014-12 2015-12 2016-12 2017-12
0
5
10
15
20
25
30
35
40
45
50
37.79 38.46 40.42
46.03
12.14 13.16 14.49
22.39
13.52 12.94 15.21
23.46
Profitability ratio
Gross Margin
Operating Margin
EBT Margin
Solvency ratios: Solvency ratios shows the ability of the company to meet its long term
obligations. The Debt-Equity ratio of the company is seen to be consistent from the year 2014 to
2017 and recorded as 0.1. The Financial leverage of the company have decreased in the year
2015 and 2016. Then it increased again in the year 2017 and became 1.46 still it is almost
consistent in every year.
4
⊘ This is a preview!⊘
Do you want full access?
Subscribe today to unlock all pages.
Trusted by 1+ million students worldwide
2015-12 2016-12 2017-12
0
0.002
0.004
0.006
0.008
0.01
0.012
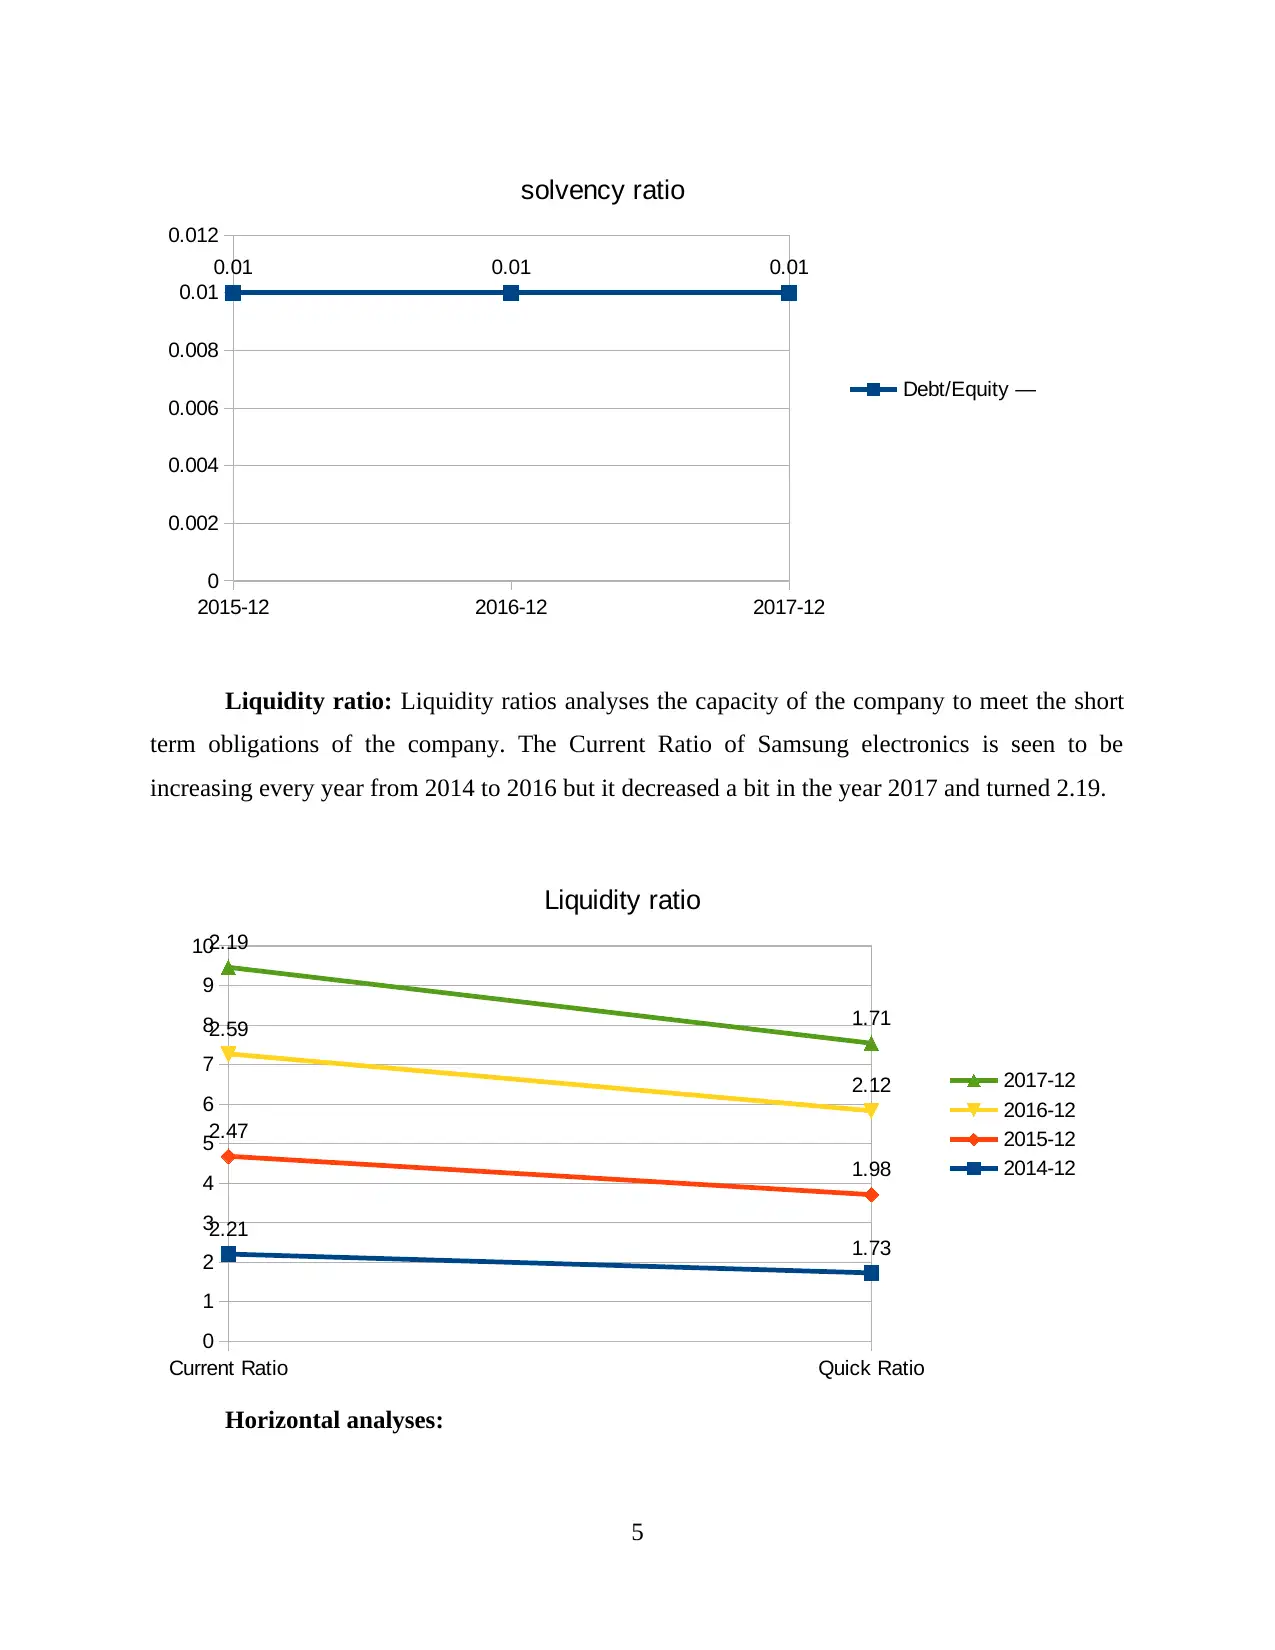
0.01 0.01 0.01
solvency ratio
Debt/Equity —
Liquidity ratio: Liquidity ratios analyses the capacity of the company to meet the short
term obligations of the company. The Current Ratio of Samsung electronics is seen to be
increasing every year from 2014 to 2016 but it decreased a bit in the year 2017 and turned 2.19.
Current Ratio Quick Ratio
0
1
2
3
4
5
6
7
8
9
10
2.21 1.73
2.47
1.98
2.59
2.12
2.19
1.71
Liquidity ratio
2017-12
2016-12
2015-12
2014-12
Horizontal analyses:
5
0
0.002
0.004
0.006
0.008
0.01
0.012
0.01 0.01 0.01
solvency ratio
Debt/Equity —
Liquidity ratio: Liquidity ratios analyses the capacity of the company to meet the short
term obligations of the company. The Current Ratio of Samsung electronics is seen to be
increasing every year from 2014 to 2016 but it decreased a bit in the year 2017 and turned 2.19.
Current Ratio Quick Ratio
0
1
2
3
4
5
6
7
8
9
10
2.21 1.73
2.47
1.98
2.59
2.12
2.19
1.71
Liquidity ratio
2017-12
2016-12
2015-12
2014-12
Horizontal analyses:
5
Paraphrase This Document
Need a fresh take? Get an instant paraphrase of this document with our AI Paraphraser
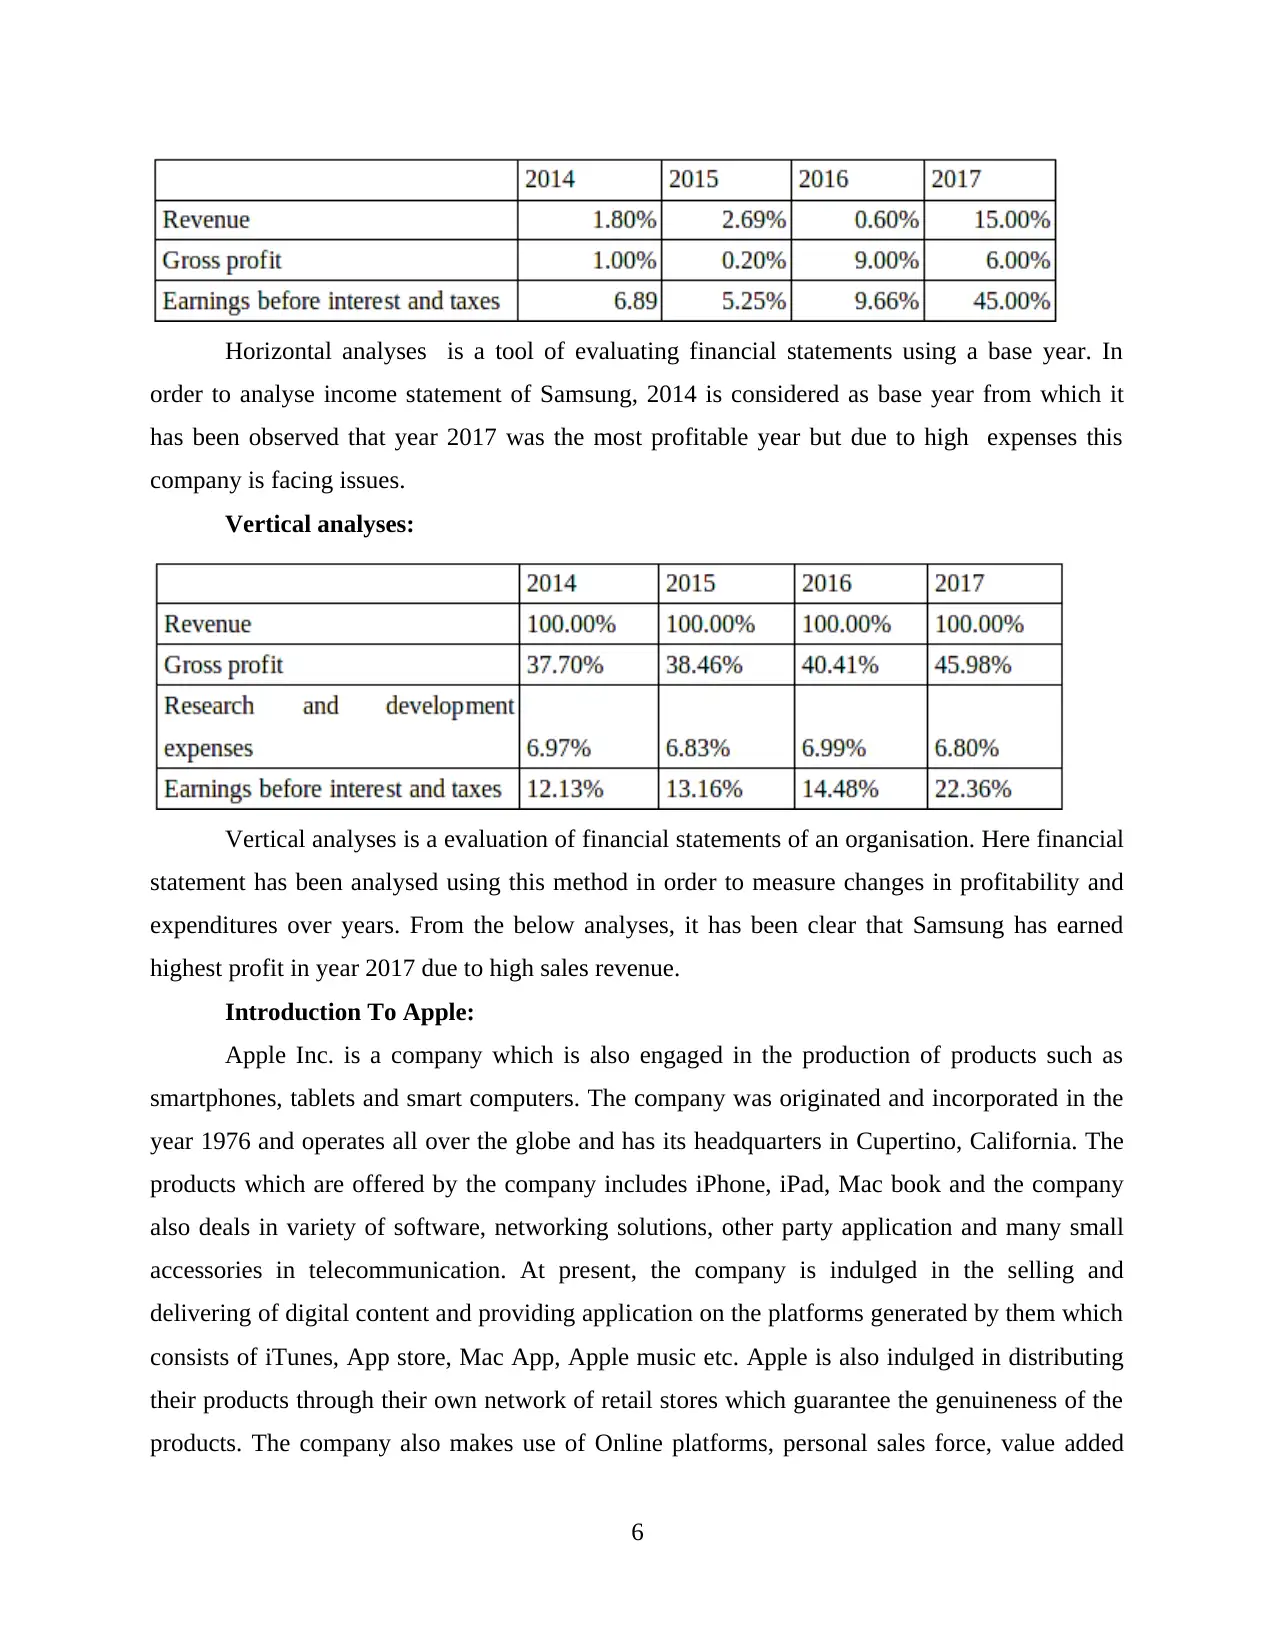
Horizontal analyses is a tool of evaluating financial statements using a base year. In
order to analyse income statement of Samsung, 2014 is considered as base year from which it
has been observed that year 2017 was the most profitable year but due to high expenses this
company is facing issues.
Vertical analyses:
Vertical analyses is a evaluation of financial statements of an organisation. Here financial
statement has been analysed using this method in order to measure changes in profitability and
expenditures over years. From the below analyses, it has been clear that Samsung has earned
highest profit in year 2017 due to high sales revenue.
Introduction To Apple:
Apple Inc. is a company which is also engaged in the production of products such as
smartphones, tablets and smart computers. The company was originated and incorporated in the
year 1976 and operates all over the globe and has its headquarters in Cupertino, California. The
products which are offered by the company includes iPhone, iPad, Mac book and the company
also deals in variety of software, networking solutions, other party application and many small
accessories in telecommunication. At present, the company is indulged in the selling and
delivering of digital content and providing application on the platforms generated by them which
consists of iTunes, App store, Mac App, Apple music etc. Apple is also indulged in distributing
their products through their own network of retail stores which guarantee the genuineness of the
products. The company also makes use of Online platforms, personal sales force, value added
6
resellers and other wholesalers and retailers for the purpose of distributing their products to the
end customers (Brigham, 2012).
Financial analysis of the company:
As per the analysis of financial statements of the company it has been evaluated that,
overall turnover of the company is increased by 8% over the years and has been recorded at a
huge 22,92,34 thousand Dollars. As per the financial information provided by the company it has
been seen that the company's gross profit in the year 2014 is recorded as 7,05,37 thousand which
has again increased in the year 2015 as 9,36,26. Although in the next year the company has
reported a decline in the profitability in comparison to the revenues of the company and has
declined as 8,42,63 and then it has increased again in 2017 as 8,81,86 and has been recorded at
of the total turnover of the company. One of the reason behind the decrease in the profitability of
the company is that its cost of generating revenue is increasing for every year. In turn, the
company's Earnings before interest, tax and depreciation has also increased (Bromiley, 2015).
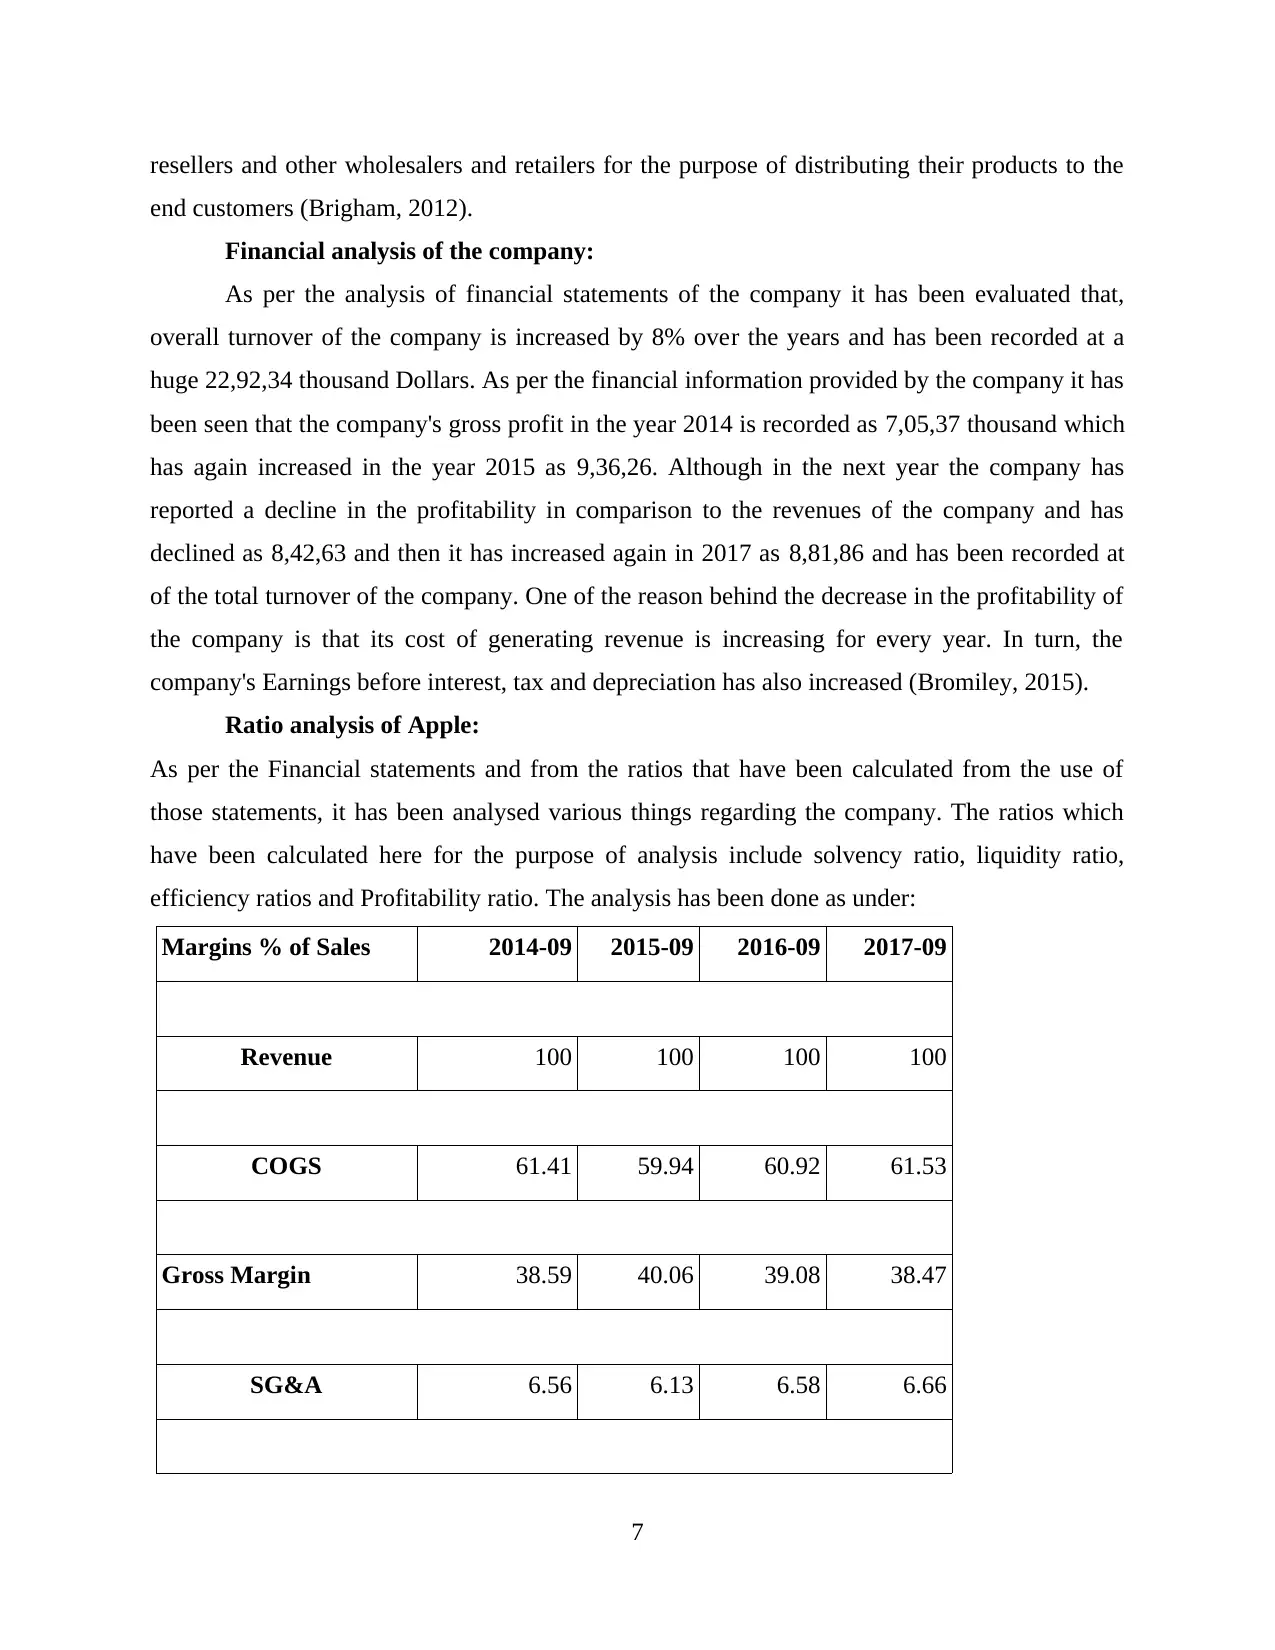
Ratio analysis of Apple:
As per the Financial statements and from the ratios that have been calculated from the use of
those statements, it has been analysed various things regarding the company. The ratios which
have been calculated here for the purpose of analysis include solvency ratio, liquidity ratio,
efficiency ratios and Profitability ratio. The analysis has been done as under:
Margins % of Sales 2014-09 2015-09 2016-09 2017-09
Revenue 100 100 100 100
COGS 61.41 59.94 60.92 61.53
Gross Margin 38.59 40.06 39.08 38.47
SG&A 6.56 6.13 6.58 6.66
7
end customers (Brigham, 2012).
Financial analysis of the company:
As per the analysis of financial statements of the company it has been evaluated that,
overall turnover of the company is increased by 8% over the years and has been recorded at a
huge 22,92,34 thousand Dollars. As per the financial information provided by the company it has
been seen that the company's gross profit in the year 2014 is recorded as 7,05,37 thousand which
has again increased in the year 2015 as 9,36,26. Although in the next year the company has
reported a decline in the profitability in comparison to the revenues of the company and has
declined as 8,42,63 and then it has increased again in 2017 as 8,81,86 and has been recorded at
of the total turnover of the company. One of the reason behind the decrease in the profitability of
the company is that its cost of generating revenue is increasing for every year. In turn, the
company's Earnings before interest, tax and depreciation has also increased (Bromiley, 2015).
Ratio analysis of Apple:
As per the Financial statements and from the ratios that have been calculated from the use of
those statements, it has been analysed various things regarding the company. The ratios which
have been calculated here for the purpose of analysis include solvency ratio, liquidity ratio,
efficiency ratios and Profitability ratio. The analysis has been done as under:
Margins % of Sales 2014-09 2015-09 2016-09 2017-09
Revenue 100 100 100 100
COGS 61.41 59.94 60.92 61.53
Gross Margin 38.59 40.06 39.08 38.47
SG&A 6.56 6.13 6.58 6.66
7
⊘ This is a preview!⊘
Do you want full access?
Subscribe today to unlock all pages.
Trusted by 1+ million students worldwide
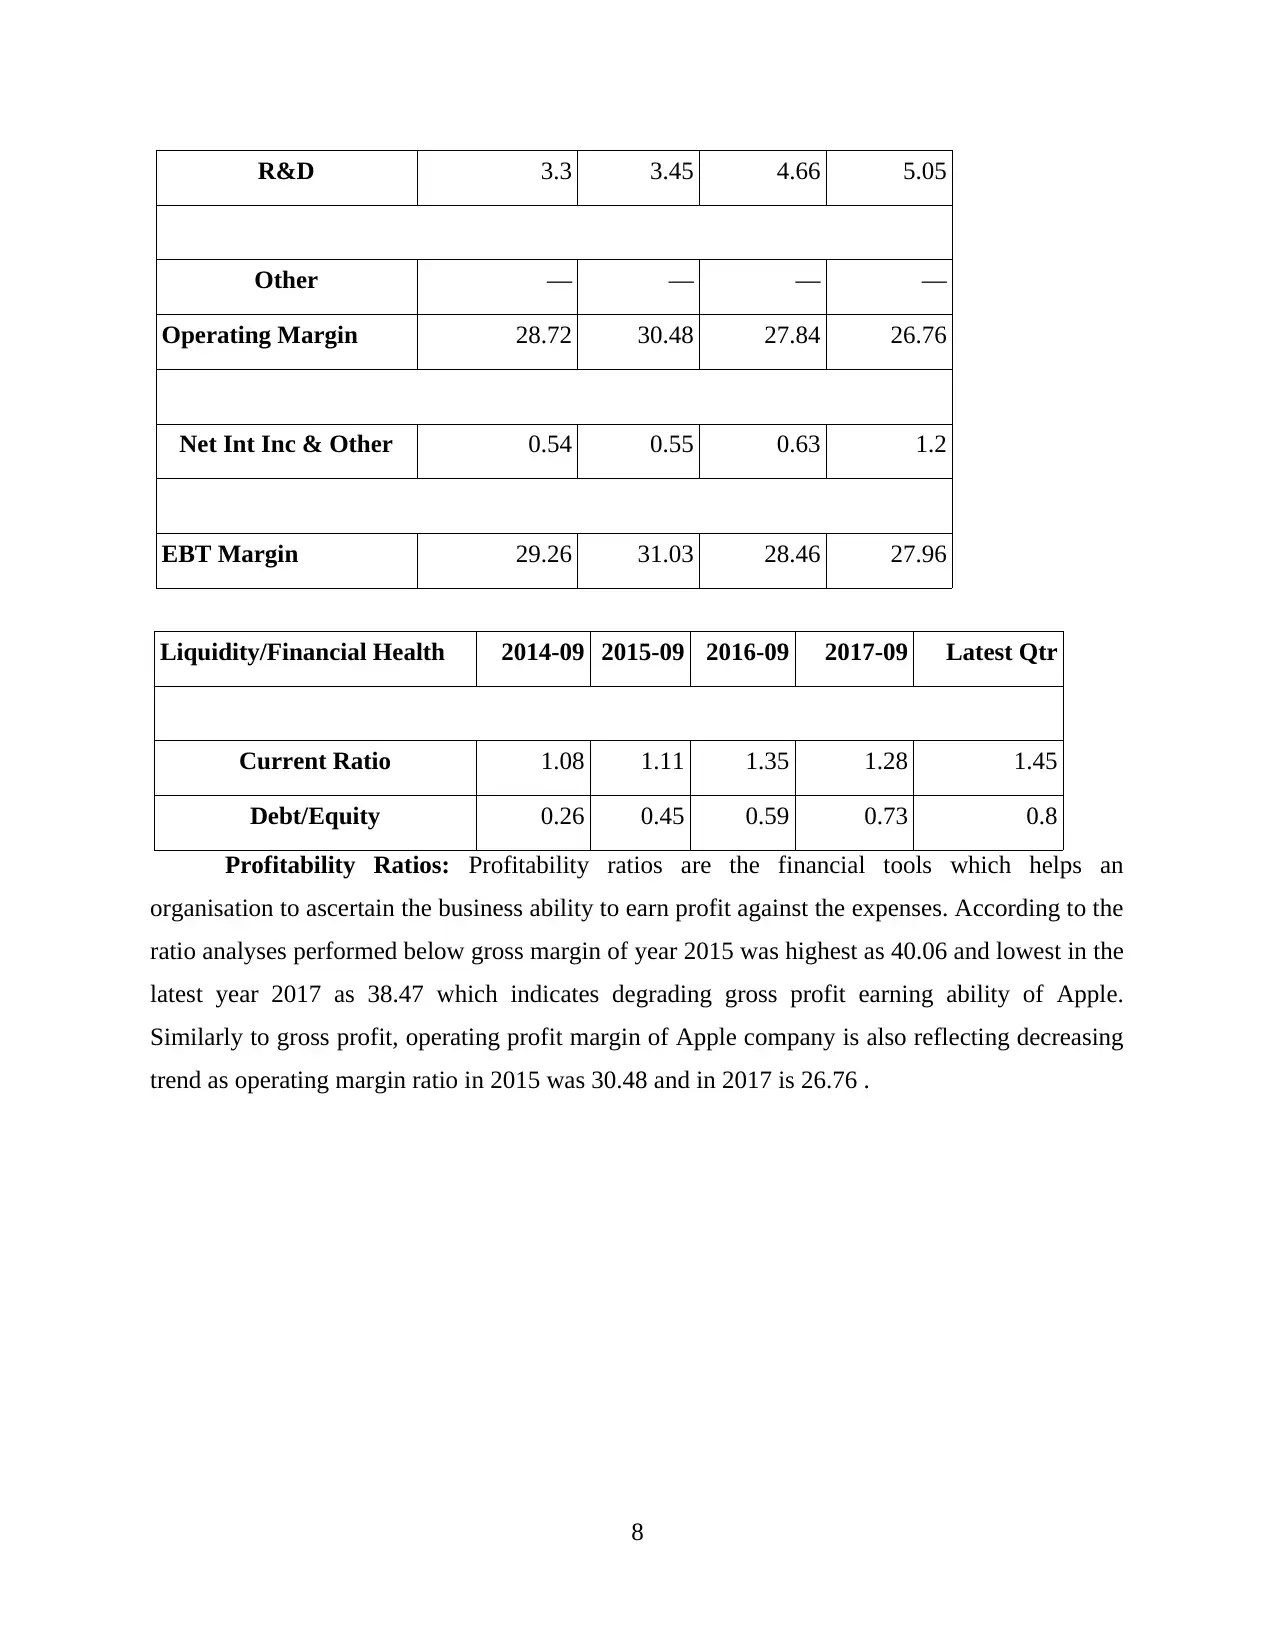
R&D 3.3 3.45 4.66 5.05
Other — — — —
Operating Margin 28.72 30.48 27.84 26.76
Net Int Inc & Other 0.54 0.55 0.63 1.2
EBT Margin 29.26 31.03 28.46 27.96
Liquidity/Financial Health 2014-09 2015-09 2016-09 2017-09 Latest Qtr
Current Ratio 1.08 1.11 1.35 1.28 1.45
Debt/Equity 0.26 0.45 0.59 0.73 0.8
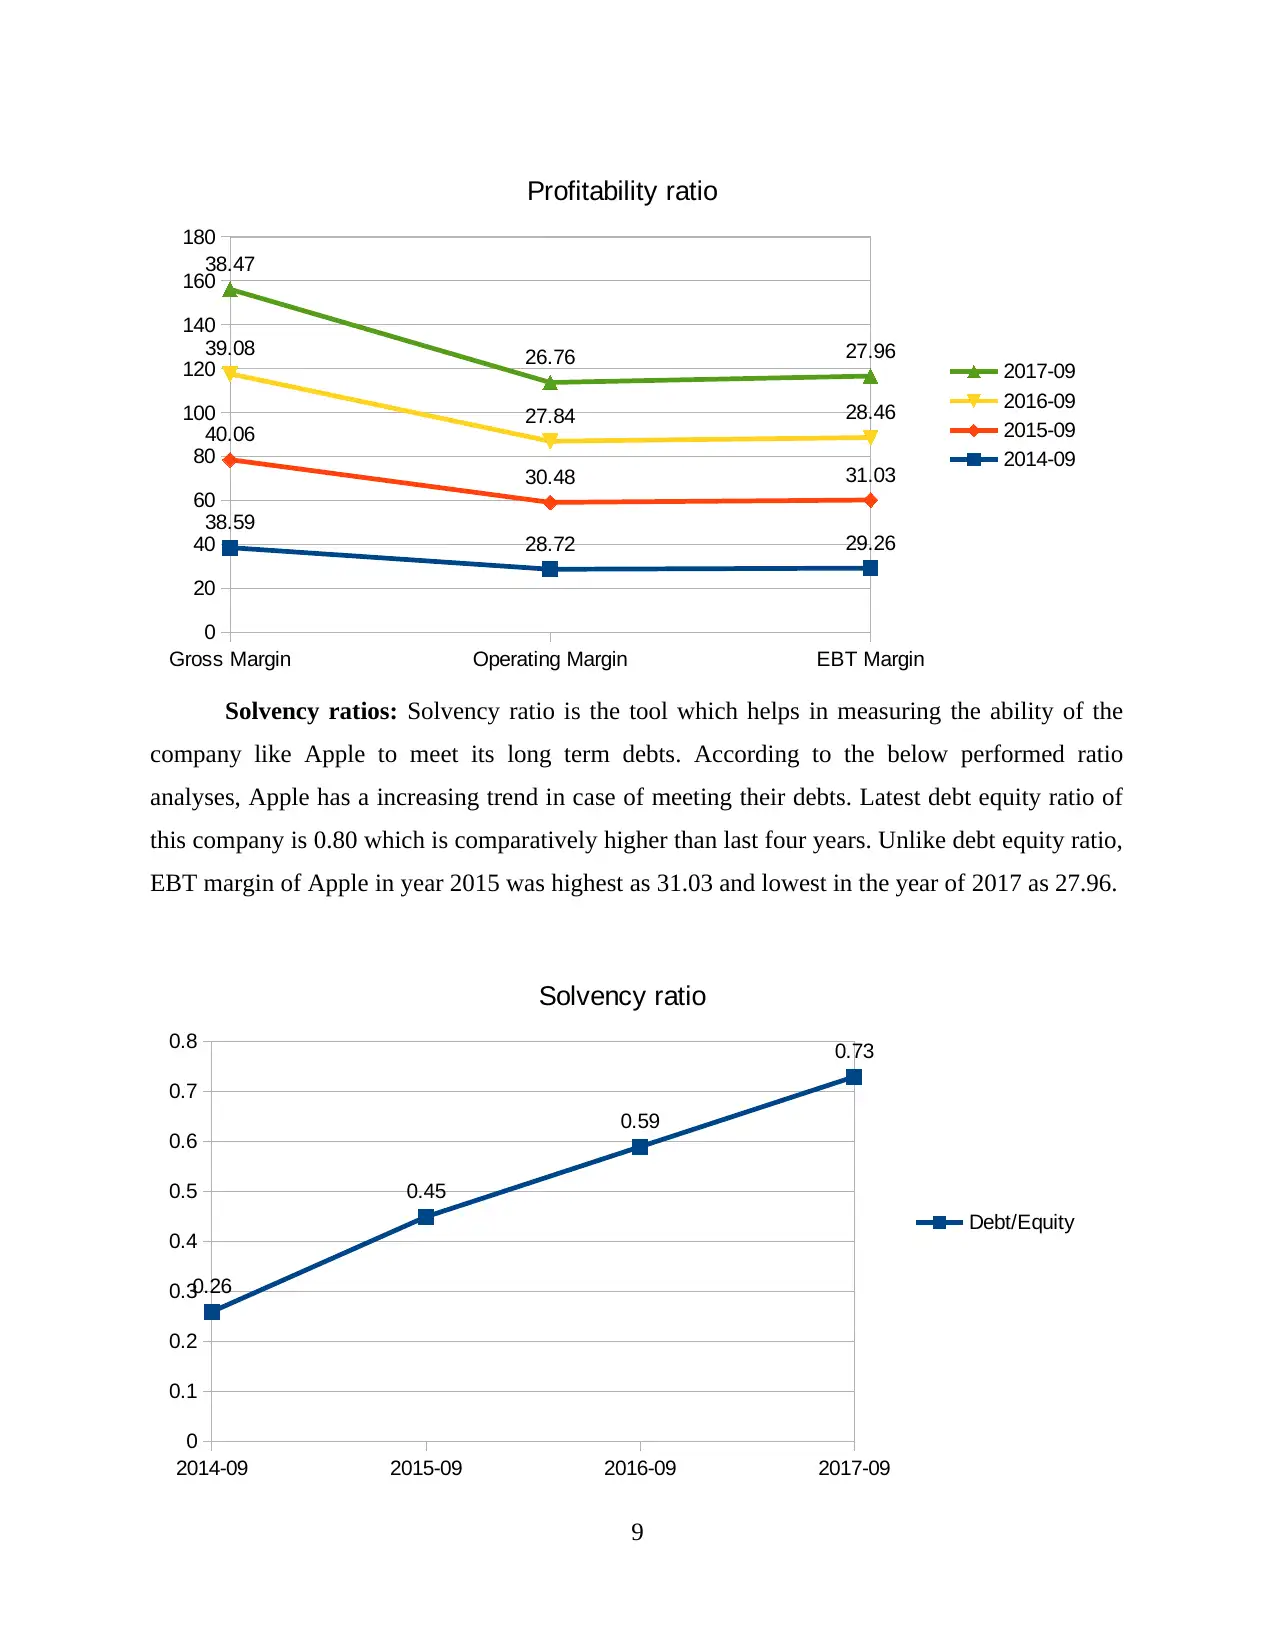
Profitability Ratios: Profitability ratios are the financial tools which helps an
organisation to ascertain the business ability to earn profit against the expenses. According to the
ratio analyses performed below gross margin of year 2015 was highest as 40.06 and lowest in the
latest year 2017 as 38.47 which indicates degrading gross profit earning ability of Apple.
Similarly to gross profit, operating profit margin of Apple company is also reflecting decreasing
trend as operating margin ratio in 2015 was 30.48 and in 2017 is 26.76 .
8
Other — — — —
Operating Margin 28.72 30.48 27.84 26.76
Net Int Inc & Other 0.54 0.55 0.63 1.2
EBT Margin 29.26 31.03 28.46 27.96
Liquidity/Financial Health 2014-09 2015-09 2016-09 2017-09 Latest Qtr
Current Ratio 1.08 1.11 1.35 1.28 1.45
Debt/Equity 0.26 0.45 0.59 0.73 0.8
Profitability Ratios: Profitability ratios are the financial tools which helps an
organisation to ascertain the business ability to earn profit against the expenses. According to the
ratio analyses performed below gross margin of year 2015 was highest as 40.06 and lowest in the
latest year 2017 as 38.47 which indicates degrading gross profit earning ability of Apple.
Similarly to gross profit, operating profit margin of Apple company is also reflecting decreasing
trend as operating margin ratio in 2015 was 30.48 and in 2017 is 26.76 .
8
Paraphrase This Document
Need a fresh take? Get an instant paraphrase of this document with our AI Paraphraser
Gross Margin Operating Margin EBT Margin
0
20
40
60
80
100
120
140
160
180
38.59
28.72 29.26
40.06
30.48 31.03
39.08
27.84 28.46
38.47
26.76 27.96
Profitability ratio
2017-09
2016-09
2015-09
2014-09
Solvency ratios: Solvency ratio is the tool which helps in measuring the ability of the
company like Apple to meet its long term debts. According to the below performed ratio
analyses, Apple has a increasing trend in case of meeting their debts. Latest debt equity ratio of
this company is 0.80 which is comparatively higher than last four years. Unlike debt equity ratio,
EBT margin of Apple in year 2015 was highest as 31.03 and lowest in the year of 2017 as 27.96.
2014-09 2015-09 2016-09 2017-09
0
0.1
0.2
0.3
0.4
0.5
0.6
0.7
0.8
0.26
0.45
0.59
0.73
Solvency ratio
Debt/Equity
9
0
20
40
60
80
100
120
140
160
180
38.59
28.72 29.26
40.06
30.48 31.03
39.08
27.84 28.46
38.47
26.76 27.96
Profitability ratio
2017-09
2016-09
2015-09
2014-09
Solvency ratios: Solvency ratio is the tool which helps in measuring the ability of the
company like Apple to meet its long term debts. According to the below performed ratio
analyses, Apple has a increasing trend in case of meeting their debts. Latest debt equity ratio of
this company is 0.80 which is comparatively higher than last four years. Unlike debt equity ratio,
EBT margin of Apple in year 2015 was highest as 31.03 and lowest in the year of 2017 as 27.96.
2014-09 2015-09 2016-09 2017-09
0
0.1
0.2
0.3
0.4
0.5
0.6
0.7
0.8
0.26
0.45
0.59
0.73
Solvency ratio
Debt/Equity
9
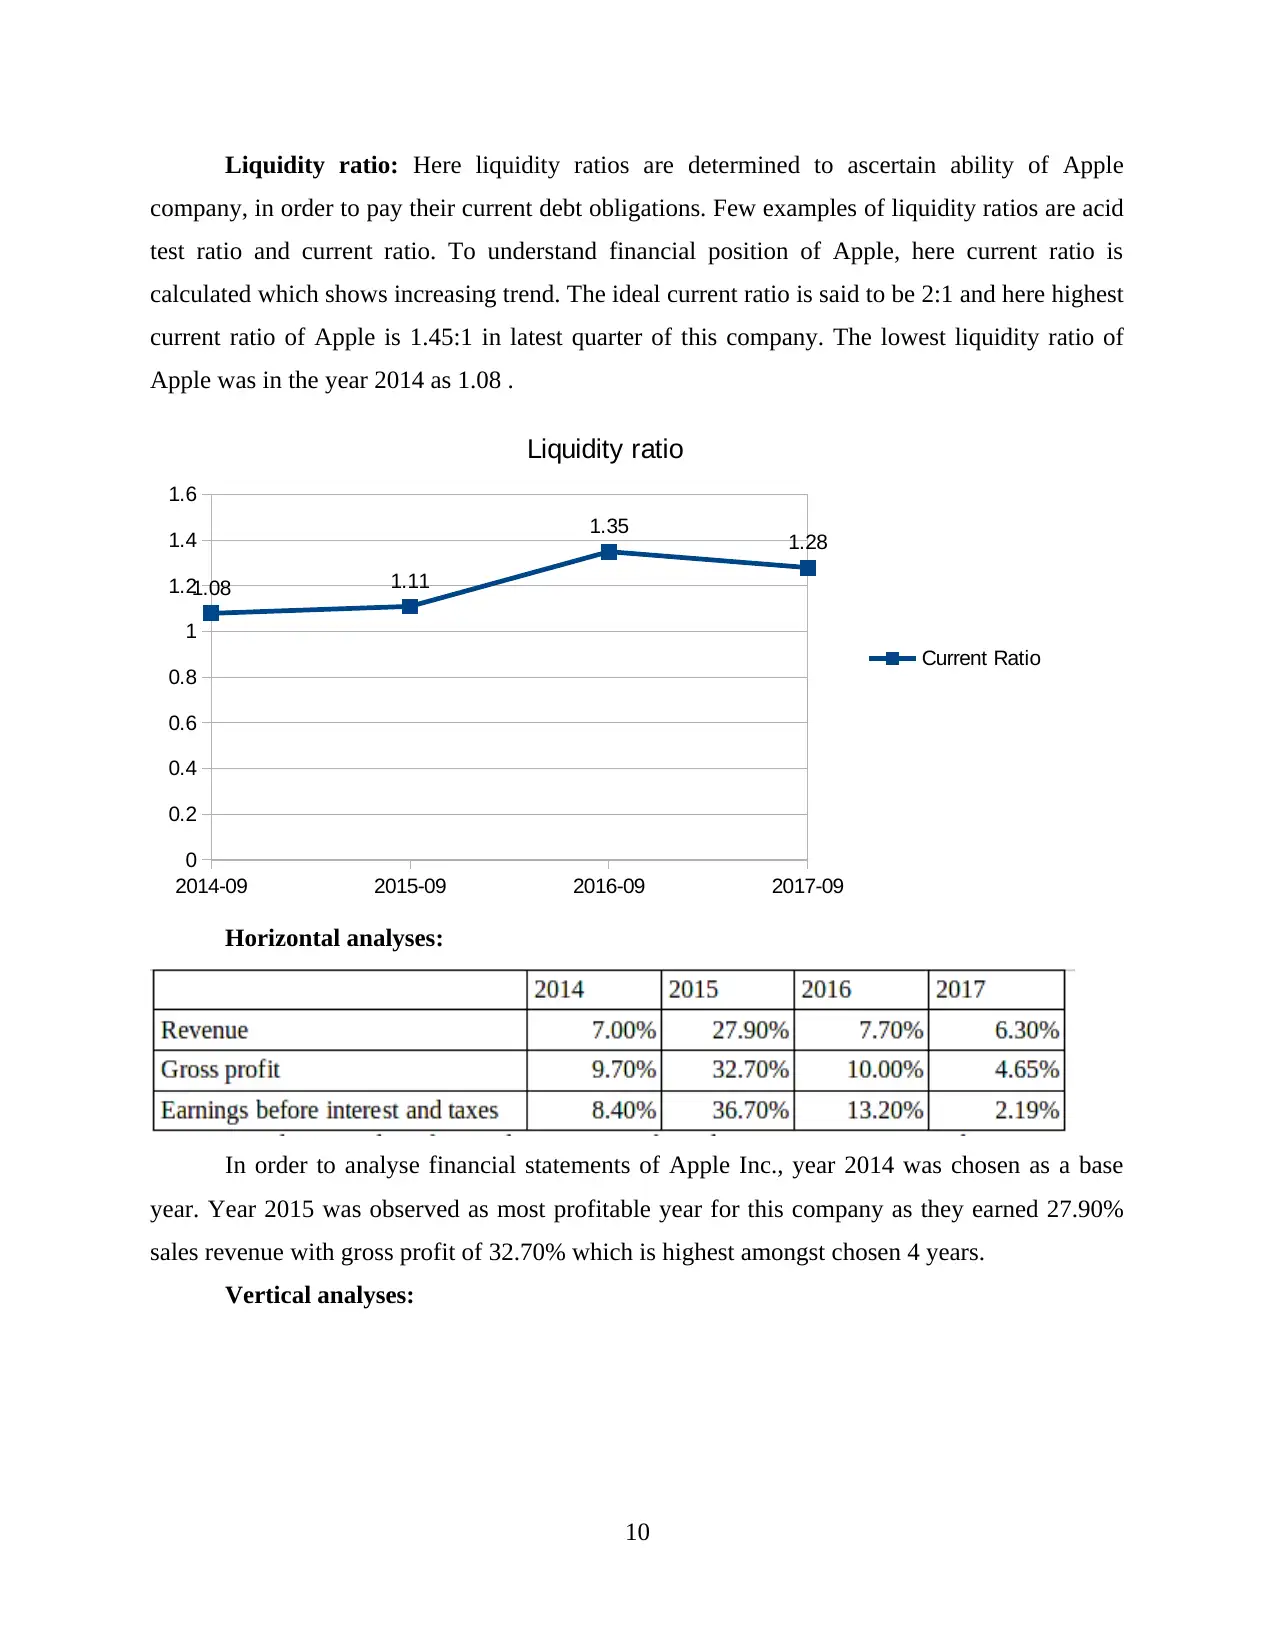
Liquidity ratio: Here liquidity ratios are determined to ascertain ability of Apple
company, in order to pay their current debt obligations. Few examples of liquidity ratios are acid
test ratio and current ratio. To understand financial position of Apple, here current ratio is
calculated which shows increasing trend. The ideal current ratio is said to be 2:1 and here highest
current ratio of Apple is 1.45:1 in latest quarter of this company. The lowest liquidity ratio of
Apple was in the year 2014 as 1.08 .
2014-09 2015-09 2016-09 2017-09
0
0.2
0.4
0.6
0.8
1
1.2
1.4
1.6
1.08 1.11
1.35 1.28
Liquidity ratio
Current Ratio
Horizontal analyses:
In order to analyse financial statements of Apple Inc., year 2014 was chosen as a base
year. Year 2015 was observed as most profitable year for this company as they earned 27.90%
sales revenue with gross profit of 32.70% which is highest amongst chosen 4 years.
Vertical analyses:
10
⊘ This is a preview!⊘
Do you want full access?
Subscribe today to unlock all pages.
Trusted by 1+ million students worldwide
1 out of 24
Related Documents


Your All-in-One AI-Powered Toolkit for Academic Success.
+13062052269
info@desklib.com
Available 24*7 on WhatsApp / Email
![[object Object]](/_next/static/media/star-bottom.7253800d.svg)
Unlock your academic potential
Copyright © 2020–2026 A2Z Services. All Rights Reserved. Developed and managed by ZUCOL.