Financial Analysis of Schmeckt Gut Energy for Expansion Decisions

Verified

Added on  2020/05/08

|12
|1511
|33
Report
AI Summary
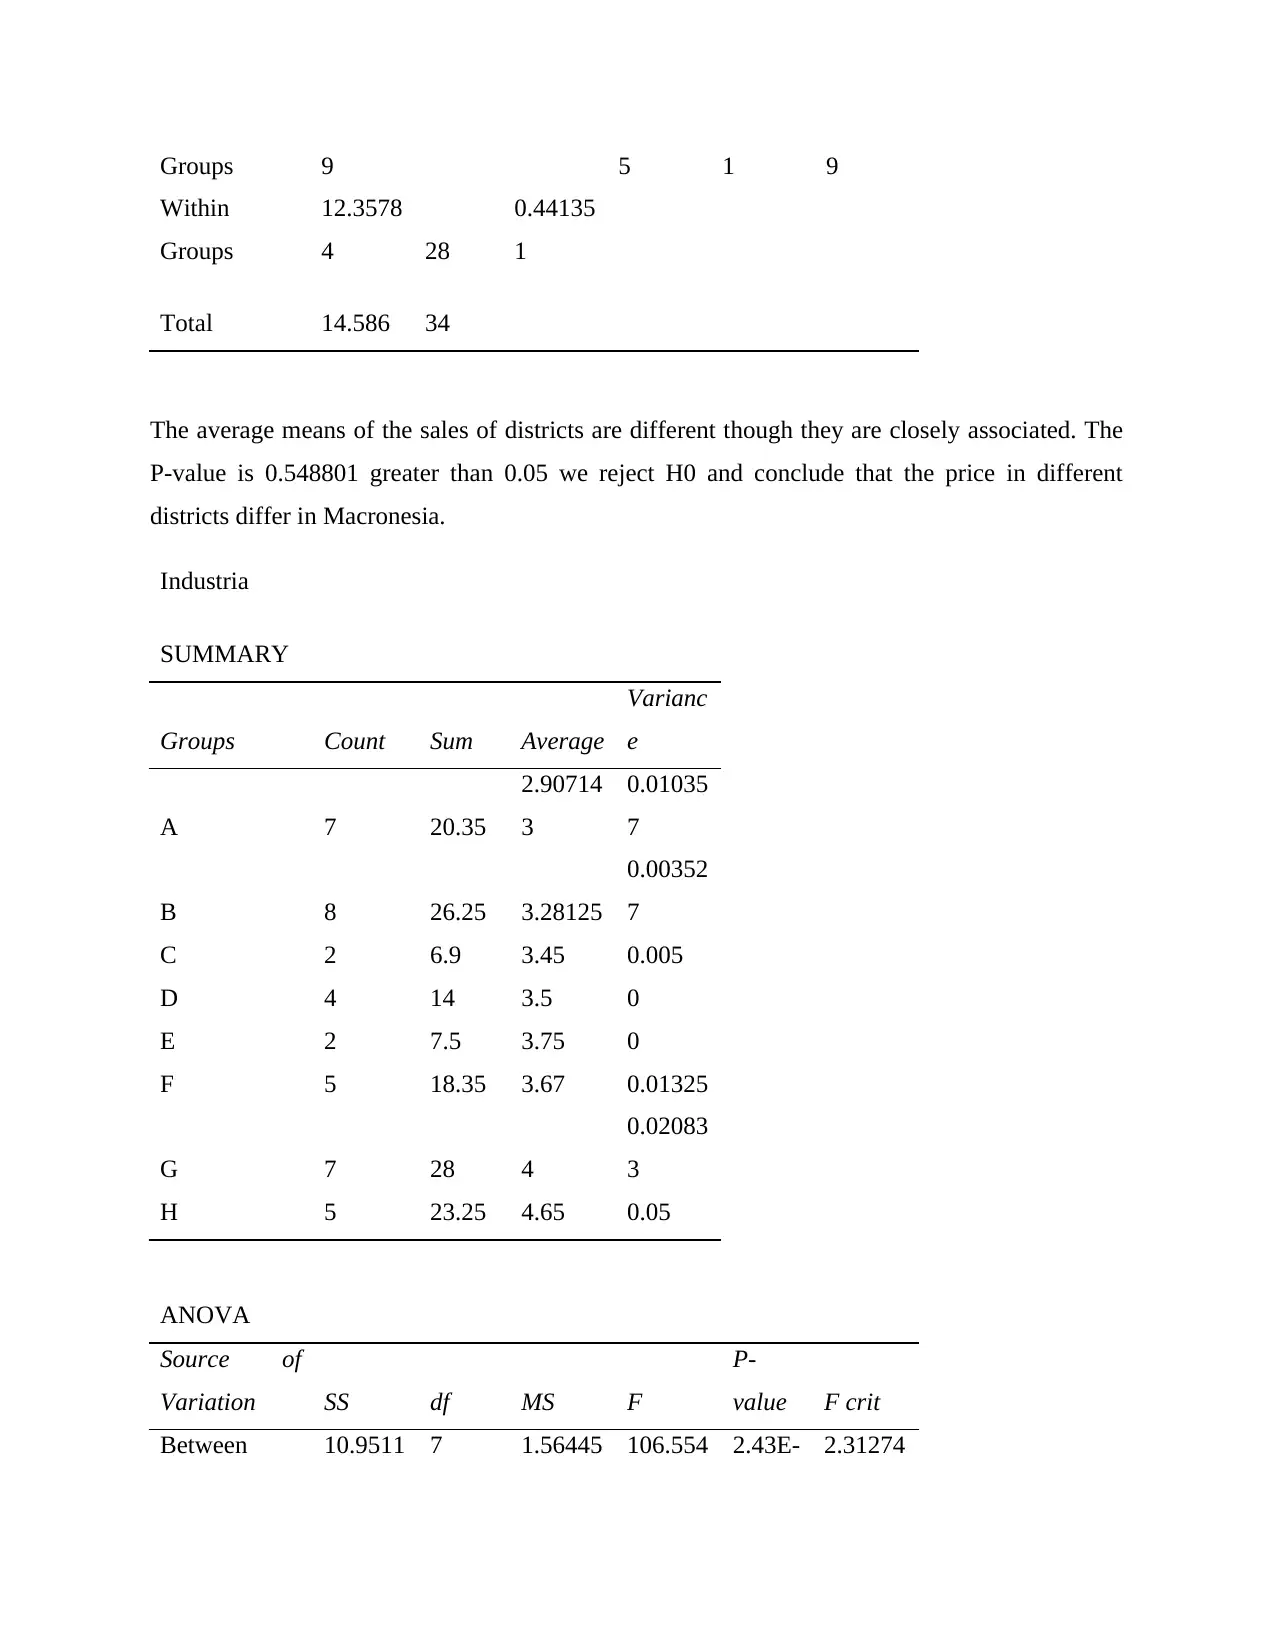
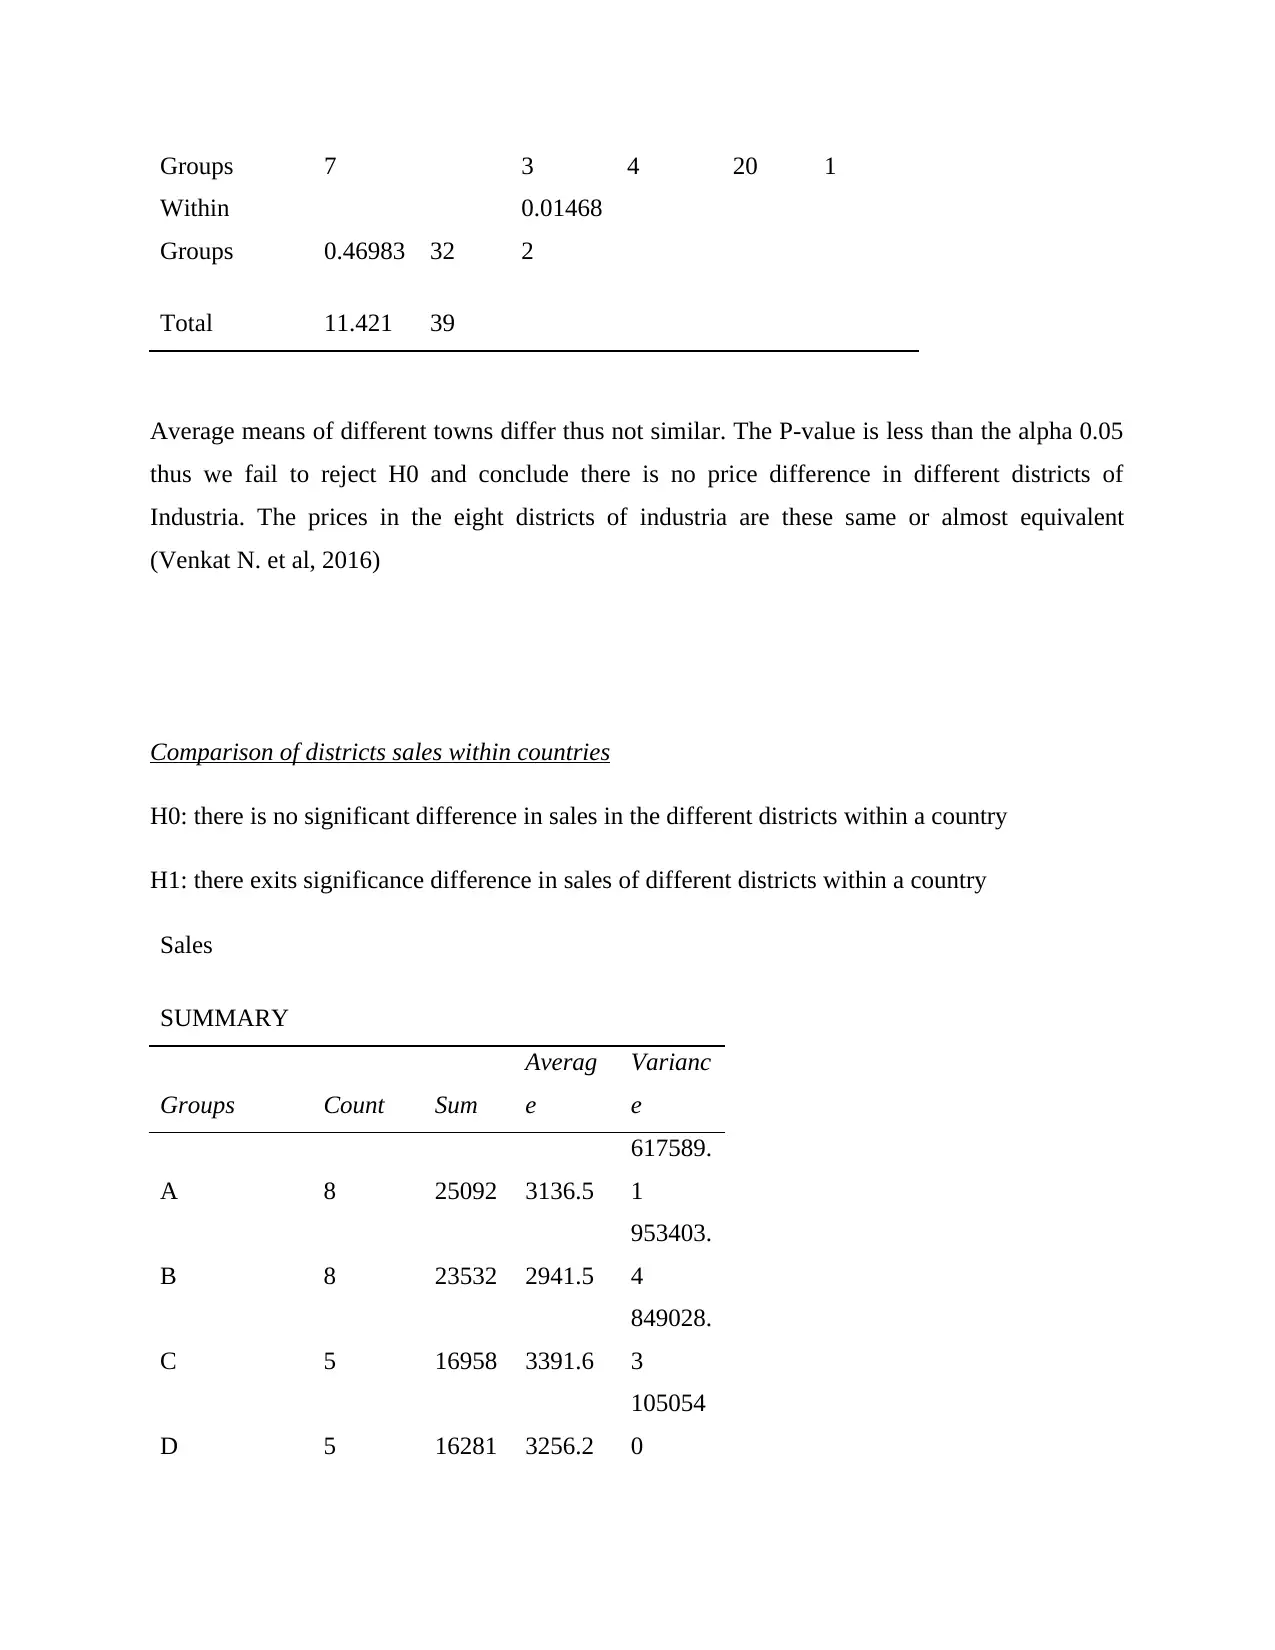
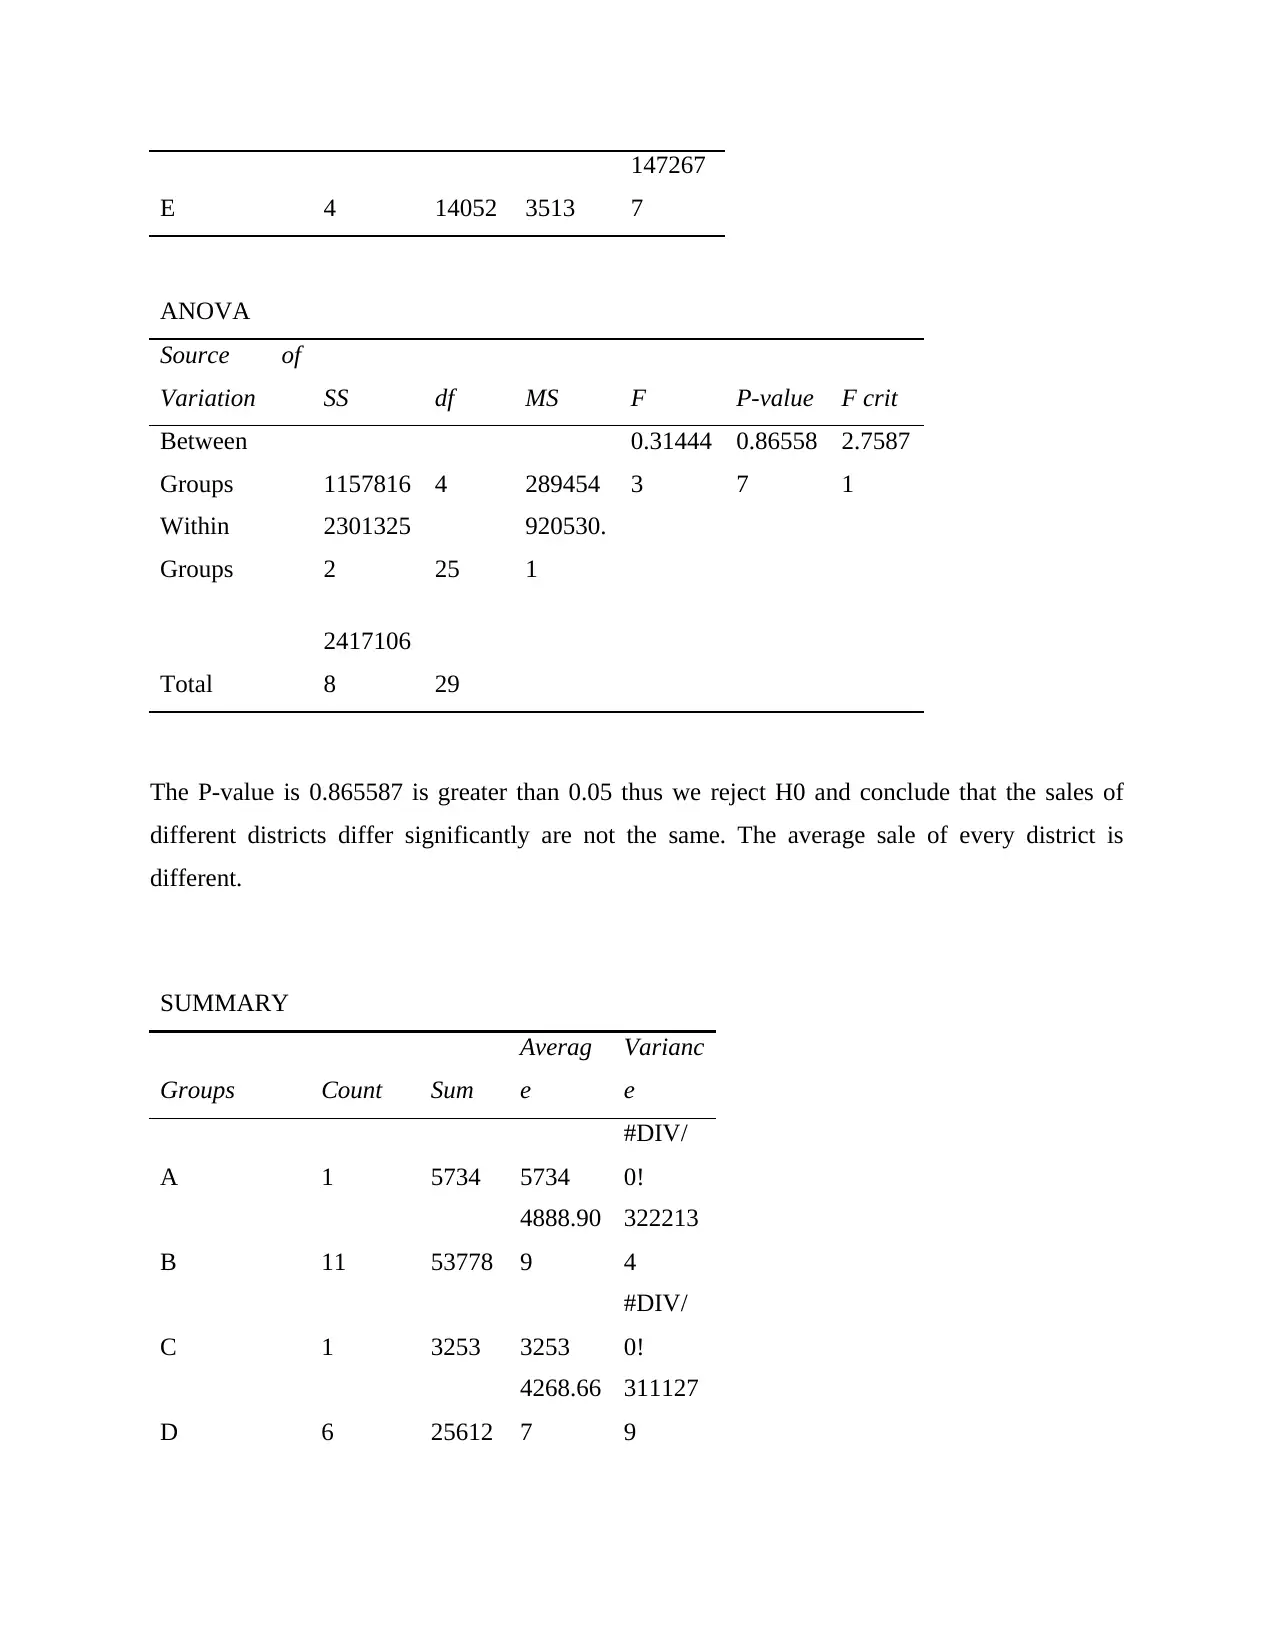
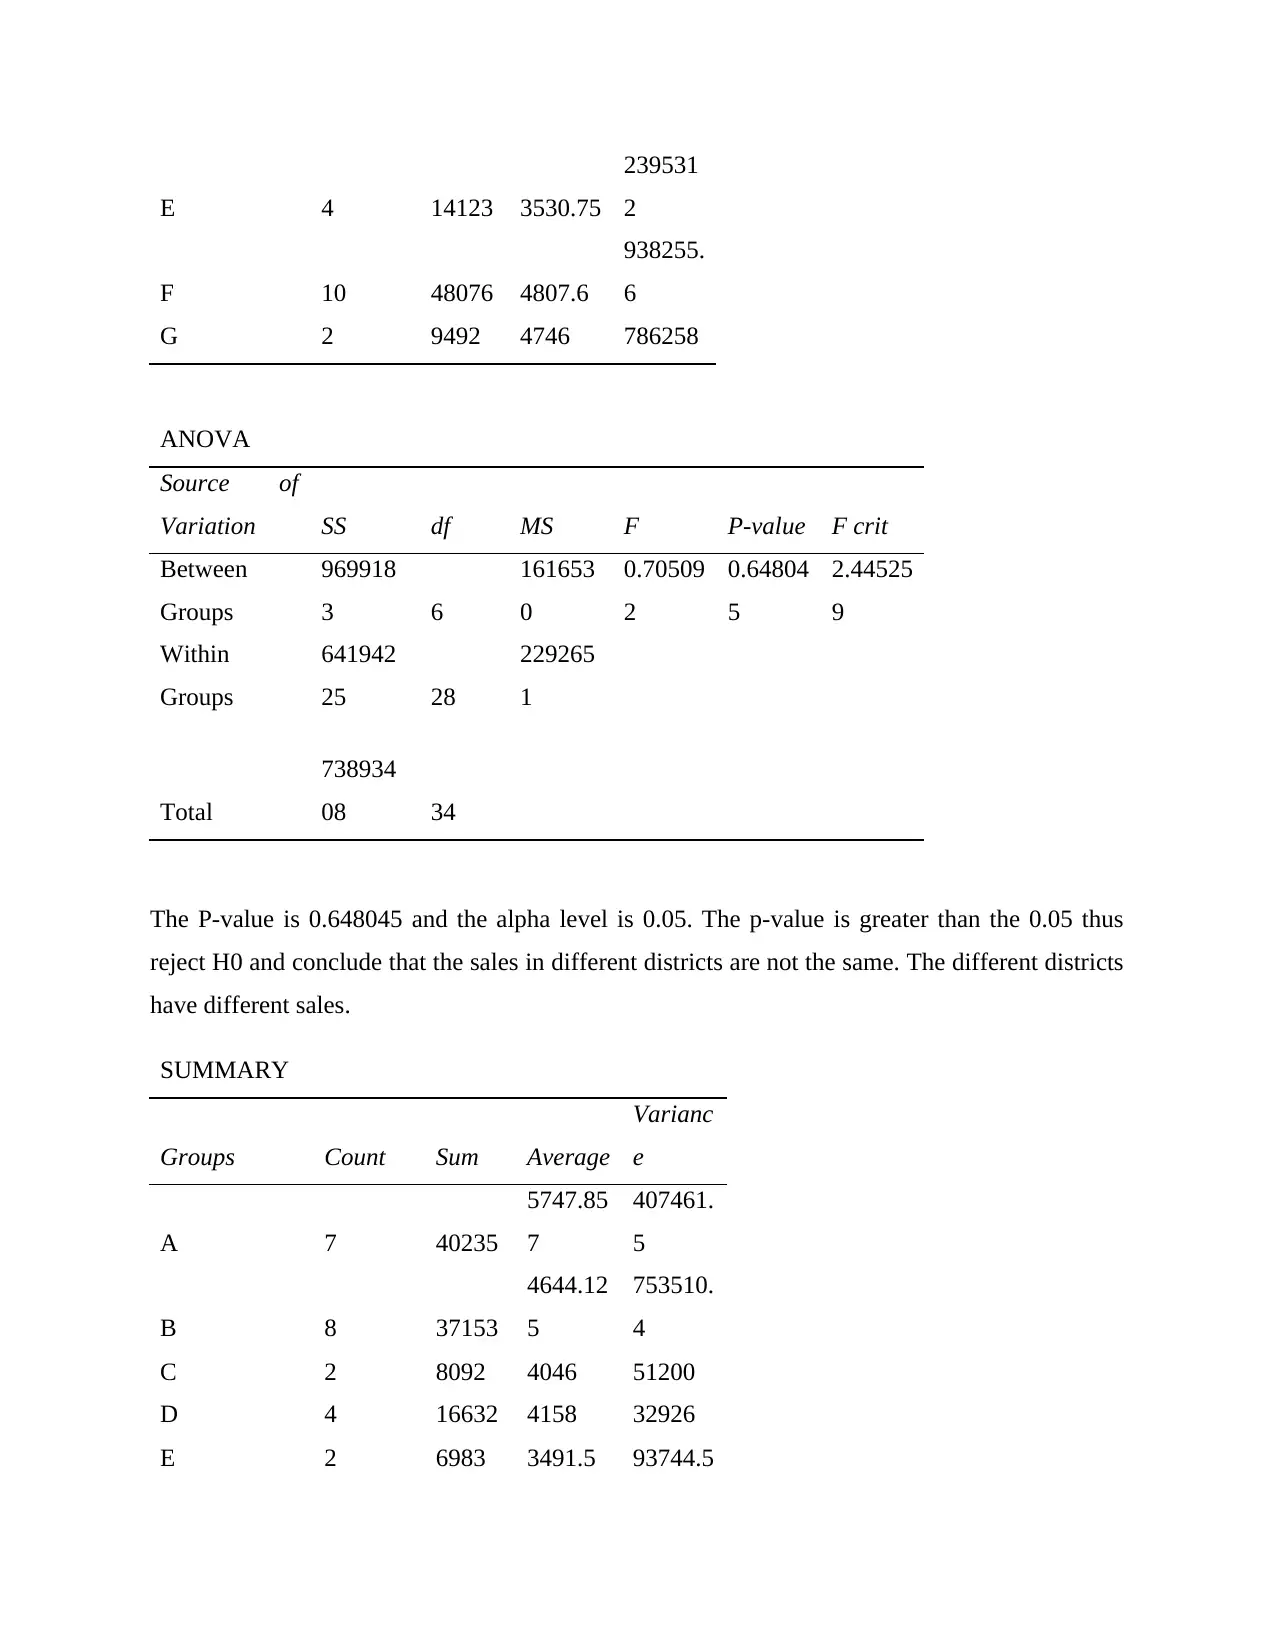
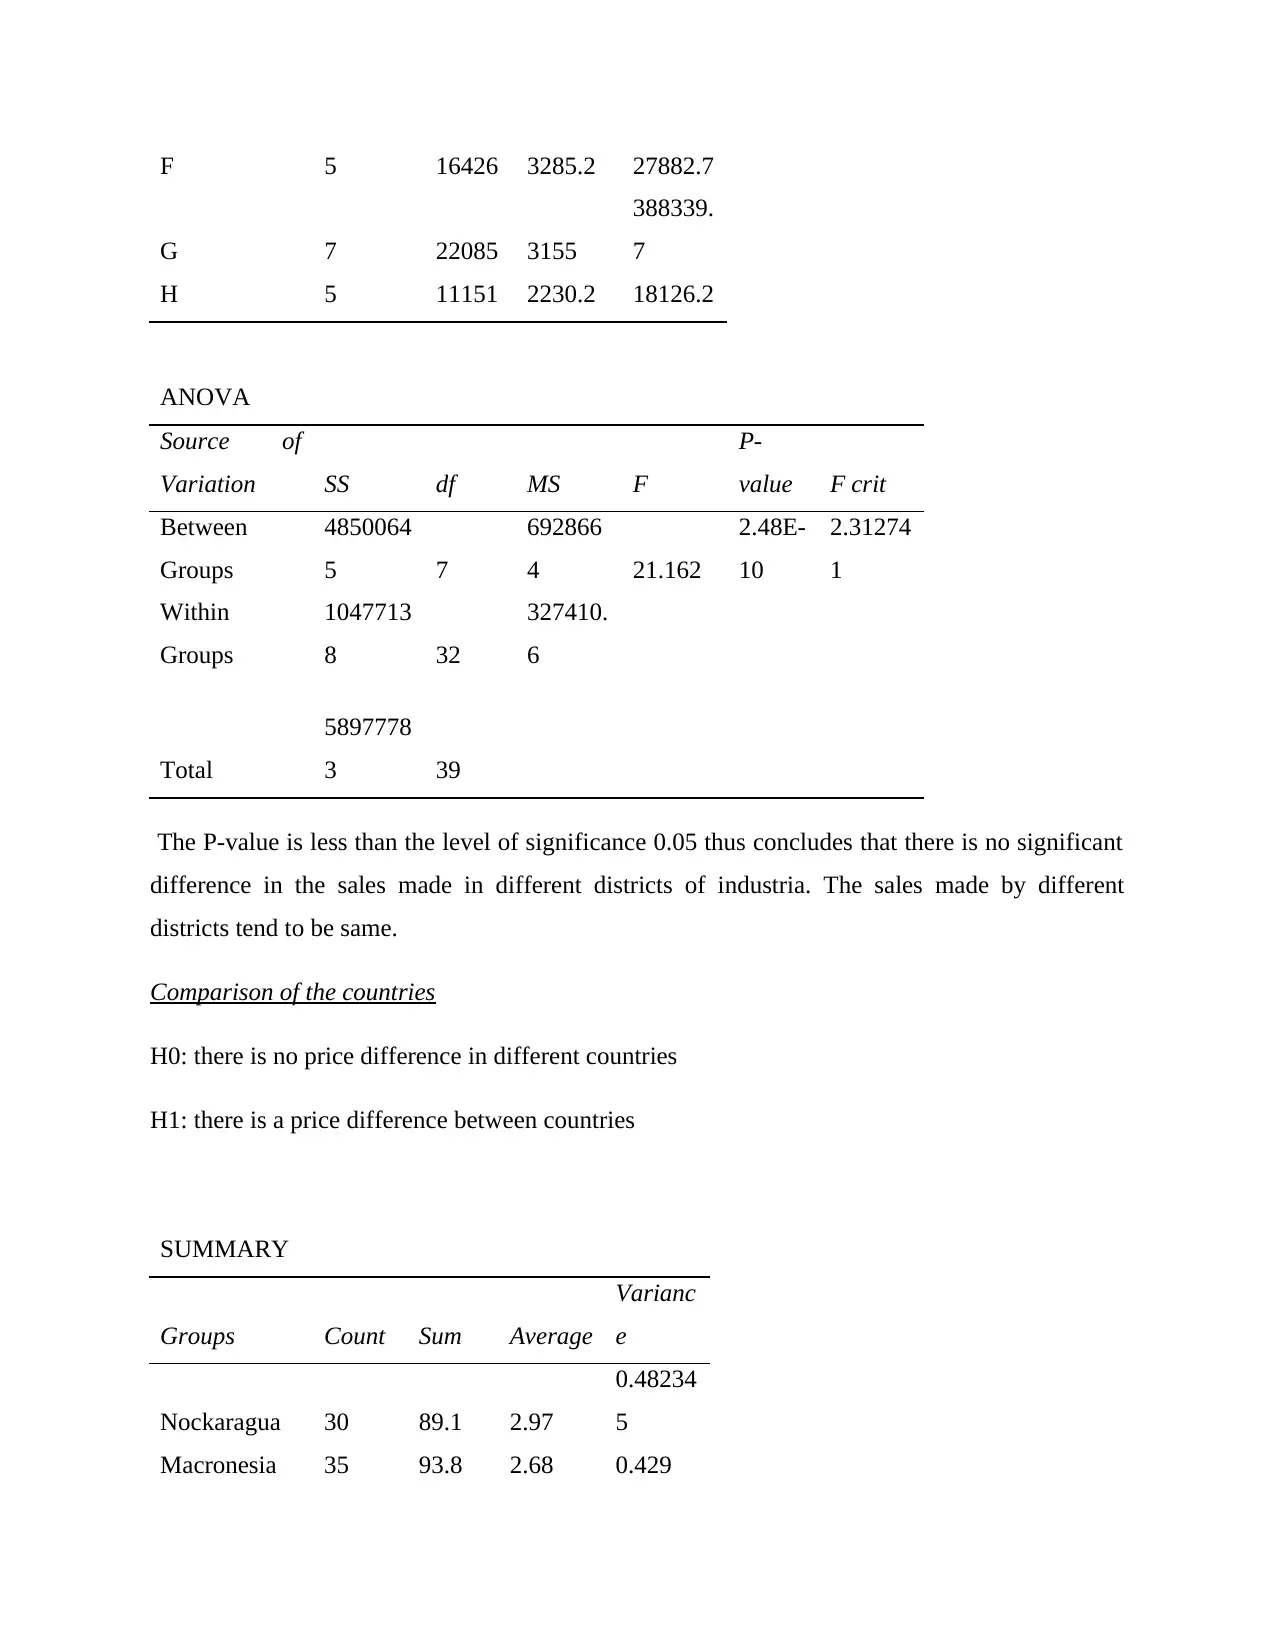
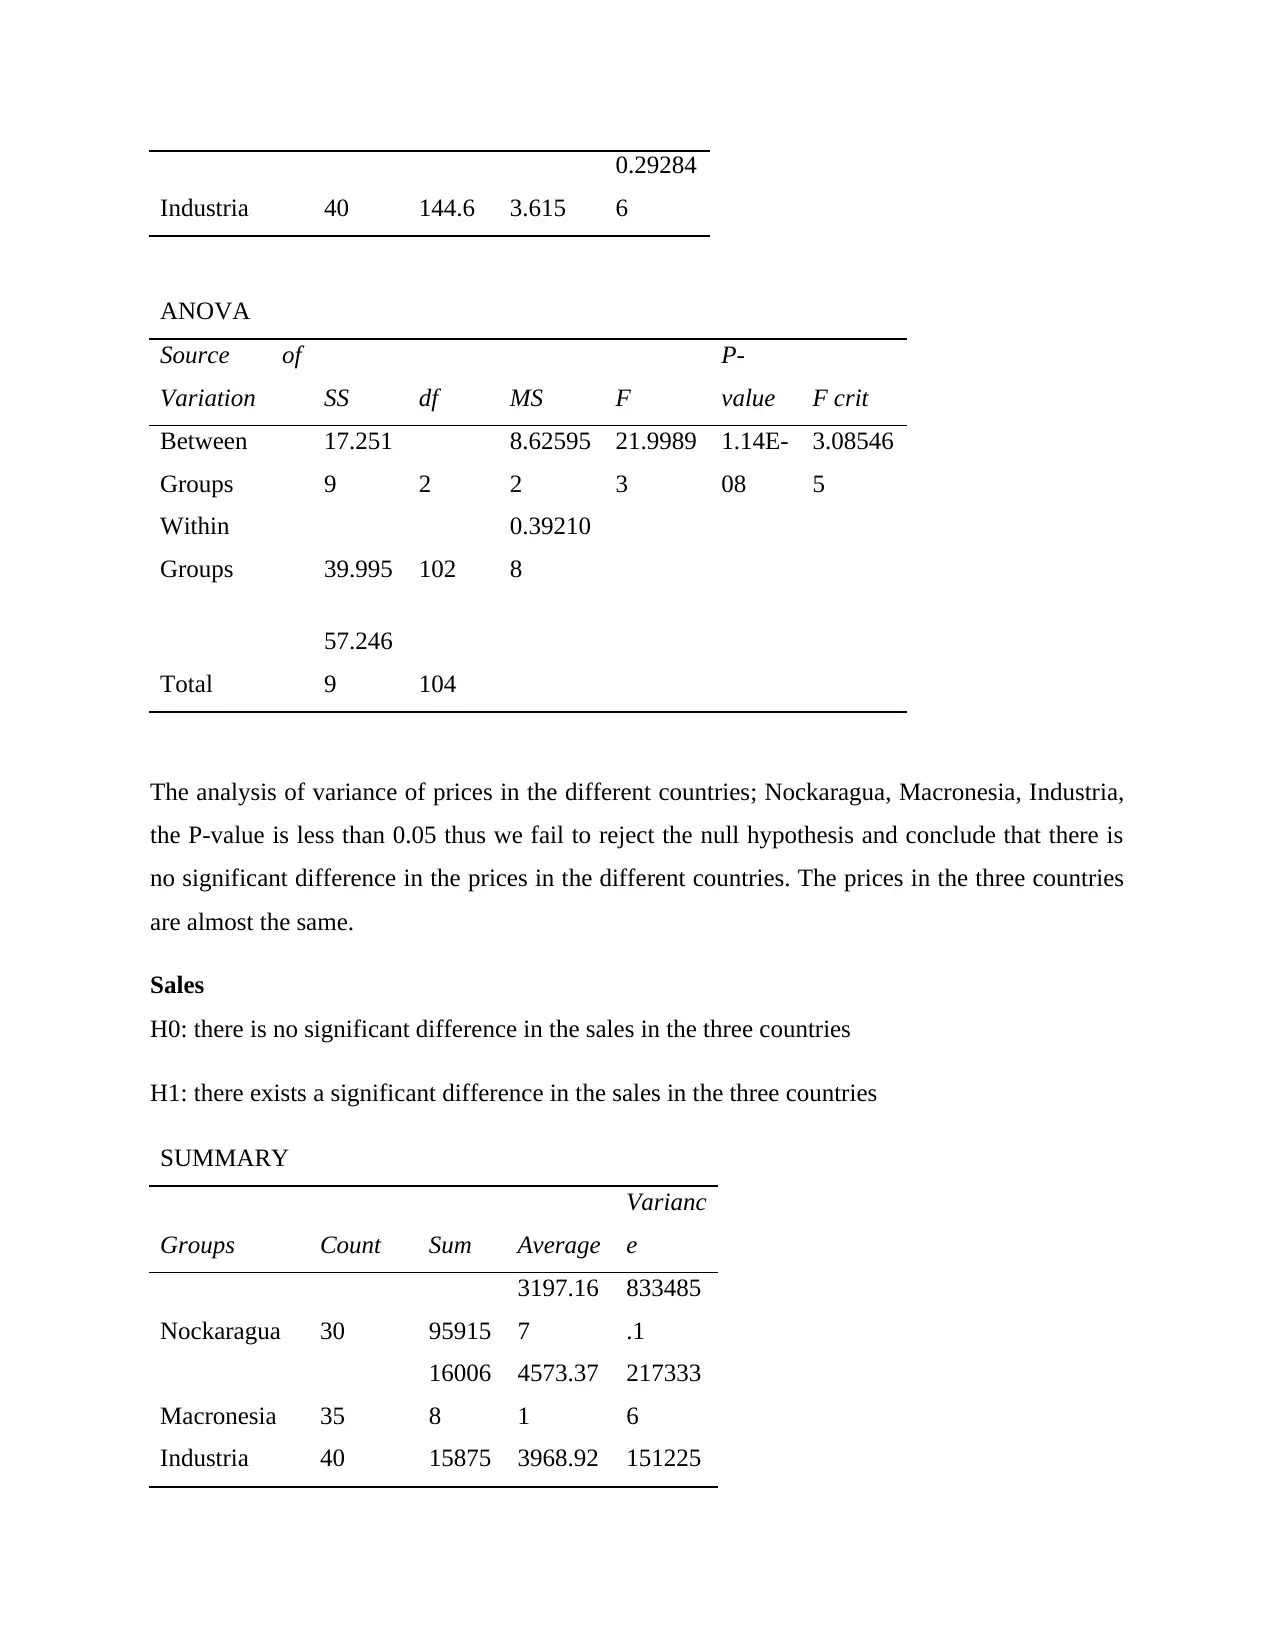
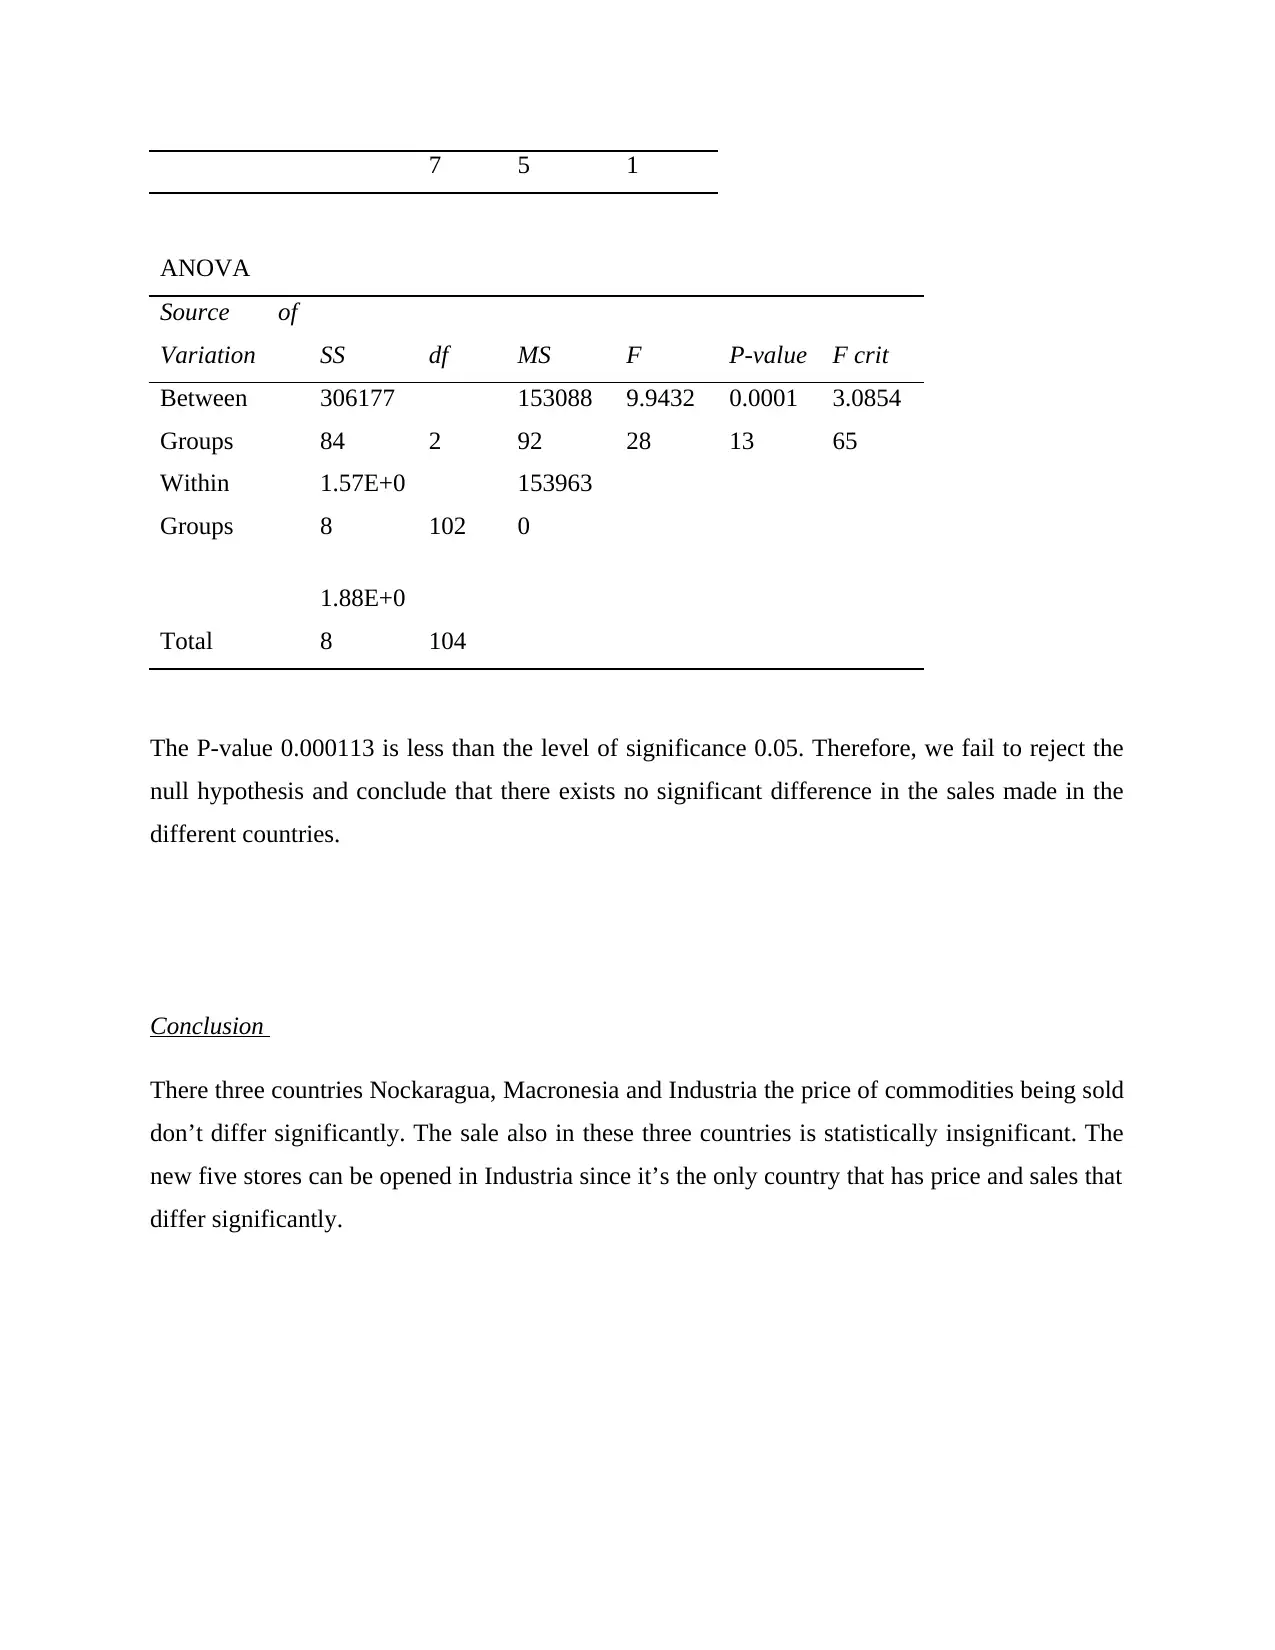
This report presents a financial analysis for Schmeckt Gut Energy, evaluating the potential for expansion into three countries: Nockaragua, Macronesia, and Industria. The analysis uses data collected in 2016, comparing districts within each country and then comparing the countries themselves. Descriptive statistics, including pie charts, are used to illustrate sales and price distributions. Inferential statistics, particularly ANOVA, are employed to determine significant differences in prices and sales across districts and countries. The report concludes that while prices across the three countries are statistically similar, sales differences exist, suggesting that Industria is the most suitable location for new stores. The analysis includes comparisons of districts within each country and the countries as a whole, providing insights into price and sales variations to inform business decisions regarding expansion.
Document Page
STATISTICS FOR FINANCIAL DECISIONS
assignment
The board of Schmeckt Gut Energy is interested in opening new branches in three countries
Nockaragua, Macronesia and Industria. The data used in the analysis was collected in year 2016.
The countries are divided into districts. Nockaragua has five districts A, B, C, D and E.
Macronesia has seven districts A, B, C, D, E, F and G. Industria has eight districts A, B, C, D, E,
F, G and H. The data was record as per different countries and districts.
Data Analysis
Descriptive statistics
26%
26%19%
16%
13%
Nockaragua Districts
A
B
C
D
E
Fig1. A pie chart of Nockaragua districts
The data was collected in 30 stores. The sample selected from Nockaragua country, the pie chart
above indicate that equivalent data from district A and B were recorded represented by 26%.
District C, D and E had 19%, 16% and 13% respectively. The prices of the energy products in
the five districts had a range from 2.0 to 4.5 with an average price of 2.97. The total sale of the
five districts of Nockaragua country is 95915 with a mean sale of 3197.1667.
tabler-icon-diamond-filled.svg

Secure Best Marks with AI Grader

Need help grading? Try our AI Grader for instant feedback on your assignments.
Document Page
A
3%
B
31%
C
3%
D
17%
E
11%
F
28%
G
8%
Macronesia Districts
Fig2. A pie chart of Macronesia district
Sample selected 30% was from district B, followed by F which had 28%. Most of the stores were
located in district B and F. Few stores were located in district A and C represented by 3%. The
prices in these districts ranged from 1.75 to 4 with average price of 2.68. The total sales of
Macronesia districts are 160068 with mean sale of 4573.37.
A
18%
B
20%
C
5%
D
13%E
5%
F
13%
G
15%
H
13%
Industria Districts
Fig3. A pie chart of Industria districts
Document Page
District B had 30% representation in the data recorded followed by A with 17%. This country
has the largest number of district. The mean price of the eight districts is 3.615. The range of
prices is 2.0 to 5.0. The total sale of these districts is 158,757 with average sale as 3968.925
(Charles G., 2016).
Inferential analysis
Comparison of districts within each county
Nockaragua
Ho: there is no significant difference in the prices in different districts
H1: the prices are different in different districts
SUMMARY
Groups Count Sum
Averag
e
Varianc
e
A 8 23.9 2.9875
0.40839
3
B 8 22.45 2.80625
0.51245
5
C 5 16 3.2 1.075
D 5 14.5 2.9 0.28875
E 4 12.25 3.0625
0.51562
5
ANOVA
Source of
Variation SS df MS F P-value F crit
Between
Groups
0.54018
7 4
0.13504
7
0.25105
7
0.90627
6
2.7587
1
Document Page
Within
Groups
13.4478
1 25
0.53791
3
Total 13.988 29
The mean sales of the different towns differ in all the five towns A, B, C, D and E. The analysis
of variance has the p-value as 0.906276 greater than 0.05 we reject Ho we conclude there is
significant difference in the prices in the different districts in Nockaragua.
Macronesia district
SUMMARY
Groups Count Sum
Averag
e
Varianc
e
A 1 1.5 1.5
#DIV/
0!
B 11 29.8
2.70909
1
0.60040
9
C 1 3.25 3.25
#DIV/
0!
D 6 16.5 2.75 0.547
E 4 9.5 2.375
0.22916
7
F 10 27.75 2.775
0.31180
6
G 2 5.5 2.75 0.125
ANOVA
Source of
Variation SS df MS F P-value F crit
Between 2.22815 6 0.37136 0.84141 0.54880 2.44525
tabler-icon-diamond-filled.svg

Secure Best Marks with AI Grader

Need help grading? Try our AI Grader for instant feedback on your assignments.
Document Page
Groups 9 5 1 9
Within
Groups
12.3578
4 28
0.44135
1
Total 14.586 34
The average means of the sales of districts are different though they are closely associated. The
P-value is 0.548801 greater than 0.05 we reject H0 and conclude that the price in different
districts differ in Macronesia.
Industria
SUMMARY
Groups Count Sum Average
Varianc
e
A 7 20.35
2.90714
3
0.01035
7
B 8 26.25 3.28125
0.00352
7
C 2 6.9 3.45 0.005
D 4 14 3.5 0
E 2 7.5 3.75 0
F 5 18.35 3.67 0.01325
G 7 28 4
0.02083
3
H 5 23.25 4.65 0.05
ANOVA
Source of
Variation SS df MS F
P-
value F crit
Between 10.9511 7 1.56445 106.554 2.43E- 2.31274
Document Page
Groups 7 3 4 20 1
Within
Groups 0.46983 32
0.01468
2
Total 11.421 39
Average means of different towns differ thus not similar. The P-value is less than the alpha 0.05
thus we fail to reject H0 and conclude there is no price difference in different districts of
Industria. The prices in the eight districts of industria are these same or almost equivalent
(Venkat N. et al, 2016)
Comparison of districts sales within countries
H0: there is no significant difference in sales in the different districts within a country
H1: there exits significance difference in sales of different districts within a country
Sales
SUMMARY
Groups Count Sum
Averag
e
Varianc
e
A 8 25092 3136.5
617589.
1
B 8 23532 2941.5
953403.
4
C 5 16958 3391.6
849028.
3
D 5 16281 3256.2
105054
0
Document Page
E 4 14052 3513
147267
7
ANOVA
Source of
Variation SS df MS F P-value F crit
Between
Groups 1157816 4 289454
0.31444
3
0.86558
7
2.7587
1
Within
Groups
2301325
2 25
920530.
1
Total
2417106
8 29
The P-value is 0.865587 is greater than 0.05 thus we reject H0 and conclude that the sales of
different districts differ significantly are not the same. The average sale of every district is
different.
SUMMARY
Groups Count Sum
Averag
e
Varianc
e
A 1 5734 5734
#DIV/
0!
B 11 53778
4888.90
9
322213
4
C 1 3253 3253
#DIV/
0!
D 6 25612
4268.66
7
311127
9
tabler-icon-diamond-filled.svg

Paraphrase This Document

Need a fresh take? Get an instant paraphrase of this document with our AI Paraphraser
Document Page
E 4 14123 3530.75
239531
2
F 10 48076 4807.6
938255.
6
G 2 9492 4746 786258
ANOVA
Source of
Variation SS df MS F P-value F crit
Between
Groups
969918
3 6
161653
0
0.70509
2
0.64804
5
2.44525
9
Within
Groups
641942
25 28
229265
1
Total
738934
08 34
The P-value is 0.648045 and the alpha level is 0.05. The p-value is greater than the 0.05 thus
reject H0 and conclude that the sales in different districts are not the same. The different districts
have different sales.
SUMMARY
Groups Count Sum Average
Varianc
e
A 7 40235
5747.85
7
407461.
5
B 8 37153
4644.12
5
753510.
4
C 2 8092 4046 51200
D 4 16632 4158 32926
E 2 6983 3491.5 93744.5
Document Page
F 5 16426 3285.2 27882.7
G 7 22085 3155
388339.
7
H 5 11151 2230.2 18126.2
ANOVA
Source of
Variation SS df MS F
P-
value F crit
Between
Groups
4850064
5 7
692866
4 21.162
2.48E-
10
2.31274
1
Within
Groups
1047713
8 32
327410.
6
Total
5897778
3 39
The P-value is less than the level of significance 0.05 thus concludes that there is no significant
difference in the sales made in different districts of industria. The sales made by different
districts tend to be same.
Comparison of the countries
H0: there is no price difference in different countries
H1: there is a price difference between countries
SUMMARY
Groups Count Sum Average
Varianc
e
Nockaragua 30 89.1 2.97
0.48234
5
Macronesia 35 93.8 2.68 0.429
Document Page
Industria 40 144.6 3.615
0.29284
6
ANOVA
Source of
Variation SS df MS F
P-
value F crit
Between
Groups
17.251
9 2
8.62595
2
21.9989
3
1.14E-
08
3.08546
5
Within
Groups 39.995 102
0.39210
8
Total
57.246
9 104
The analysis of variance of prices in the different countries; Nockaragua, Macronesia, Industria,
the P-value is less than 0.05 thus we fail to reject the null hypothesis and conclude that there is
no significant difference in the prices in the different countries. The prices in the three countries
are almost the same.
Sales
H0: there is no significant difference in the sales in the three countries
H1: there exists a significant difference in the sales in the three countries
SUMMARY
Groups Count Sum Average
Varianc
e
Nockaragua 30 95915
3197.16
7
833485
.1
Macronesia 35
16006
8
4573.37
1
217333
6
Industria 40 15875 3968.92 151225
tabler-icon-diamond-filled.svg

Secure Best Marks with AI Grader

Need help grading? Try our AI Grader for instant feedback on your assignments.
Document Page
7 5 1
ANOVA
Source of
Variation SS df MS F P-value F crit
Between
Groups
306177
84 2
153088
92
9.9432
28
0.0001
13
3.0854
65
Within
Groups
1.57E+0
8 102
153963
0
Total
1.88E+0
8 104
The P-value 0.000113 is less than the level of significance 0.05. Therefore, we fail to reject the
null hypothesis and conclude that there exists no significant difference in the sales made in the
different countries.
Conclusion
There three countries Nockaragua, Macronesia and Industria the price of commodities being sold
don’t differ significantly. The sale also in these three countries is statistically insignificant. The
new five stores can be opened in Industria since it’s the only country that has price and sales that
differ significantly.
Document Page
References
Neuman, W. (2014). Social Research Method: Qualitative and Quantitative Approaches, 7th
Edition. Pearson Education Limited:UK
Perry, J. & Perry, E. (2014). Contemporary Society: A Introduction to Social Science, 12th
Edition Pearson Education, Inc: Singapore
chevron_up_icon
1 out of 12
circle_padding
hide_on_mobile
zoom_out_icon
logo.png

Your All-in-One AI-Powered Toolkit for Academic Success.

Available 24*7 on WhatsApp / Email

[object Object]