Financial Analysis of SEEK Limited: Performance, Strategy, and Outlook
VerifiedAdded on 2023/04/21
|38
|8264
|474
Report
AI Summary
This report provides a comprehensive financial analysis of SEEK Limited, an Australian-based company in the employment services industry. The analysis includes an executive summary, an overview of the company's operations, and a detailed examination of its financial performance from 2013 to 2018, including profitability, revenue, and key financial ratios. It explores the company's corporate strategy, management structure, and shareholder value generation strategies. Furthermore, it applies Porter's Five Forces and SWOT analysis to assess the competitive environment. The report also includes industry comparisons, market share analysis, and equity valuation using dividend discount and free cash flow models, culminating in an investment recommendation. Additionally, the report addresses industry trends, the macroeconomic environment, and potential investment risks associated with the company.
Running head: FINANCIAL ANALYSIS
Seek Limited
Name of the Student:
Name of the University:
Author’s Note:
Seek Limited
Name of the Student:
Name of the University:
Author’s Note:
Paraphrase This Document
Need a fresh take? Get an instant paraphrase of this document with our AI Paraphraser
1SEEK LIMITED
Executive Summary
The aim of the assignment is to conduct a financial analysis of Seek Limited Company an
Australian based company operating in the employment service industry. The company helps the
job seeker and companies find a righty platform and right candidate for creation of employment
opportunities. The company is a publically listed company listed in the Australia Stock Exchange
with its ticker symbol SEK. The investment recommendation for the company was based on the
financial analysis done on the company and the included various business and macroeconomic
factors associated with the same. The industry outlook for the company is primarily dependent
on the overall growth of the various companies in the terms of their operations and the services
companies expand. The employment generation services is highly related to the performance of
the Australian economy and the relative performance thereon. The key domestic global
challenges and other issues were also addressed in the assignment where the operations of the
company is also affected by the global macroeconomic outlook. The company uses various types
of strategy for the operations of the company in the terms of the operations of the company i.e.,
placement strategy. The company has its operation spread on a global basis, which allows the
company to earn revenue from the varied source basis. The company operates in a competitive
environment where the global competitive level is high for the company and competition for the
company is generally seen from the various domestic and global players in the market. The trend
for the company in the field of changing labour market trends and rapid development observed in
the technology field is some of the key area where the company needs to focus on. The
investment risk associated with the company is comparatively high and a sell recommendation
will be given for the company as it is highly correlated with the global and macroeconomic
factors of the Australian economy where the performance of the company is dependent.
2SEEK LIMITED
Table of Contents
Introduction......................................................................................................................................4
Discussion........................................................................................................................................5
Overview Analysis.......................................................................................................................5
Financial Analysis...................................................................................................................5
Corporate Strategy.......................................................................................................................6
Management Structure.............................................................................................................6
Shareholder’s Value Generation Strategies.............................................................................6
Porter’s Five Forces.....................................................................................................................7
SWOT Analysis...........................................................................................................................9
Industry Comparison and Projections..........................................................................................9
Major Competitors and Market Share...................................................................................10
Financial Performance...........................................................................................................11
Ratio Analysis........................................................................................................................12
Du Pont Analysis...................................................................................................................16
Industry Trends/ Economic Environment..................................................................................19
Micro Economic Environment..............................................................................................19
Macro-Economic Environment.............................................................................................20
Equity Valuation........................................................................................................................22
Dividend Discount Model......................................................................................................22
⊘ This is a preview!⊘
Do you want full access?
Subscribe today to unlock all pages.
Trusted by 1+ million students worldwide
3SEEK LIMITED
Free Cash Flow Model...........................................................................................................23
Relative Valuation Method....................................................................................................23
Investment Analysis...................................................................................................................24
Conclusion.....................................................................................................................................25
Reference.......................................................................................................................................26
Appendix........................................................................................................................................30
Paraphrase This Document
Need a fresh take? Get an instant paraphrase of this document with our AI Paraphraser
4SEEK LIMITED
Introduction
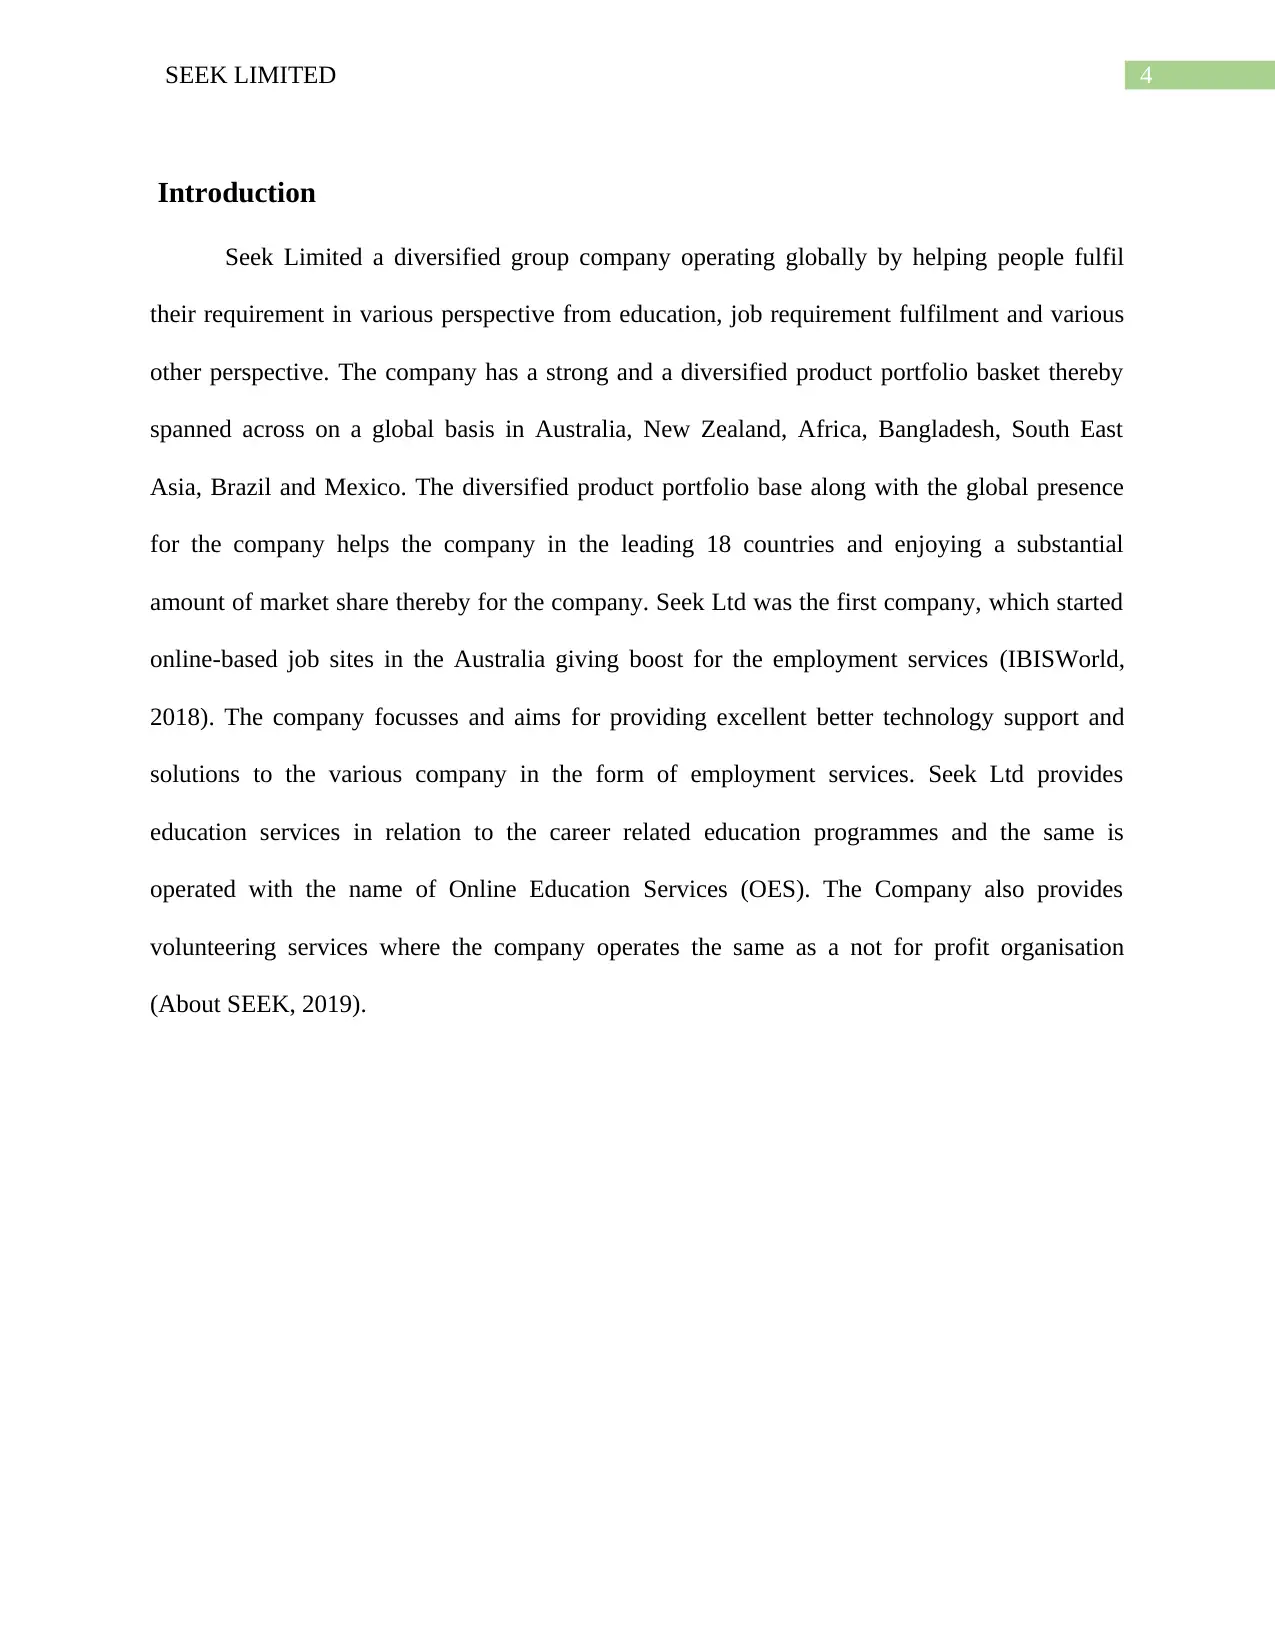
Seek Limited a diversified group company operating globally by helping people fulfil
their requirement in various perspective from education, job requirement fulfilment and various
other perspective. The company has a strong and a diversified product portfolio basket thereby
spanned across on a global basis in Australia, New Zealand, Africa, Bangladesh, South East
Asia, Brazil and Mexico. The diversified product portfolio base along with the global presence
for the company helps the company in the leading 18 countries and enjoying a substantial
amount of market share thereby for the company. Seek Ltd was the first company, which started
online-based job sites in the Australia giving boost for the employment services (IBISWorld,
2018). The company focusses and aims for providing excellent better technology support and
solutions to the various company in the form of employment services. Seek Ltd provides
education services in relation to the career related education programmes and the same is
operated with the name of Online Education Services (OES). The Company also provides
volunteering services where the company operates the same as a not for profit organisation
(About SEEK, 2019).
Introduction
Seek Limited a diversified group company operating globally by helping people fulfil
their requirement in various perspective from education, job requirement fulfilment and various
other perspective. The company has a strong and a diversified product portfolio basket thereby
spanned across on a global basis in Australia, New Zealand, Africa, Bangladesh, South East
Asia, Brazil and Mexico. The diversified product portfolio base along with the global presence
for the company helps the company in the leading 18 countries and enjoying a substantial
amount of market share thereby for the company. Seek Ltd was the first company, which started
online-based job sites in the Australia giving boost for the employment services (IBISWorld,
2018). The company focusses and aims for providing excellent better technology support and
solutions to the various company in the form of employment services. Seek Ltd provides
education services in relation to the career related education programmes and the same is
operated with the name of Online Education Services (OES). The Company also provides
volunteering services where the company operates the same as a not for profit organisation
(About SEEK, 2019).
5SEEK LIMITED
(Source: About SEEK 2019).
Discussion
Overview Analysis
Financial Analysis
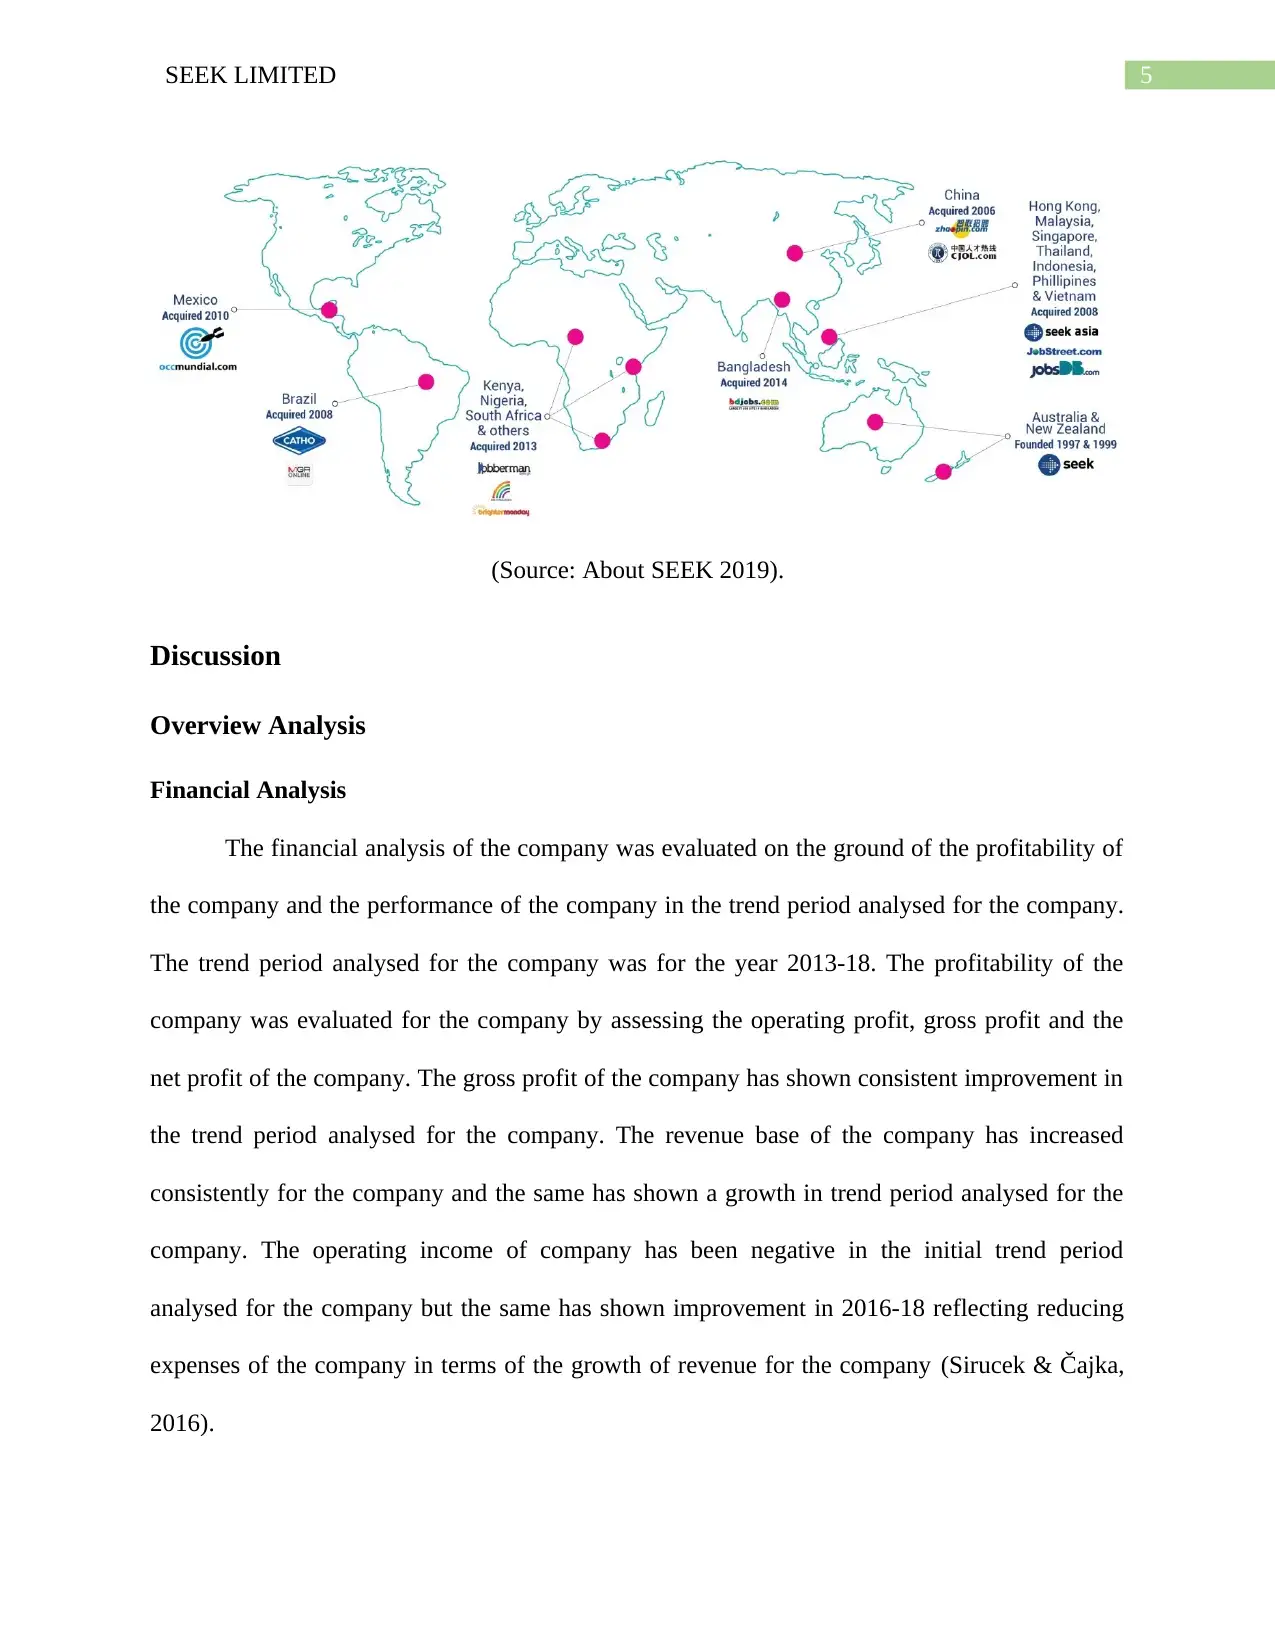
The financial analysis of the company was evaluated on the ground of the profitability of
the company and the performance of the company in the trend period analysed for the company.
The trend period analysed for the company was for the year 2013-18. The profitability of the
company was evaluated for the company by assessing the operating profit, gross profit and the
net profit of the company. The gross profit of the company has shown consistent improvement in
the trend period analysed for the company. The revenue base of the company has increased
consistently for the company and the same has shown a growth in trend period analysed for the
company. The operating income of company has been negative in the initial trend period
analysed for the company but the same has shown improvement in 2016-18 reflecting reducing
expenses of the company in terms of the growth of revenue for the company (Sirucek & Čajka,
2016).
(Source: About SEEK 2019).
Discussion
Overview Analysis
Financial Analysis
The financial analysis of the company was evaluated on the ground of the profitability of
the company and the performance of the company in the trend period analysed for the company.
The trend period analysed for the company was for the year 2013-18. The profitability of the
company was evaluated for the company by assessing the operating profit, gross profit and the
net profit of the company. The gross profit of the company has shown consistent improvement in
the trend period analysed for the company. The revenue base of the company has increased
consistently for the company and the same has shown a growth in trend period analysed for the
company. The operating income of company has been negative in the initial trend period
analysed for the company but the same has shown improvement in 2016-18 reflecting reducing
expenses of the company in terms of the growth of revenue for the company (Sirucek & Čajka,
2016).
⊘ This is a preview!⊘
Do you want full access?
Subscribe today to unlock all pages.
Trusted by 1+ million students worldwide
6SEEK LIMITED
(Source: Appendix 1)
Corporate Strategy
Management Structure
The management structure of a company shows the hierarchy position of the company
and the division of the various jobs and duties of the companies in respect to the responsibility
each of the key members of the company plays. Seek Ltd has its management structure in a well-
structured way, which help them divide the various roles and duty of the key management
executive of the company s that the operations of the company is done effectively. The Chief
Executive Officer (C.E.O) of Seek Ltd is Mr Andrew Bassat who is also the key founder of the
company. The Chief Financial Officer (C.F.O) of the company is Geoff Roberts and the Chief
Operating Officer (C.O.O) of the company is Mr Isar Mazer.
Shareholder’s Value Generation Strategies
The management of the company has applied various strategy for the operations of the
business and various management actions in each of the business services and products the
company caters to the customers (Wang, 2018). The company also follows aggressive strategy
by providing aggressive reinvestment strategy programmes for expanding the business services
of the company and creating a substantial market share in the economy. The key strategies
2014-06 2015-06 2016-06 2017-06 2018-06
0
200000
400000
600000
800000
1000000
1200000
1400000
Gross profit
2014-06 2015-06 2016-06 2017-06 2018-06
0
50000
100000
150000
200000
250000
300000
350000
400000
Net income
Paraphrase This Document
Need a fresh take? Get an instant paraphrase of this document with our AI Paraphraser
7SEEK LIMITED
followed by the management of the company are done for creating long-term growth and value
for the company. The company aims in maintaining and growing market leadership in the form
of the higher number of placement done, which is a key metric for the company in terms of the
performance of the company (Liu, Liang & Yang, 2016). The company applies the usage and
application of technology and other software services, which will help them, get relevant data
about the business and there operation would also be sustainable for the company. The data
shared by the candidates seeking job opportunities helps the company in examining and finding a
better solution for the consumer in the form of better career insights and strengthening Seeks
network with other companies (Grant, 2016). The company has various kinds of employment
services for the customers of the company in the form of various services and products provided
on a premium basis allowing the company for better solution and creating networking with other
companies (Bridge & Dodds, 2018).
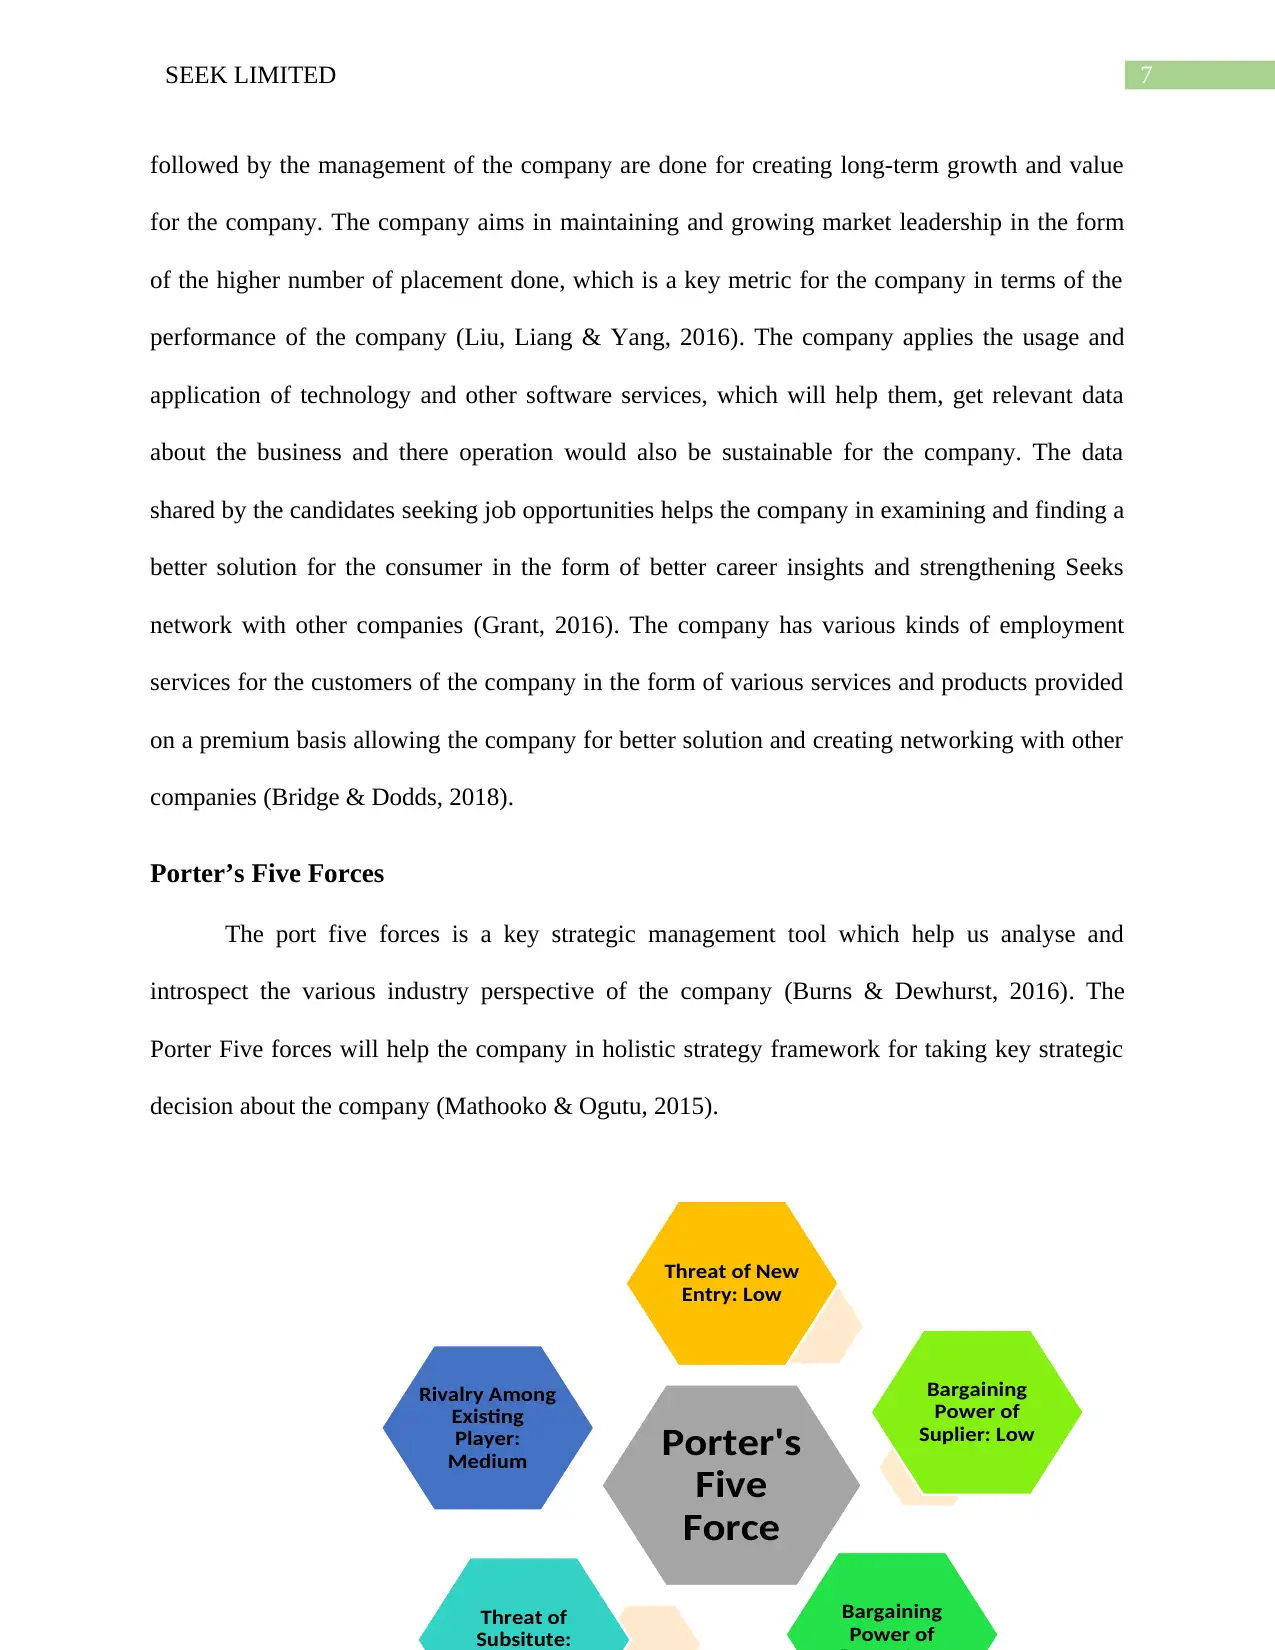
Porter’s Five Forces
The port five forces is a key strategic management tool which help us analyse and
introspect the various industry perspective of the company (Burns & Dewhurst, 2016). The
Porter Five forces will help the company in holistic strategy framework for taking key strategic
decision about the company (Mathooko & Ogutu, 2015).
Porter's
Five
Force
Threat of New
Entry: Low
Bargaining
Power of
Suplier: Low
Bargaining
Power of
Threat of
Subsitute:
Rivalry Among
Existing
Player:
Medium
followed by the management of the company are done for creating long-term growth and value
for the company. The company aims in maintaining and growing market leadership in the form
of the higher number of placement done, which is a key metric for the company in terms of the
performance of the company (Liu, Liang & Yang, 2016). The company applies the usage and
application of technology and other software services, which will help them, get relevant data
about the business and there operation would also be sustainable for the company. The data
shared by the candidates seeking job opportunities helps the company in examining and finding a
better solution for the consumer in the form of better career insights and strengthening Seeks
network with other companies (Grant, 2016). The company has various kinds of employment
services for the customers of the company in the form of various services and products provided
on a premium basis allowing the company for better solution and creating networking with other
companies (Bridge & Dodds, 2018).
Porter’s Five Forces
The port five forces is a key strategic management tool which help us analyse and
introspect the various industry perspective of the company (Burns & Dewhurst, 2016). The
Porter Five forces will help the company in holistic strategy framework for taking key strategic
decision about the company (Mathooko & Ogutu, 2015).
Porter's
Five
Force
Threat of New
Entry: Low
Bargaining
Power of
Suplier: Low
Bargaining
Power of
Threat of
Subsitute:
Rivalry Among
Existing
Player:
Medium

8SEEK LIMITED
⊘ This is a preview!⊘
Do you want full access?
Subscribe today to unlock all pages.
Trusted by 1+ million students worldwide
9SEEK LIMITED
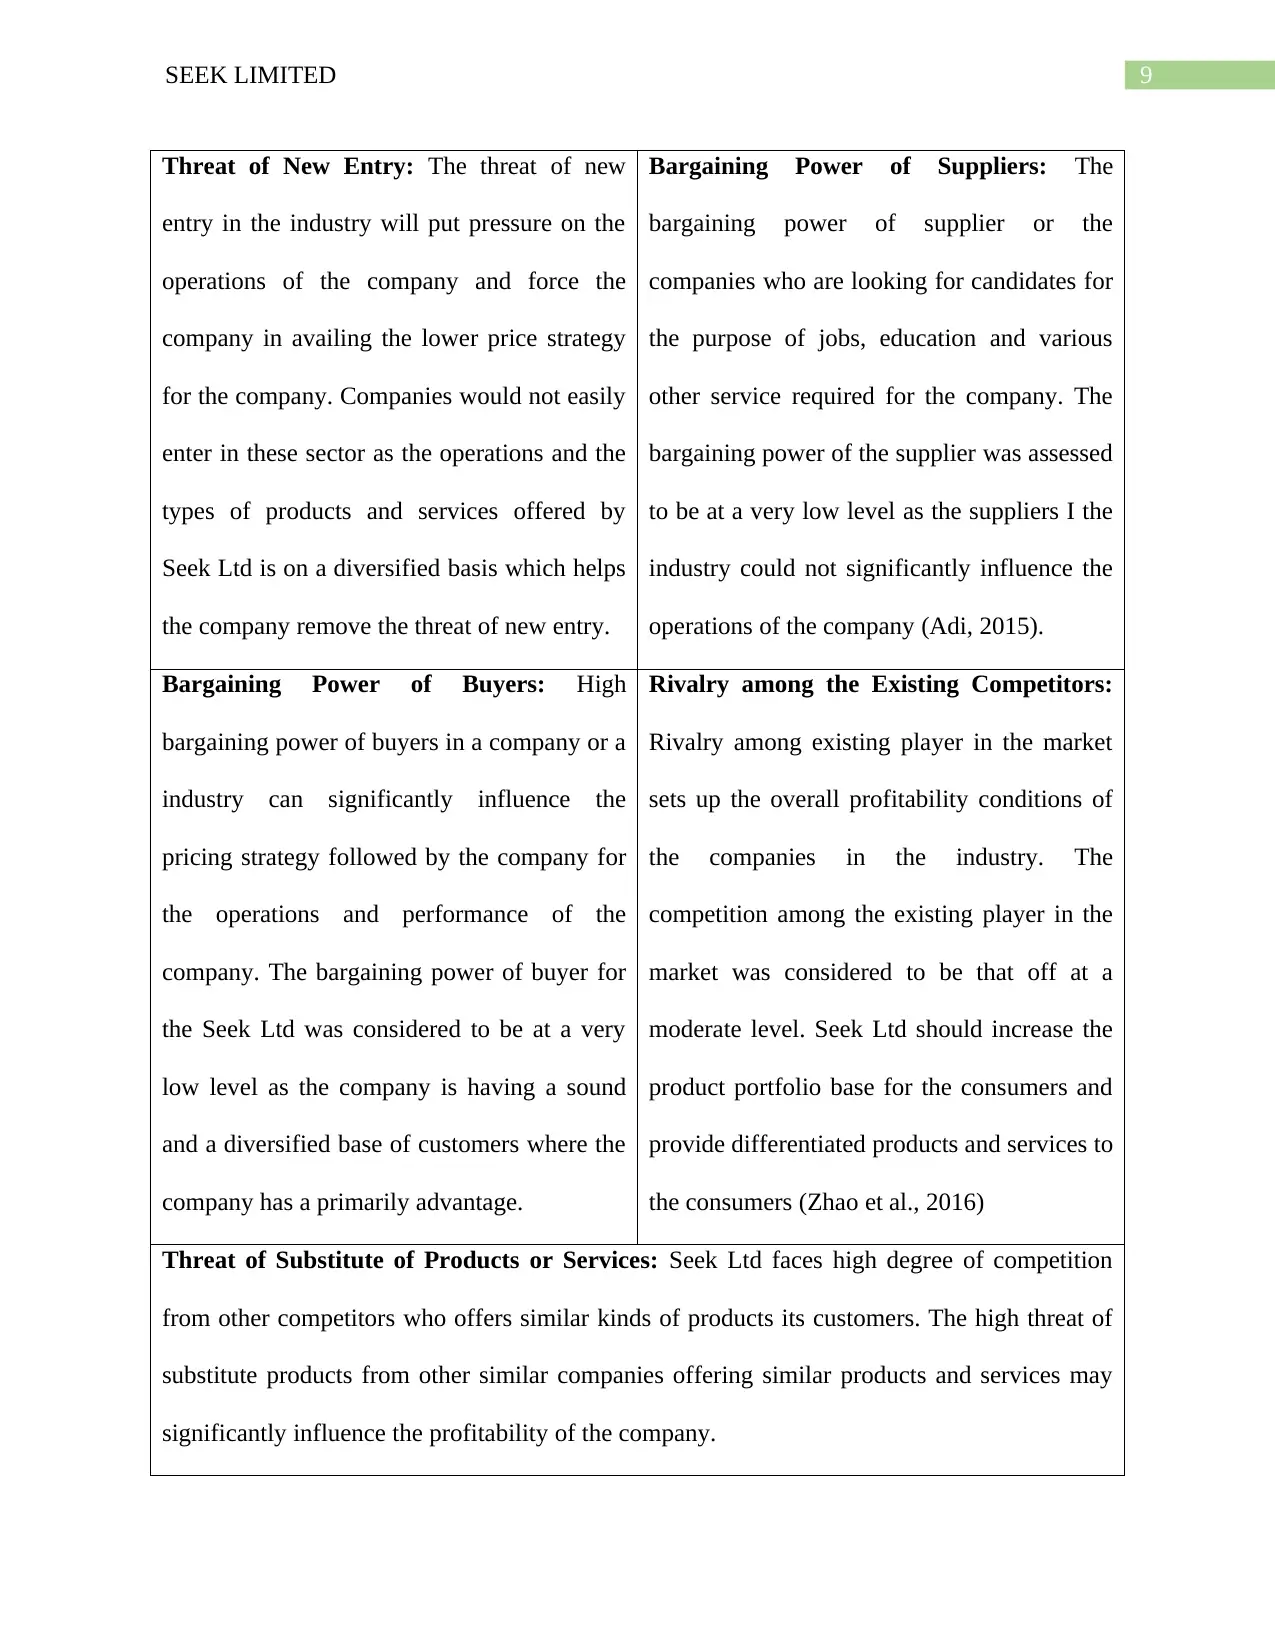
Threat of New Entry: The threat of new
entry in the industry will put pressure on the
operations of the company and force the
company in availing the lower price strategy
for the company. Companies would not easily
enter in these sector as the operations and the
types of products and services offered by
Seek Ltd is on a diversified basis which helps
the company remove the threat of new entry.
Bargaining Power of Suppliers: The
bargaining power of supplier or the
companies who are looking for candidates for
the purpose of jobs, education and various
other service required for the company. The
bargaining power of the supplier was assessed
to be at a very low level as the suppliers I the
industry could not significantly influence the
operations of the company (Adi, 2015).
Bargaining Power of Buyers: High
bargaining power of buyers in a company or a
industry can significantly influence the
pricing strategy followed by the company for
the operations and performance of the
company. The bargaining power of buyer for
the Seek Ltd was considered to be at a very
low level as the company is having a sound
and a diversified base of customers where the
company has a primarily advantage.
Rivalry among the Existing Competitors:
Rivalry among existing player in the market
sets up the overall profitability conditions of
the companies in the industry. The
competition among the existing player in the
market was considered to be that off at a
moderate level. Seek Ltd should increase the
product portfolio base for the consumers and
provide differentiated products and services to
the consumers (Zhao et al., 2016)
Threat of Substitute of Products or Services: Seek Ltd faces high degree of competition
from other competitors who offers similar kinds of products its customers. The high threat of
substitute products from other similar companies offering similar products and services may
significantly influence the profitability of the company.
Paraphrase This Document
Need a fresh take? Get an instant paraphrase of this document with our AI Paraphraser
10SEEK LIMITED
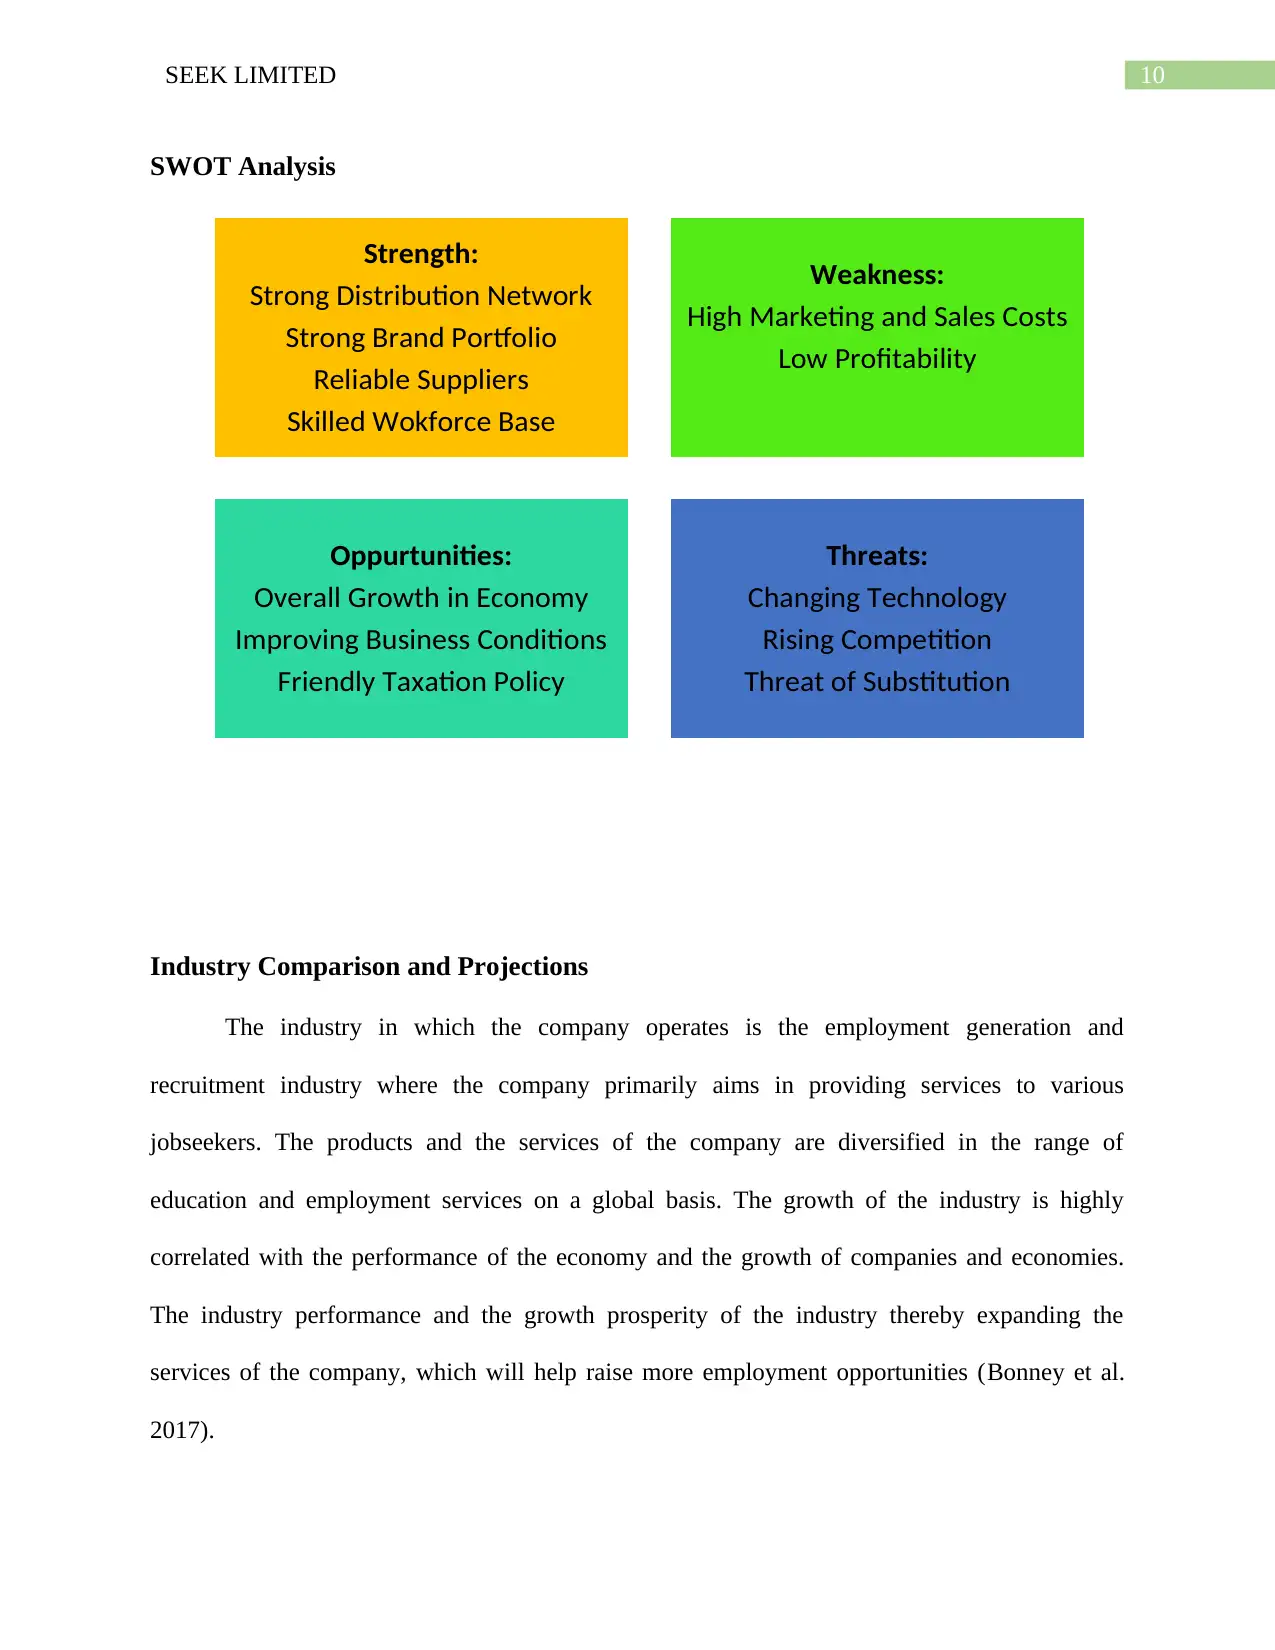
SWOT Analysis
Industry Comparison and Projections
The industry in which the company operates is the employment generation and
recruitment industry where the company primarily aims in providing services to various
jobseekers. The products and the services of the company are diversified in the range of
education and employment services on a global basis. The growth of the industry is highly
correlated with the performance of the economy and the growth of companies and economies.
The industry performance and the growth prosperity of the industry thereby expanding the
services of the company, which will help raise more employment opportunities (Bonney et al.
2017).
Strength:
Strong Distribution Network
Strong Brand Portfolio
Reliable Suppliers
Skilled Wokforce Base
Weakness:
High Marketing and Sales Costs
Low Profitability
Oppurtunities:
Overall Growth in Economy
Improving Business Conditions
Friendly Taxation Policy
Threats:
Changing Technology
Rising Competition
Threat of Substitution
11SEEK LIMITED
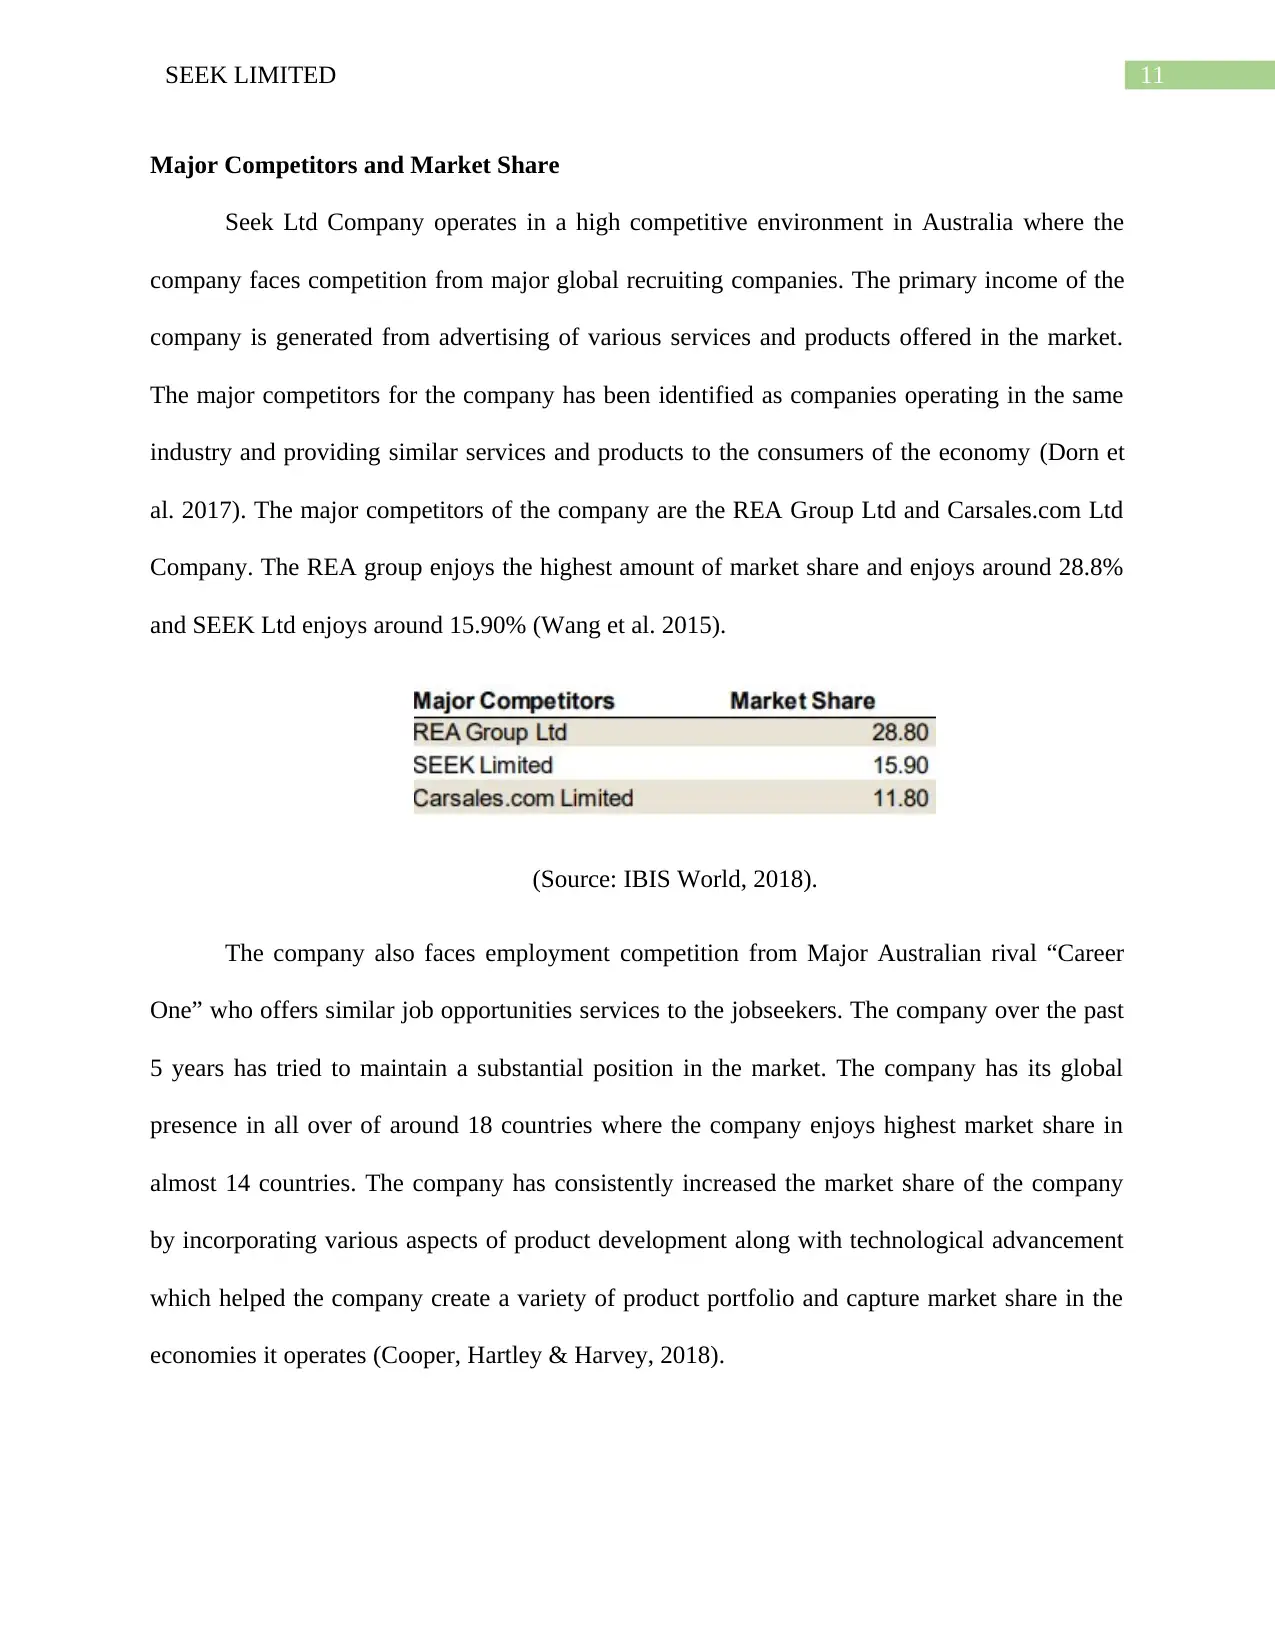
Major Competitors and Market Share
Seek Ltd Company operates in a high competitive environment in Australia where the
company faces competition from major global recruiting companies. The primary income of the
company is generated from advertising of various services and products offered in the market.
The major competitors for the company has been identified as companies operating in the same
industry and providing similar services and products to the consumers of the economy (Dorn et
al. 2017). The major competitors of the company are the REA Group Ltd and Carsales.com Ltd
Company. The REA group enjoys the highest amount of market share and enjoys around 28.8%
and SEEK Ltd enjoys around 15.90% (Wang et al. 2015).
(Source: IBIS World, 2018).
The company also faces employment competition from Major Australian rival “Career
One” who offers similar job opportunities services to the jobseekers. The company over the past
5 years has tried to maintain a substantial position in the market. The company has its global
presence in all over of around 18 countries where the company enjoys highest market share in
almost 14 countries. The company has consistently increased the market share of the company
by incorporating various aspects of product development along with technological advancement
which helped the company create a variety of product portfolio and capture market share in the
economies it operates (Cooper, Hartley & Harvey, 2018).
⊘ This is a preview!⊘
Do you want full access?
Subscribe today to unlock all pages.
Trusted by 1+ million students worldwide
1 out of 38
Related Documents


Your All-in-One AI-Powered Toolkit for Academic Success.
+13062052269
info@desklib.com
Available 24*7 on WhatsApp / Email
![[object Object]](/_next/static/media/star-bottom.7253800d.svg)
Unlock your academic potential
Copyright © 2020–2026 A2Z Services. All Rights Reserved. Developed and managed by ZUCOL.