MBA403: Investment Analysis & Recommendation for SEEK Limited

Verified

Added on  2023/06/11

|3
|1107
|80
Report
AI Summary
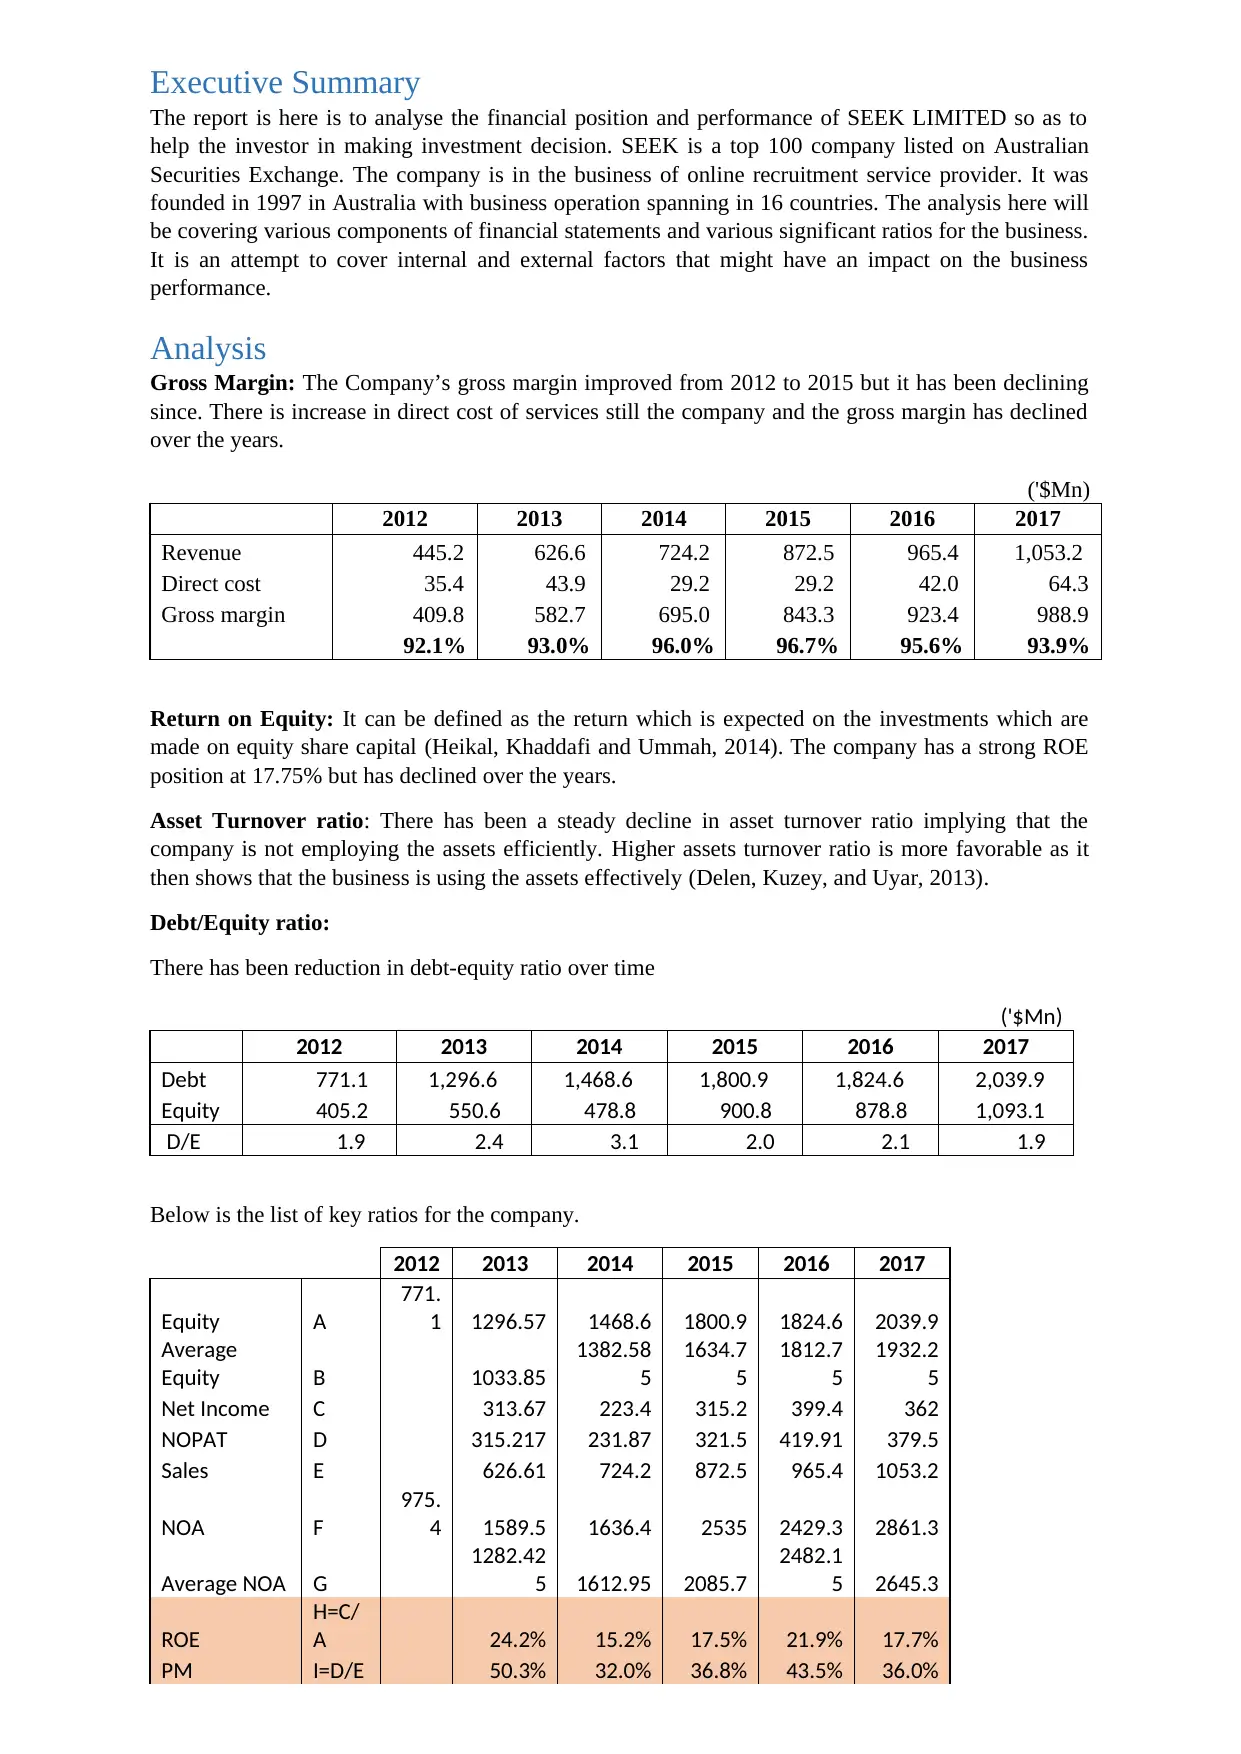
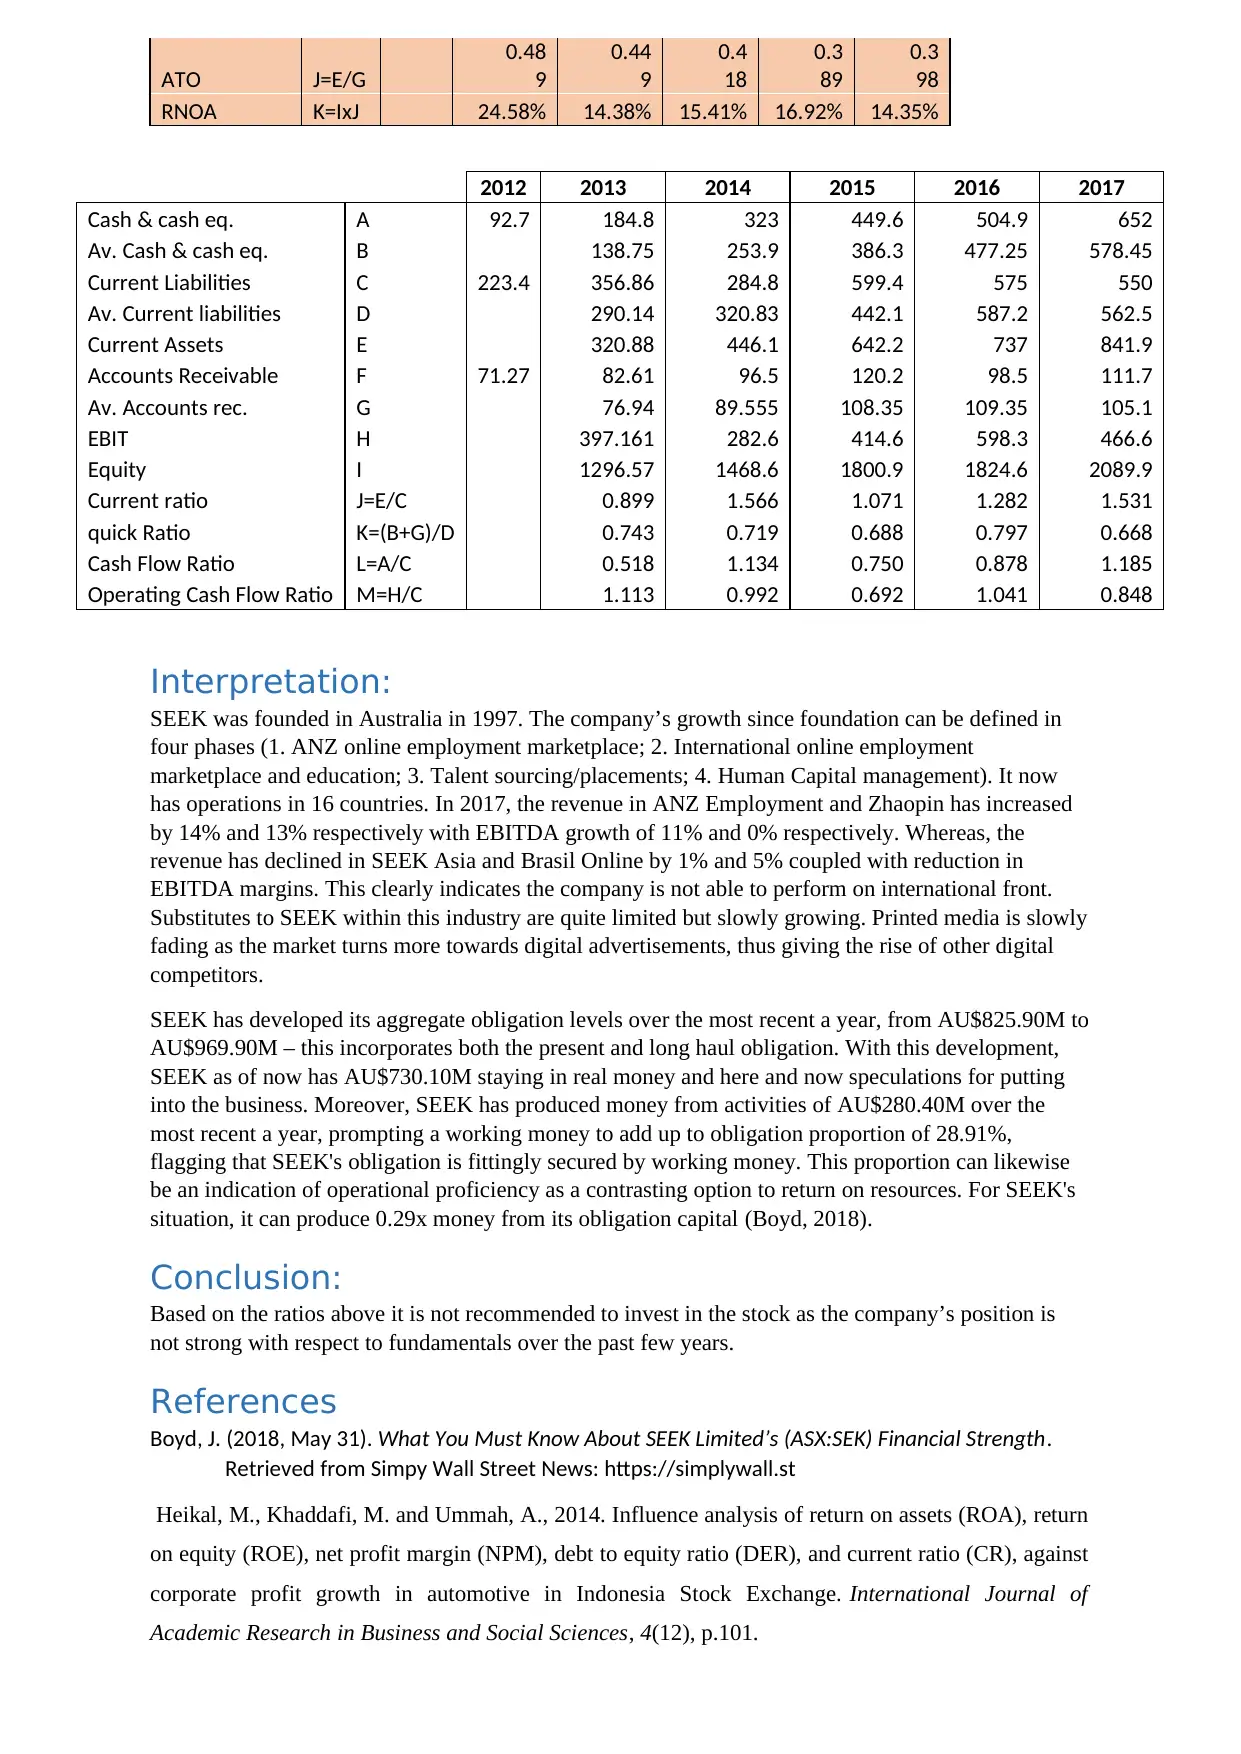
This report analyzes SEEK Limited's financial position and performance to inform investment decisions. It examines gross margin, return on equity, asset turnover ratio, and debt/equity ratio, highlighting trends and interpretations from 2012 to 2017. While SEEK has shown growth in ANZ Employment and Zhaopin, international performance has declined. The report also considers SEEK's debt obligations and cash flow, concluding with a recommendation against investing based on recent financial fundamentals. The analysis incorporates key financial ratios and external factors impacting SEEK's business, providing a comprehensive overview for prospective shareholders. The document is contributed by a student and is available on Desklib, a platform offering study tools and resources for students.
Document Page
Executive Summary
The report is here is to analyse the financial position and performance of SEEK LIMITED so as to
help the investor in making investment decision. SEEK is a top 100 company listed on Australian
Securities Exchange. The company is in the business of online recruitment service provider. It was
founded in 1997 in Australia with business operation spanning in 16 countries. The analysis here will
be covering various components of financial statements and various significant ratios for the business.
It is an attempt to cover internal and external factors that might have an impact on the business
performance.
Analysis
Gross Margin: The Company’s gross margin improved from 2012 to 2015 but it has been declining
since. There is increase in direct cost of services still the company and the gross margin has declined
over the years.
('$Mn)
2012 2013 2014 2015 2016 2017
Revenue 445.2 626.6 724.2 872.5 965.4 1,053.2
Direct cost 35.4 43.9 29.2 29.2 42.0 64.3
Gross margin 409.8 582.7 695.0 843.3 923.4 988.9
92.1% 93.0% 96.0% 96.7% 95.6% 93.9%
Return on Equity: It can be defined as the return which is expected on the investments which are
made on equity share capital (Heikal, Khaddafi and Ummah, 2014). The company has a strong ROE
position at 17.75% but has declined over the years.
Asset Turnover ratio: There has been a steady decline in asset turnover ratio implying that the
company is not employing the assets efficiently. Higher assets turnover ratio is more favorable as it
then shows that the business is using the assets effectively (Delen, Kuzey, and Uyar, 2013).
Debt/Equity ratio:
There has been reduction in debt-equity ratio over time
('$Mn)
2012 2013 2014 2015 2016 2017
Debt 771.1 1,296.6 1,468.6 1,800.9 1,824.6 2,039.9
Equity 405.2 550.6 478.8 900.8 878.8 1,093.1
D/E 1.9 2.4 3.1 2.0 2.1 1.9
Below is the list of key ratios for the company.
2012 2013 2014 2015 2016 2017
Equity A
771.
1 1296.57 1468.6 1800.9 1824.6 2039.9
Average
Equity B 1033.85
1382.58
5
1634.7
5
1812.7
5
1932.2
5
Net Income C 313.67 223.4 315.2 399.4 362
NOPAT D 315.217 231.87 321.5 419.91 379.5
Sales E 626.61 724.2 872.5 965.4 1053.2
NOA F
975.
4 1589.5 1636.4 2535 2429.3 2861.3
Average NOA G
1282.42
5 1612.95 2085.7
2482.1
5 2645.3
ROE
H=C/
A 24.2% 15.2% 17.5% 21.9% 17.7%
PM I=D/E 50.3% 32.0% 36.8% 43.5% 36.0%
tabler-icon-diamond-filled.svg

Secure Best Marks with AI Grader

Need help grading? Try our AI Grader for instant feedback on your assignments.
Document Page
ATO J=E/G
0.48
9
0.44
9
0.4
18
0.3
89
0.3
98
RNOA K=IxJ 24.58% 14.38% 15.41% 16.92% 14.35%
2012 2013 2014 2015 2016 2017
Cash & cash eq. A 92.7 184.8 323 449.6 504.9 652
Av. Cash & cash eq. B 138.75 253.9 386.3 477.25 578.45
Current Liabilities C 223.4 356.86 284.8 599.4 575 550
Av. Current liabilities D 290.14 320.83 442.1 587.2 562.5
Current Assets E 320.88 446.1 642.2 737 841.9
Accounts Receivable F 71.27 82.61 96.5 120.2 98.5 111.7
Av. Accounts rec. G 76.94 89.555 108.35 109.35 105.1
EBIT H 397.161 282.6 414.6 598.3 466.6
Equity I 1296.57 1468.6 1800.9 1824.6 2089.9
Current ratio J=E/C 0.899 1.566 1.071 1.282 1.531
quick Ratio K=(B+G)/D 0.743 0.719 0.688 0.797 0.668
Cash Flow Ratio L=A/C 0.518 1.134 0.750 0.878 1.185
Operating Cash Flow Ratio M=H/C 1.113 0.992 0.692 1.041 0.848
Interpretation:
SEEK was founded in Australia in 1997. The company’s growth since foundation can be defined in
four phases (1. ANZ online employment marketplace; 2. International online employment
marketplace and education; 3. Talent sourcing/placements; 4. Human Capital management). It now
has operations in 16 countries. In 2017, the revenue in ANZ Employment and Zhaopin has increased
by 14% and 13% respectively with EBITDA growth of 11% and 0% respectively. Whereas, the
revenue has declined in SEEK Asia and Brasil Online by 1% and 5% coupled with reduction in
EBITDA margins. This clearly indicates the company is not able to perform on international front.
Substitutes to SEEK within this industry are quite limited but slowly growing. Printed media is slowly
fading as the market turns more towards digital advertisements, thus giving the rise of other digital
competitors.
SEEK has developed its aggregate obligation levels over the most recent a year, from AU$825.90M to
AU$969.90M – this incorporates both the present and long haul obligation. With this development,
SEEK as of now has AU$730.10M staying in real money and here and now speculations for putting
into the business. Moreover, SEEK has produced money from activities of AU$280.40M over the
most recent a year, prompting a working money to add up to obligation proportion of 28.91%,
flagging that SEEK's obligation is fittingly secured by working money. This proportion can likewise
be an indication of operational proficiency as a contrasting option to return on resources. For SEEK's
situation, it can produce 0.29x money from its obligation capital (Boyd, 2018).
Conclusion:
Based on the ratios above it is not recommended to invest in the stock as the company’s position is
not strong with respect to fundamentals over the past few years.
References
Boyd, J. (2018, May 31). What You Must Know About SEEK Limited’s (ASX:SEK) Financial Strength.
Retrieved from Simpy Wall Street News: https://simplywall.st
Heikal, M., Khaddafi, M. and Ummah, A., 2014. Influence analysis of return on assets (ROA), return
on equity (ROE), net profit margin (NPM), debt to equity ratio (DER), and current ratio (CR), against
corporate profit growth in automotive in Indonesia Stock Exchange. International Journal of
Academic Research in Business and Social Sciences, 4(12), p.101.
Document Page
Delen, D., Kuzey, C. and Uyar, A., 2013. Measuring firm performance using financial ratios: A
decision tree approach. Expert Systems with Applications, 40(10), pp.3970-3983.
chevron_up_icon
1 out of 3
circle_padding
hide_on_mobile
zoom_out_icon
[object Object]