Financial Analysis & Management Report of Serendib Hotels PLC
VerifiedAdded on 2023/05/31
|16
|4025
|496
Report
AI Summary
This report presents a comprehensive financial analysis of Serendib Hotels PLC, a hospitality company in Sri Lanka, covering a five-year period. It critically evaluates key financial ratios, including profitability ratios (ROCE, ROA, net profit margin), efficiency ratios (creditors, inventory, and debtors turnover), liquidity ratios (current, quick, and cash ratios), capital structure ratios (debt-equity, debt ratio, interest coverage), and stock market performance (price earnings ratio, EPS, dividend yield, earning yield). The analysis reveals a decline in profitability and liquidity, but improvements in efficiency and capital structure. The report identifies factors contributing to these trends, such as reduced tourism and internal operational issues. It concludes with recommendations aimed at improving the company's financial performance, emphasizing the need for strategic adjustments in pricing, cost control, and service innovation to enhance profitability and reduce financial risk.
Running Head: Financial Analysis and management
1
Project Report: Financial Analysis and management
1
Project Report: Financial Analysis and management
Paraphrase This Document
Need a fresh take? Get an instant paraphrase of this document with our AI Paraphraser
Financial Analysis and management 2
Contents
Introduction.......................................................................................................................3
Critical analysis of key ratios...........................................................................................3
Profitability ratios.........................................................................................................3
Efficiency ratios............................................................................................................4
Liquidity ratios..............................................................................................................5
Capital structure ratios..................................................................................................6
Stock market performance............................................................................................7
Practical application and deployment...............................................................................8
Why trends....................................................................................................................8
Recommendation..........................................................................................................9
Conclusion......................................................................................................................11
References.......................................................................................................................12
Appendix.........................................................................................................................14
Financial Analysis and management 3
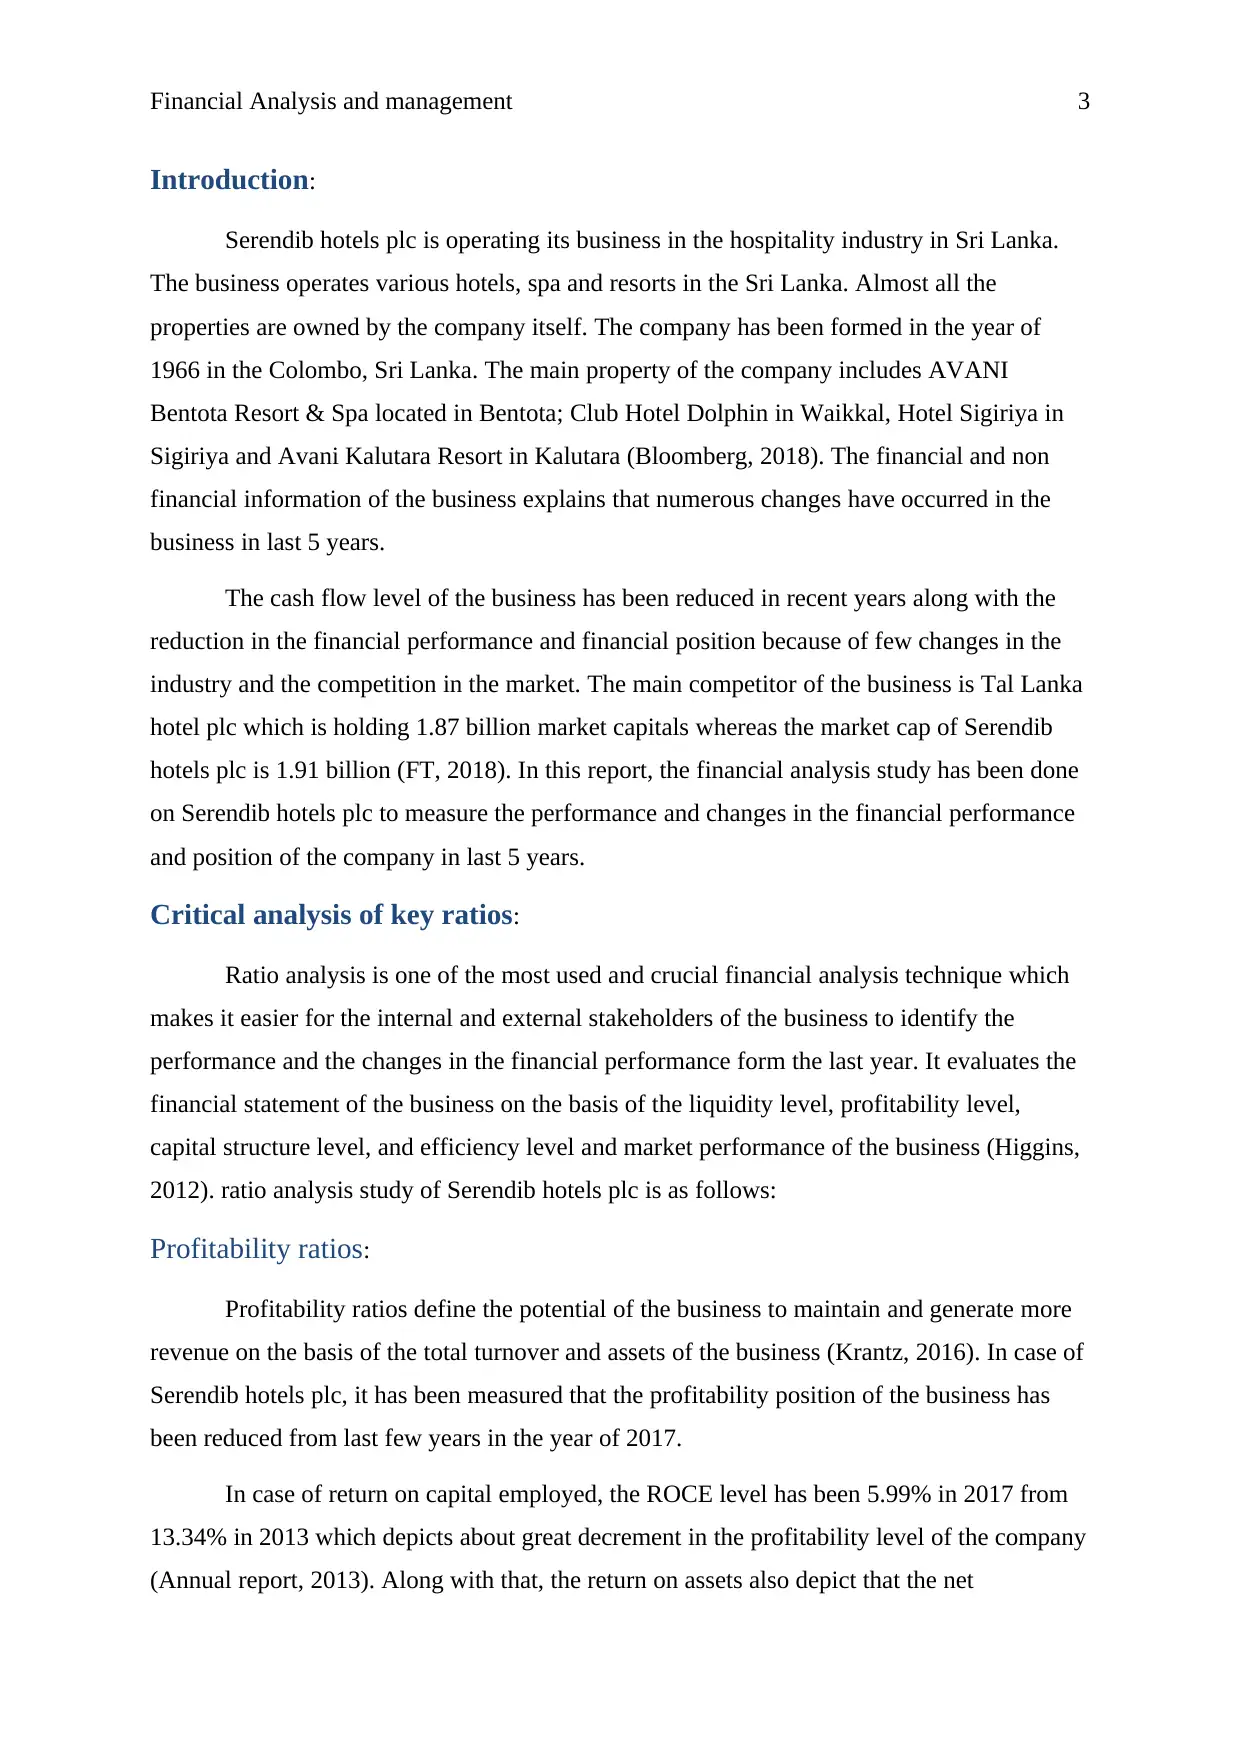
Introduction:
Serendib hotels plc is operating its business in the hospitality industry in Sri Lanka.
The business operates various hotels, spa and resorts in the Sri Lanka. Almost all the
properties are owned by the company itself. The company has been formed in the year of
1966 in the Colombo, Sri Lanka. The main property of the company includes AVANI
Bentota Resort & Spa located in Bentota; Club Hotel Dolphin in Waikkal, Hotel Sigiriya in
Sigiriya and Avani Kalutara Resort in Kalutara (Bloomberg, 2018). The financial and non
financial information of the business explains that numerous changes have occurred in the
business in last 5 years.
The cash flow level of the business has been reduced in recent years along with the
reduction in the financial performance and financial position because of few changes in the
industry and the competition in the market. The main competitor of the business is Tal Lanka
hotel plc which is holding 1.87 billion market capitals whereas the market cap of Serendib
hotels plc is 1.91 billion (FT, 2018). In this report, the financial analysis study has been done
on Serendib hotels plc to measure the performance and changes in the financial performance
and position of the company in last 5 years.
Critical analysis of key ratios:
Ratio analysis is one of the most used and crucial financial analysis technique which
makes it easier for the internal and external stakeholders of the business to identify the
performance and the changes in the financial performance form the last year. It evaluates the
financial statement of the business on the basis of the liquidity level, profitability level,
capital structure level, and efficiency level and market performance of the business (Higgins,
2012). ratio analysis study of Serendib hotels plc is as follows:
Profitability ratios:
Profitability ratios define the potential of the business to maintain and generate more
revenue on the basis of the total turnover and assets of the business (Krantz, 2016). In case of
Serendib hotels plc, it has been measured that the profitability position of the business has
been reduced from last few years in the year of 2017.
In case of return on capital employed, the ROCE level has been 5.99% in 2017 from
13.34% in 2013 which depicts about great decrement in the profitability level of the company
(Annual report, 2013). Along with that, the return on assets also depict that the net
⊘ This is a preview!⊘
Do you want full access?
Subscribe today to unlock all pages.
Trusted by 1+ million students worldwide
Financial Analysis and management 4
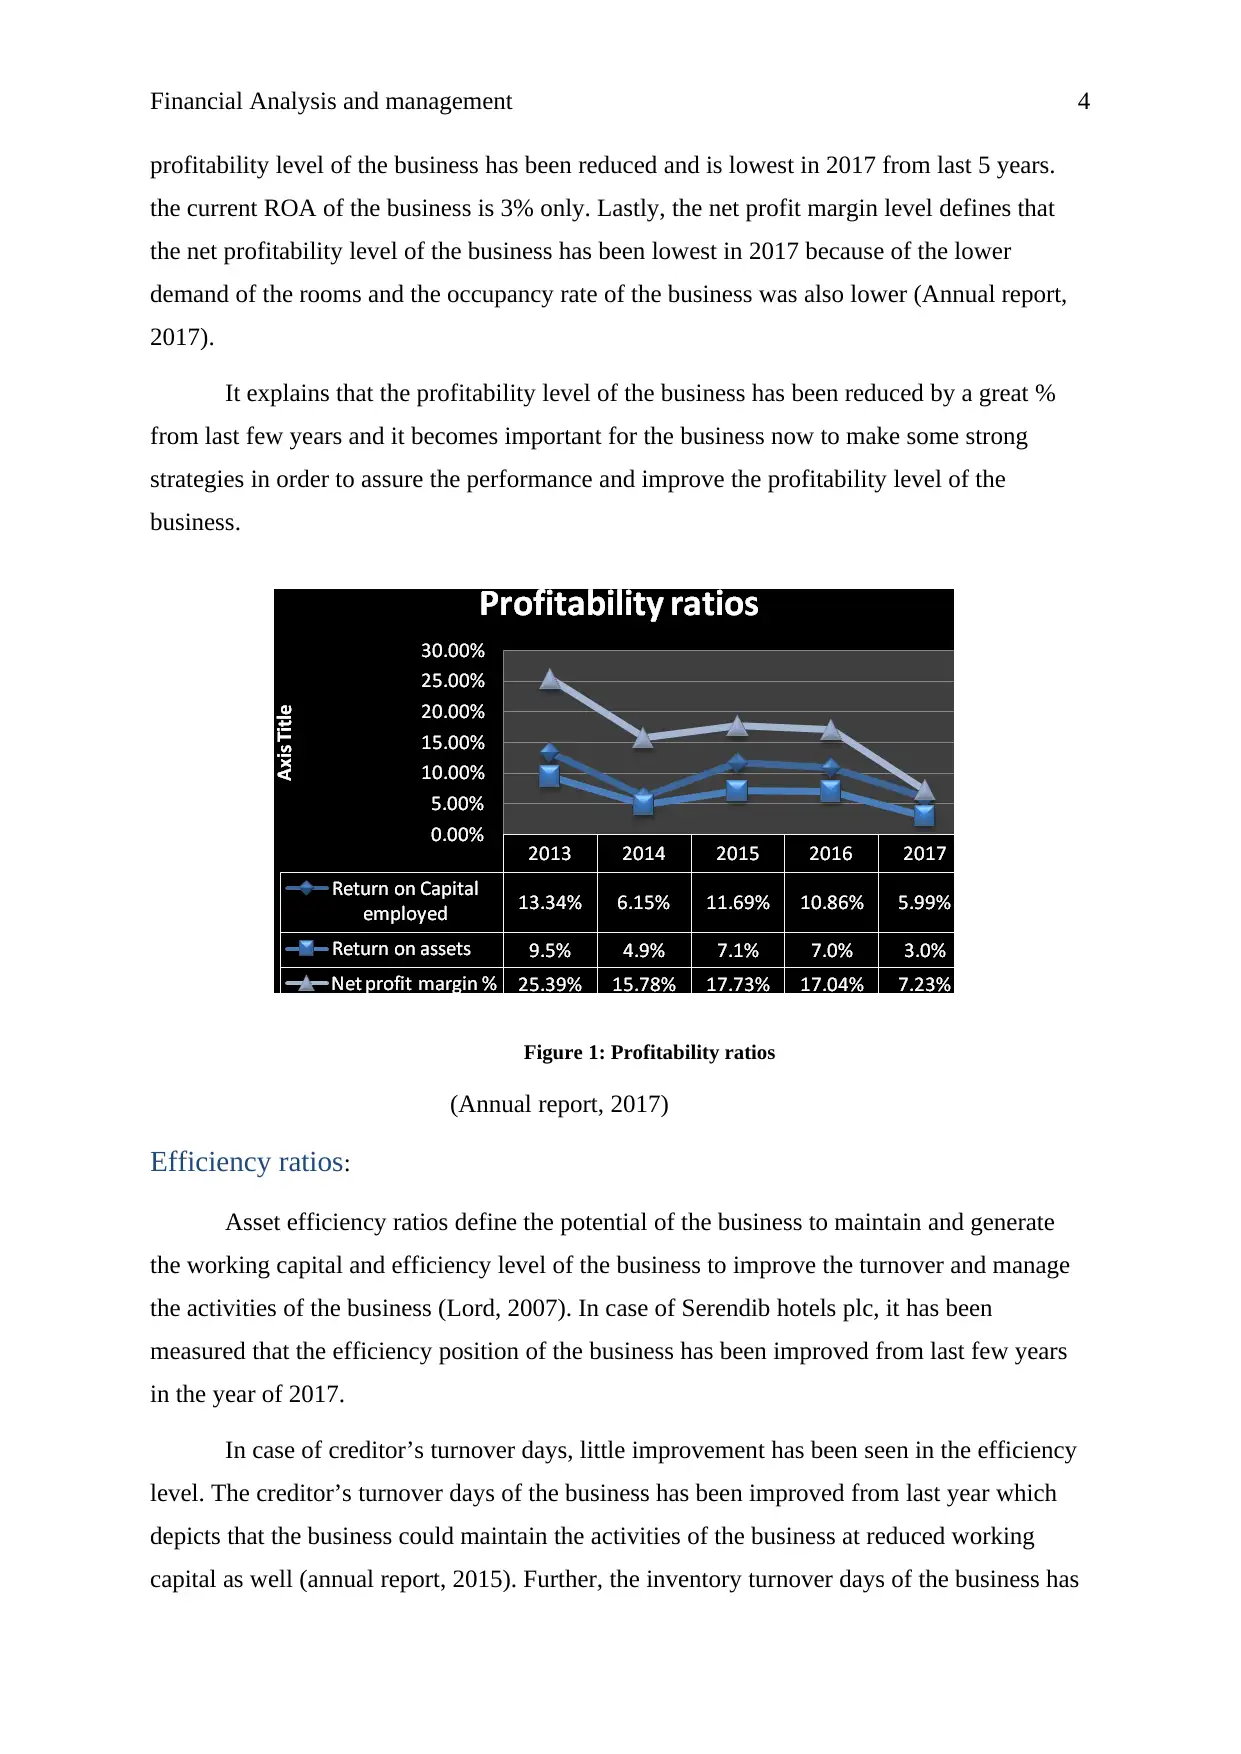
profitability level of the business has been reduced and is lowest in 2017 from last 5 years.
the current ROA of the business is 3% only. Lastly, the net profit margin level defines that
the net profitability level of the business has been lowest in 2017 because of the lower
demand of the rooms and the occupancy rate of the business was also lower (Annual report,
2017).
It explains that the profitability level of the business has been reduced by a great %
from last few years and it becomes important for the business now to make some strong
strategies in order to assure the performance and improve the profitability level of the
business.
Figure 1: Profitability ratios
(Annual report, 2017)
Efficiency ratios:
Asset efficiency ratios define the potential of the business to maintain and generate
the working capital and efficiency level of the business to improve the turnover and manage
the activities of the business (Lord, 2007). In case of Serendib hotels plc, it has been
measured that the efficiency position of the business has been improved from last few years
in the year of 2017.
In case of creditor’s turnover days, little improvement has been seen in the efficiency
level. The creditor’s turnover days of the business has been improved from last year which
depicts that the business could maintain the activities of the business at reduced working
capital as well (annual report, 2015). Further, the inventory turnover days of the business has
Paraphrase This Document
Need a fresh take? Get an instant paraphrase of this document with our AI Paraphraser
Financial Analysis and management 5
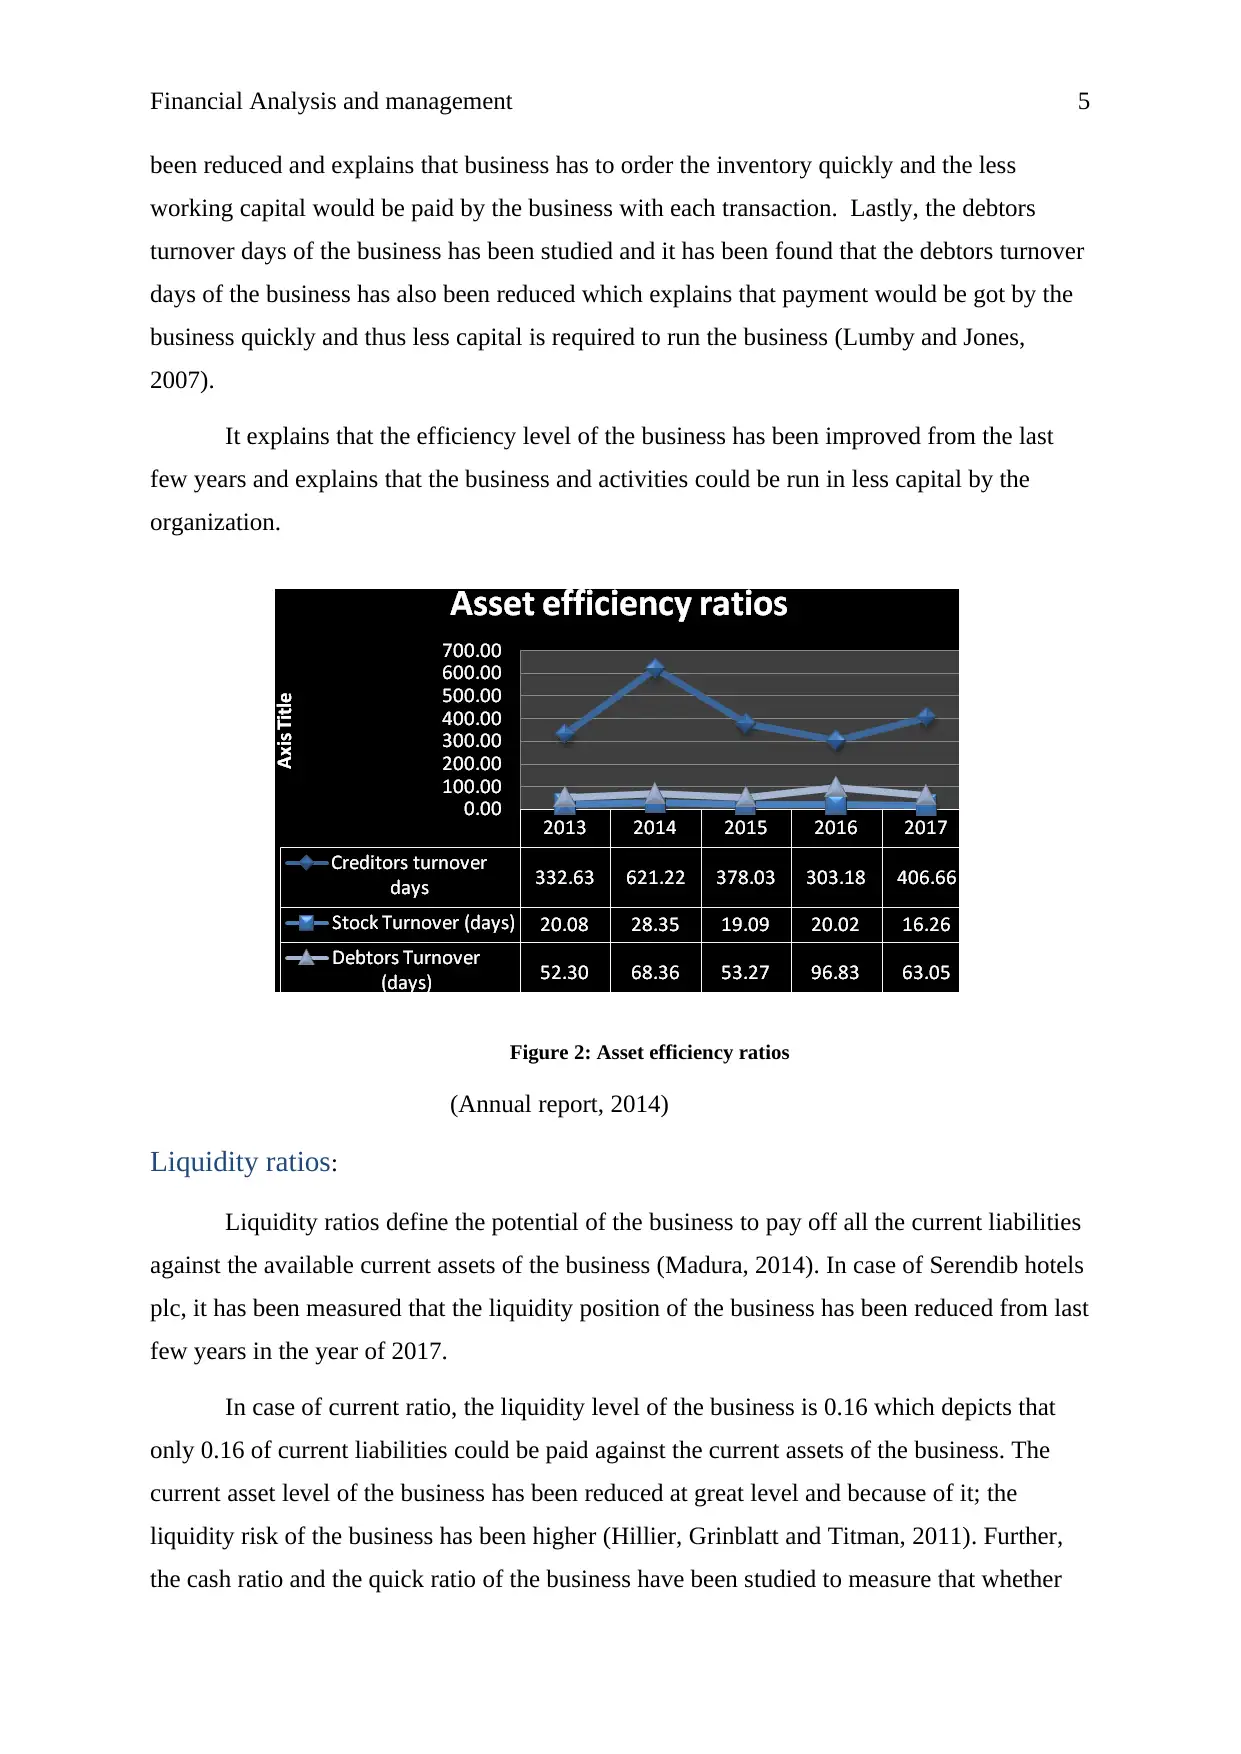
been reduced and explains that business has to order the inventory quickly and the less
working capital would be paid by the business with each transaction. Lastly, the debtors
turnover days of the business has been studied and it has been found that the debtors turnover
days of the business has also been reduced which explains that payment would be got by the
business quickly and thus less capital is required to run the business (Lumby and Jones,
2007).
It explains that the efficiency level of the business has been improved from the last
few years and explains that the business and activities could be run in less capital by the
organization.
Figure 2: Asset efficiency ratios
(Annual report, 2014)
Liquidity ratios:
Liquidity ratios define the potential of the business to pay off all the current liabilities
against the available current assets of the business (Madura, 2014). In case of Serendib hotels
plc, it has been measured that the liquidity position of the business has been reduced from last
few years in the year of 2017.
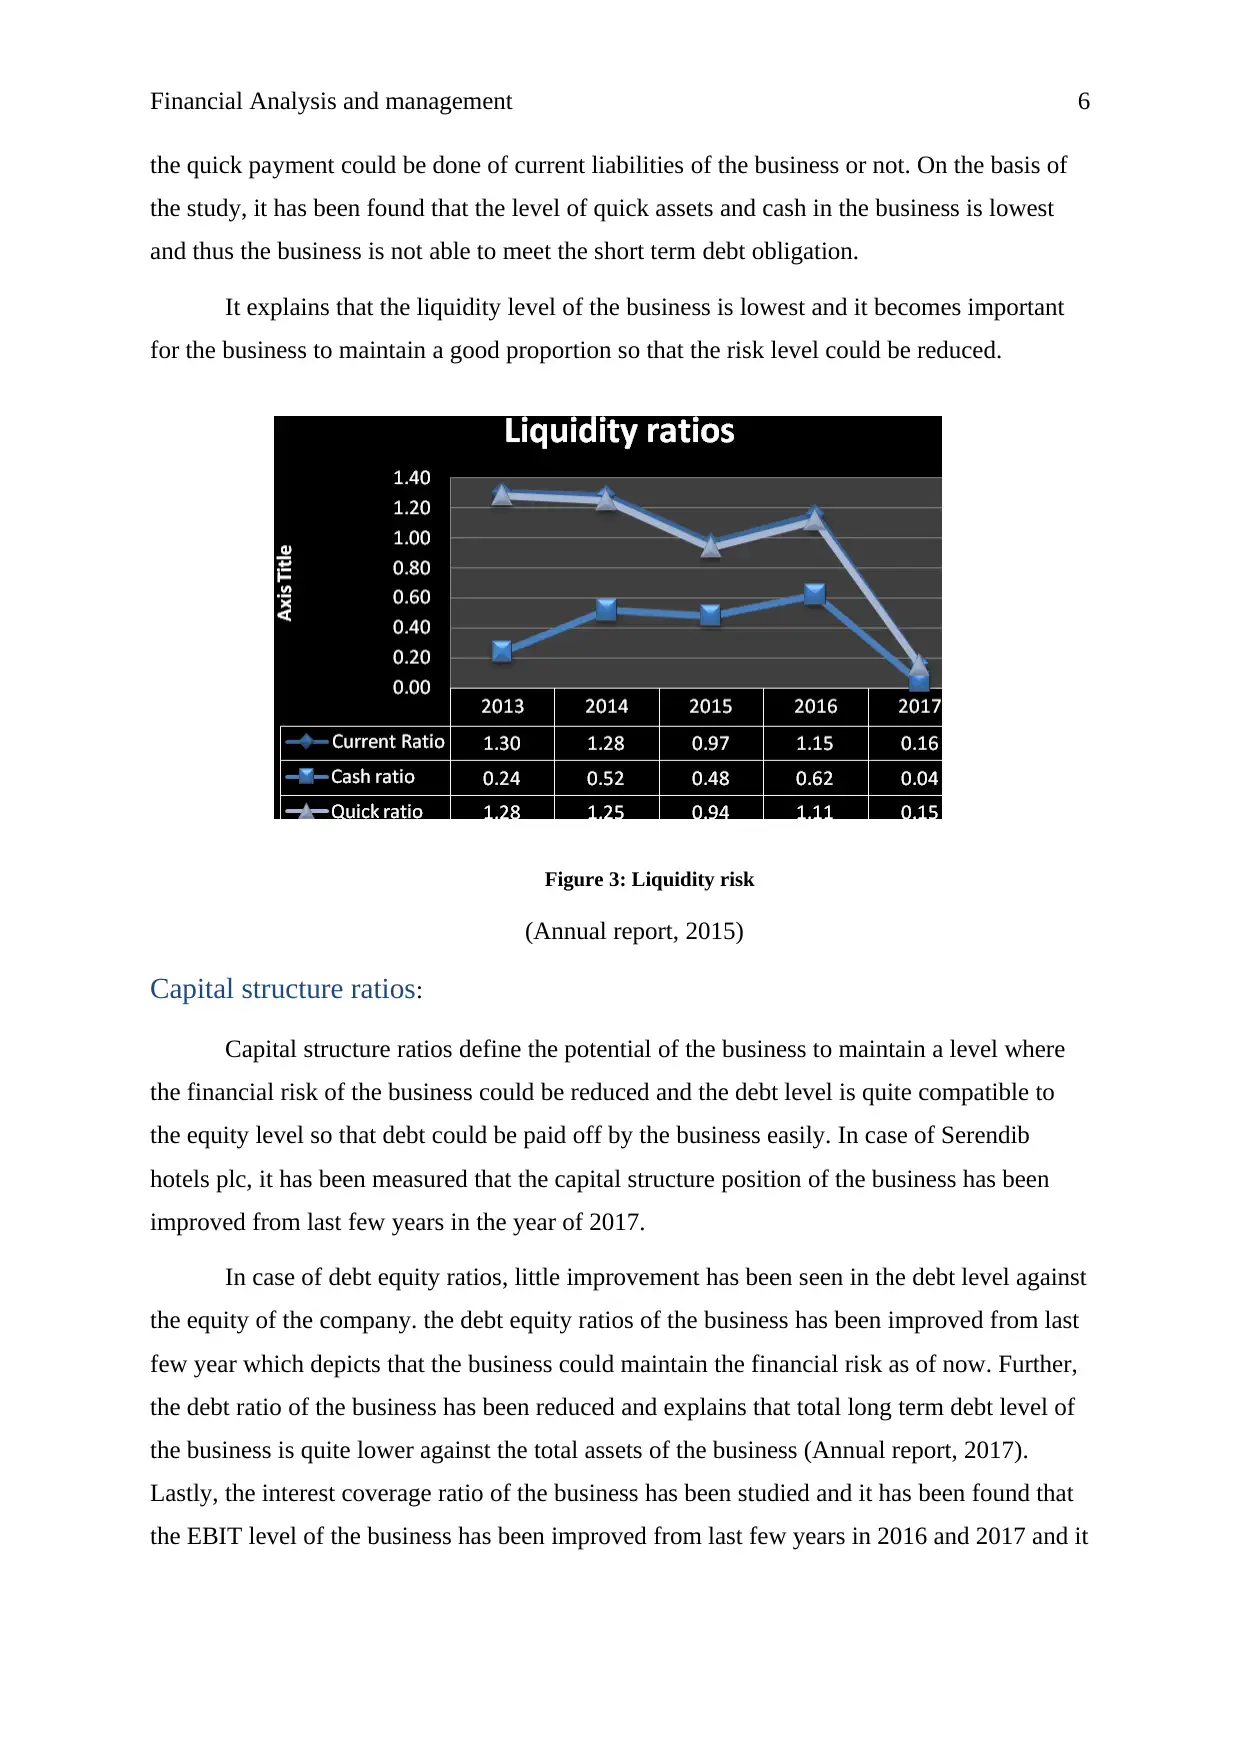
In case of current ratio, the liquidity level of the business is 0.16 which depicts that
only 0.16 of current liabilities could be paid against the current assets of the business. The
current asset level of the business has been reduced at great level and because of it; the
liquidity risk of the business has been higher (Hillier, Grinblatt and Titman, 2011). Further,
the cash ratio and the quick ratio of the business have been studied to measure that whether
been reduced and explains that business has to order the inventory quickly and the less
working capital would be paid by the business with each transaction. Lastly, the debtors
turnover days of the business has been studied and it has been found that the debtors turnover
days of the business has also been reduced which explains that payment would be got by the
business quickly and thus less capital is required to run the business (Lumby and Jones,
2007).
It explains that the efficiency level of the business has been improved from the last
few years and explains that the business and activities could be run in less capital by the
organization.
Figure 2: Asset efficiency ratios
(Annual report, 2014)
Liquidity ratios:
Liquidity ratios define the potential of the business to pay off all the current liabilities
against the available current assets of the business (Madura, 2014). In case of Serendib hotels
plc, it has been measured that the liquidity position of the business has been reduced from last
few years in the year of 2017.
In case of current ratio, the liquidity level of the business is 0.16 which depicts that
only 0.16 of current liabilities could be paid against the current assets of the business. The
current asset level of the business has been reduced at great level and because of it; the
liquidity risk of the business has been higher (Hillier, Grinblatt and Titman, 2011). Further,
the cash ratio and the quick ratio of the business have been studied to measure that whether
Financial Analysis and management 6
the quick payment could be done of current liabilities of the business or not. On the basis of
the study, it has been found that the level of quick assets and cash in the business is lowest
and thus the business is not able to meet the short term debt obligation.
It explains that the liquidity level of the business is lowest and it becomes important
for the business to maintain a good proportion so that the risk level could be reduced.
Figure 3: Liquidity risk
(Annual report, 2015)
Capital structure ratios:
Capital structure ratios define the potential of the business to maintain a level where
the financial risk of the business could be reduced and the debt level is quite compatible to
the equity level so that debt could be paid off by the business easily. In case of Serendib
hotels plc, it has been measured that the capital structure position of the business has been
improved from last few years in the year of 2017.
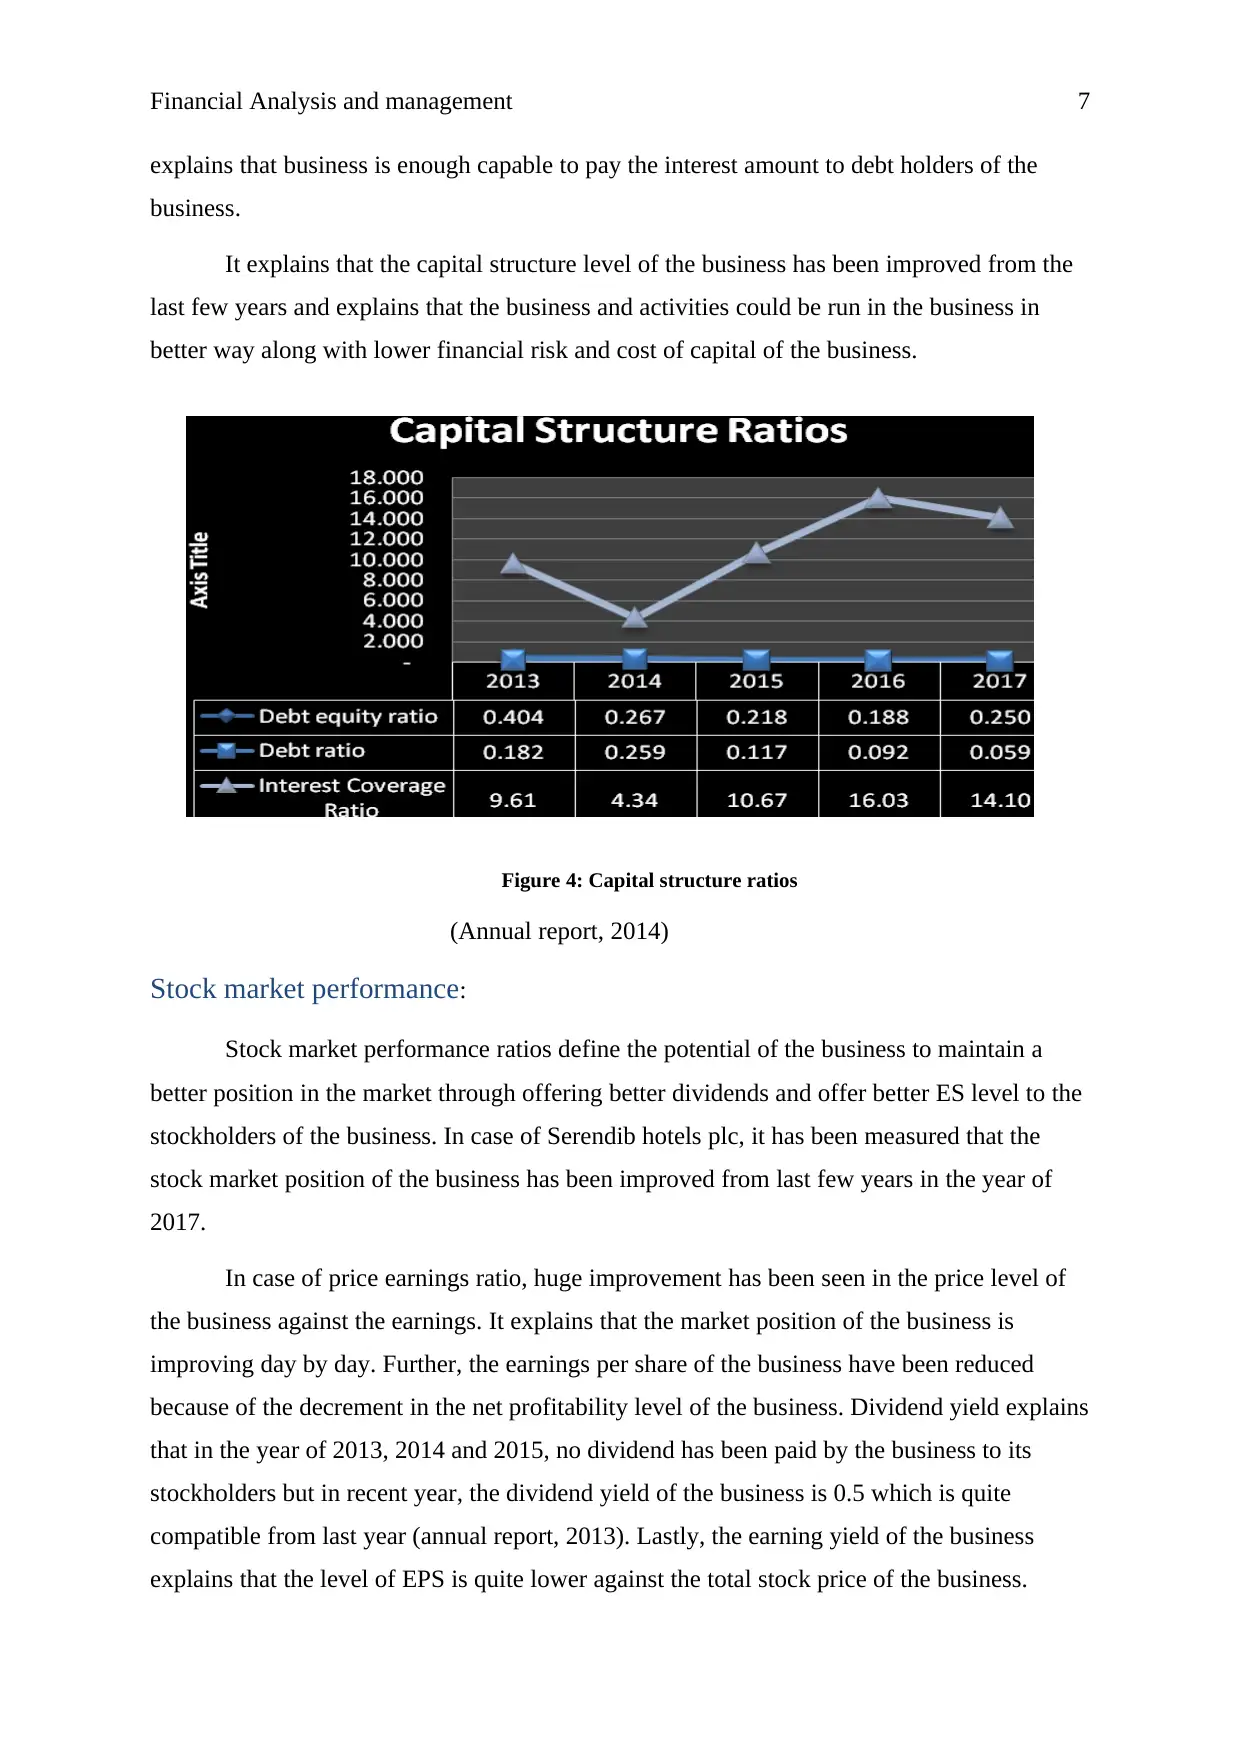
In case of debt equity ratios, little improvement has been seen in the debt level against
the equity of the company. the debt equity ratios of the business has been improved from last
few year which depicts that the business could maintain the financial risk as of now. Further,
the debt ratio of the business has been reduced and explains that total long term debt level of
the business is quite lower against the total assets of the business (Annual report, 2017).
Lastly, the interest coverage ratio of the business has been studied and it has been found that
the EBIT level of the business has been improved from last few years in 2016 and 2017 and it
the quick payment could be done of current liabilities of the business or not. On the basis of
the study, it has been found that the level of quick assets and cash in the business is lowest
and thus the business is not able to meet the short term debt obligation.
It explains that the liquidity level of the business is lowest and it becomes important
for the business to maintain a good proportion so that the risk level could be reduced.
Figure 3: Liquidity risk
(Annual report, 2015)
Capital structure ratios:
Capital structure ratios define the potential of the business to maintain a level where
the financial risk of the business could be reduced and the debt level is quite compatible to
the equity level so that debt could be paid off by the business easily. In case of Serendib
hotels plc, it has been measured that the capital structure position of the business has been
improved from last few years in the year of 2017.
In case of debt equity ratios, little improvement has been seen in the debt level against
the equity of the company. the debt equity ratios of the business has been improved from last
few year which depicts that the business could maintain the financial risk as of now. Further,
the debt ratio of the business has been reduced and explains that total long term debt level of
the business is quite lower against the total assets of the business (Annual report, 2017).
Lastly, the interest coverage ratio of the business has been studied and it has been found that
the EBIT level of the business has been improved from last few years in 2016 and 2017 and it
⊘ This is a preview!⊘
Do you want full access?
Subscribe today to unlock all pages.
Trusted by 1+ million students worldwide
Financial Analysis and management 7
explains that business is enough capable to pay the interest amount to debt holders of the
business.
It explains that the capital structure level of the business has been improved from the
last few years and explains that the business and activities could be run in the business in
better way along with lower financial risk and cost of capital of the business.
Figure 4: Capital structure ratios
(Annual report, 2014)
Stock market performance:
Stock market performance ratios define the potential of the business to maintain a
better position in the market through offering better dividends and offer better ES level to the
stockholders of the business. In case of Serendib hotels plc, it has been measured that the
stock market position of the business has been improved from last few years in the year of
2017.
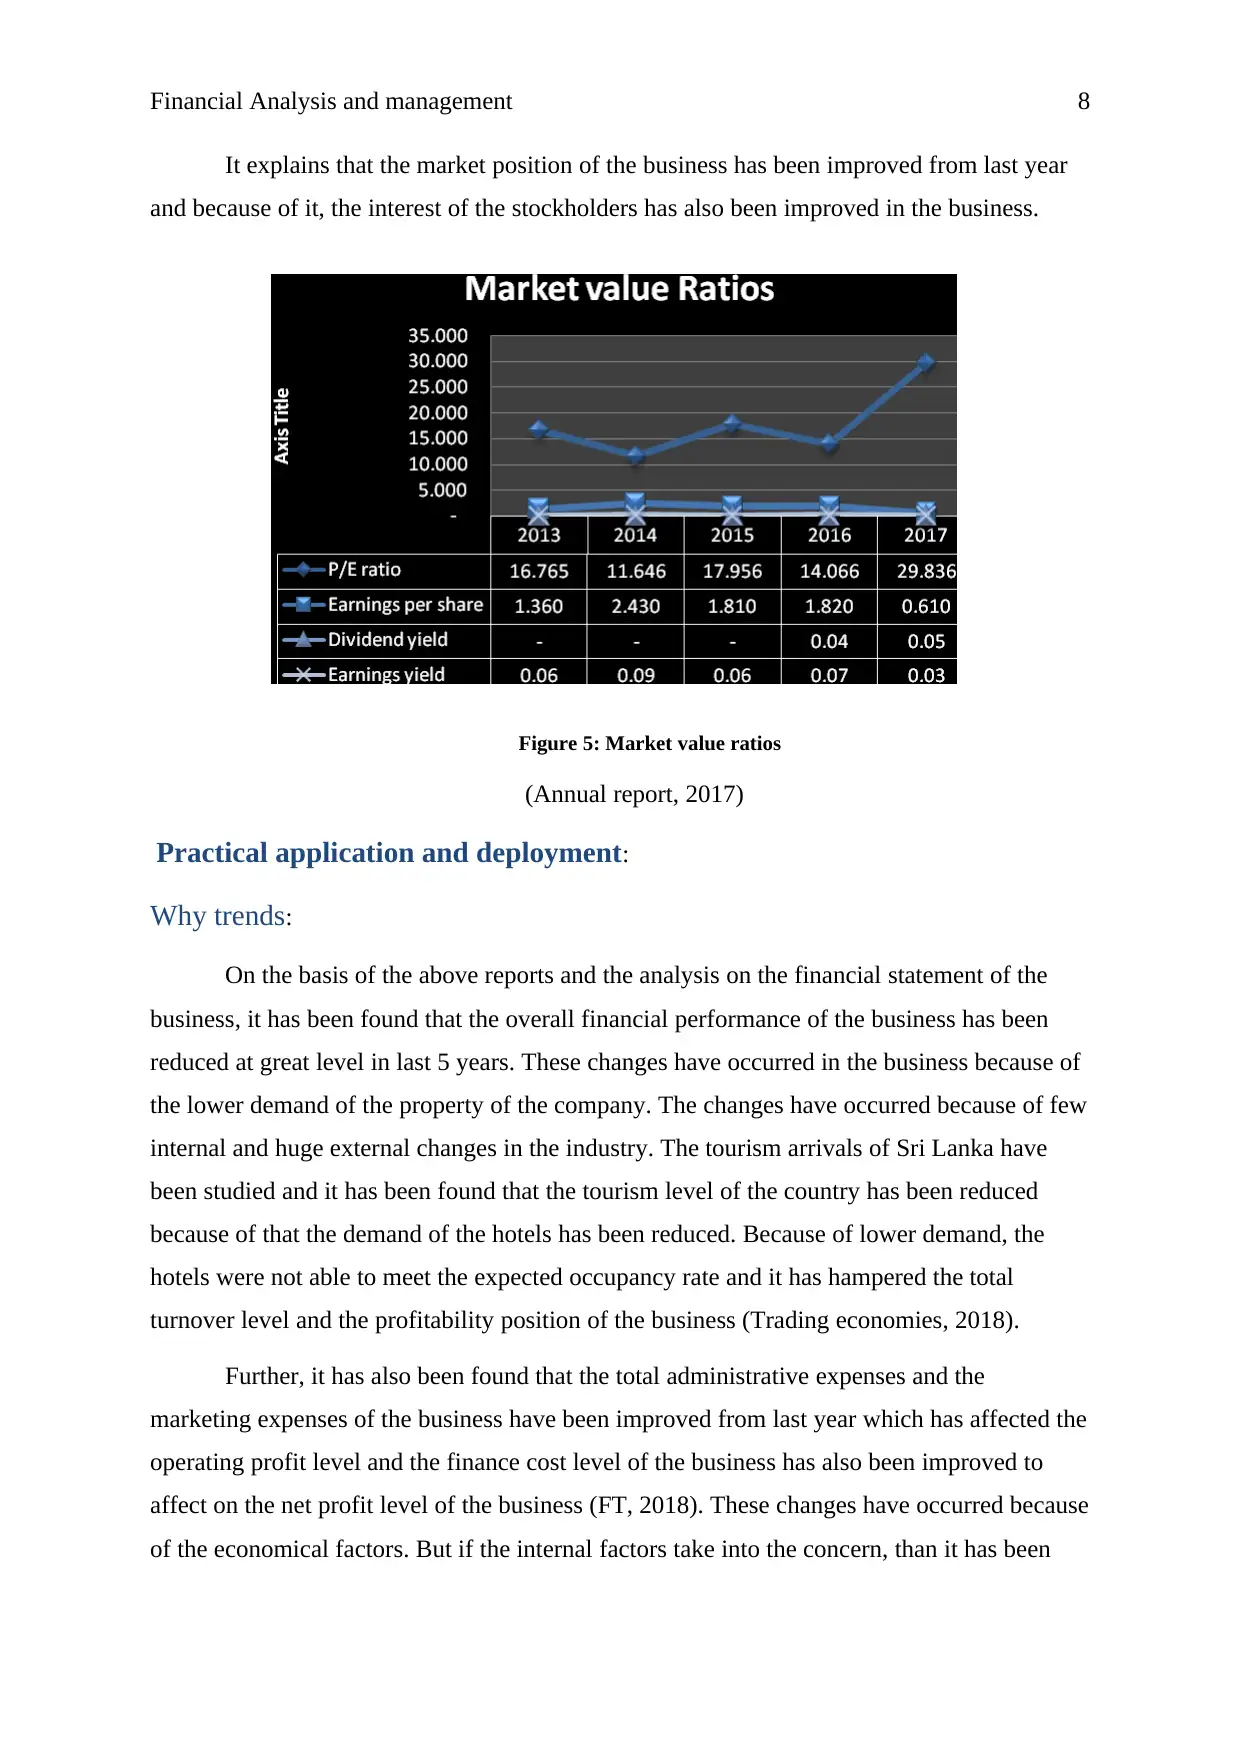
In case of price earnings ratio, huge improvement has been seen in the price level of
the business against the earnings. It explains that the market position of the business is
improving day by day. Further, the earnings per share of the business have been reduced
because of the decrement in the net profitability level of the business. Dividend yield explains
that in the year of 2013, 2014 and 2015, no dividend has been paid by the business to its
stockholders but in recent year, the dividend yield of the business is 0.5 which is quite
compatible from last year (annual report, 2013). Lastly, the earning yield of the business
explains that the level of EPS is quite lower against the total stock price of the business.
explains that business is enough capable to pay the interest amount to debt holders of the
business.
It explains that the capital structure level of the business has been improved from the
last few years and explains that the business and activities could be run in the business in
better way along with lower financial risk and cost of capital of the business.
Figure 4: Capital structure ratios
(Annual report, 2014)
Stock market performance:
Stock market performance ratios define the potential of the business to maintain a
better position in the market through offering better dividends and offer better ES level to the
stockholders of the business. In case of Serendib hotels plc, it has been measured that the
stock market position of the business has been improved from last few years in the year of
2017.
In case of price earnings ratio, huge improvement has been seen in the price level of
the business against the earnings. It explains that the market position of the business is
improving day by day. Further, the earnings per share of the business have been reduced
because of the decrement in the net profitability level of the business. Dividend yield explains
that in the year of 2013, 2014 and 2015, no dividend has been paid by the business to its
stockholders but in recent year, the dividend yield of the business is 0.5 which is quite
compatible from last year (annual report, 2013). Lastly, the earning yield of the business
explains that the level of EPS is quite lower against the total stock price of the business.
Paraphrase This Document
Need a fresh take? Get an instant paraphrase of this document with our AI Paraphraser
Financial Analysis and management 8
It explains that the market position of the business has been improved from last year
and because of it, the interest of the stockholders has also been improved in the business.
Figure 5: Market value ratios
(Annual report, 2017)
Practical application and deployment:
Why trends:
On the basis of the above reports and the analysis on the financial statement of the
business, it has been found that the overall financial performance of the business has been
reduced at great level in last 5 years. These changes have occurred in the business because of
the lower demand of the property of the company. The changes have occurred because of few
internal and huge external changes in the industry. The tourism arrivals of Sri Lanka have
been studied and it has been found that the tourism level of the country has been reduced
because of that the demand of the hotels has been reduced. Because of lower demand, the
hotels were not able to meet the expected occupancy rate and it has hampered the total
turnover level and the profitability position of the business (Trading economies, 2018).
Further, it has also been found that the total administrative expenses and the
marketing expenses of the business have been improved from last year which has affected the
operating profit level and the finance cost level of the business has also been improved to
affect on the net profit level of the business (FT, 2018). These changes have occurred because
of the economical factors. But if the internal factors take into the concern, than it has been
Financial Analysis and management 9
found that the business has failed to make the changes into the services and information
technology along with the time, which have reduced the interest of the guest in these hotels
and they have switched to other business to availed their services (Bloomberg, 2018).
The improper budgeting is also a cause behind the negative trend in the business. On
the basis of the study, it has been found that it is quite important for the business to maintain
a proper pricing policy and control over the human resource of the business so that the cost
could be controlled and the overall performance of the business could be improved.
Recommendation:
The study explains that the turnover and the profitability level of the business have
been reduced along with the higher liquidity and financial risk in the business. On the basis of
analysis, below are the few strategies which must be followed by the business to improve the
overall performance of the business.
Return on Capital employed:
Return on capital employed generally must be more than 10% in a business as it
indicates about the total net profit generated against the capital of the business. In this case,
the main focus must be on the profitability level of the business through reducing the non
operating expenses and making the changes into the obstacle technology of the business
(Hillier, Grinblatt and Titman, 2011).
Return on assets:
Business is suggested to focus on the net profitability level along with that it is also
recommended to the business to reduce the assets level in the business.
Net profit margin %:
Few internal changes such as reducing the non operating expenses focus on the new
services and HR department and making the changes into the obstacle technology could help
the business to maintain the same profitability level again.
Creditor’s turnover days:
The creditor’s turnover days of the business are compatible enough. Business could
be managed in lower working capital right now.
Stock Turnover (days):
⊘ This is a preview!⊘
Do you want full access?
Subscribe today to unlock all pages.
Trusted by 1+ million students worldwide
Financial Analysis and management 10
Stock turnover days of the business are enough compatible because the charges of
warehouse and payment amount is reduced in current scenario.
Debtors Turnover (days):
Debtor’s turnover days of the business are also better in current situation. It defines
that the activities of the business could be run in lower working capital as well (Kinsky,
2011).
Current Ratio:
Current assets level must be improved by the business to maintain the liquidity
position and reduce the liquidity risk in the business.
Cash ratio:
It is recommended to improve the cash level of the business so that the short term debt
payment obligation could be met.
Quick ratio:
Quick assets level must be improved by the business to maintain the liquidity position
and reduce the liquidity risk in the business
Debt equity ratio:
Debt equity ratio has been improved from last few years and it could be improved
more through focusing on the same strategy (Horngren, 2009).
Debt ratio:
Debt ratio represents that the reduction in the asset level must be done to maintain and
reduce the financial risk in the business.
Interest Coverage Ratio:
Company has enough funds to pay off the debt obligation and the interest amount to
debt holders of the business.
P/E ratio:
P/E ratio of the business defines that the market position of the business is quite
compatible.
Earnings per share:
Paraphrase This Document
Need a fresh take? Get an instant paraphrase of this document with our AI Paraphraser
Financial Analysis and management 11
Earnings level depends on the net profitability level of the business which must be
improved by the management of the company (Gapenski, 2008).
Dividend yield:
Company is required to pay better dividend to the stockholder to attract them more
towards the business.
Earnings yield:
Earnings level of the business must also be focuses so that the investor’s level could
be improved in the business.
Conclusion:
On the basis of the overall study, it has been found that the financial performance of
the business has been reduced from last 5 years but few changes into the financial policies
and strategies could help the business to maintain the same performance and position in the
industry again. To conclude, Serendib hotels plc’s net profitability level, stock price and the
capital structure level has been affected and thus it became important for the business to
maintain these level in order to assure the industry level, market level and the financial level
of the business. Overall, the business is a good choice for the long term investment. If an
investor is looking for short term investment then he or she must not go for the stock of
Serendib hotels plc.
Financial Analysis and management 12
References:
Annual report. 2013. Serendib hotels plc. [online]. Available at:
http://colombostockwatch.com/2015/03/01/serendib-hotels-plc-2014-annual-report/ (accessed
10/11/18)
annual report. 2014. Serendib hotels plc. [online]. Available at:
http://colombostockwatch.com/wp-content/uploads/2015/05/SERENDIB-HOTELS-PLC-
SHOT.N0000-2014.pdf (accessed 10/11/18)
Annual report. 2015. Serendib hotels plc. [online]. Available at:
https://cdn.cse.lk/cmt/upload_report_file/601_1434536002.pdf (accessed 10/11/18)
Annual report. 2017. Serendib hotels plc. [online]. Available at:
https://cdn.cse.lk/cmt/upload_report_file/601_1496315990330.pdf (accessed 10/11/18)
Bloomberg. 2018. Serendib hotels plc. [online]. Available at:
https://www.bloomberg.com/research/stocks/private/snapshot.asp?privcapId=20386598
(accessed 10/11/18).
FT. 2018. Serendib hotels plc. [online]. Available at:
https://markets.ft.com/data/equities/tearsheet/summary?s=SHOT.N0000:CSE (accessed
10/11/18)
Gapenski, L.C., 2008. Healthcare finance: an introduction to accounting and financial
management. Health Administration Press.
Higgins, R. C., 2012. Analysis for financial management. McGraw-Hill/Irwin.
Hillier, D., Grinblatt, M. and Titman, S., 2011. Financial markets and corporate strategy.
McGraw Hill.
Horngren, C.T., 2009. Cost accounting: A managerial emphasis, 13/e. Pearson Education
India.
Kinsky, R. 2011. Charting Made Simple: A Beginner's Guide to Technical Analysis. John
Wiley & Sons.
Krantz, M. 2016. Fundamental Analysis for Dummies. London: John Wiley & Sons.
Lord, B.R., 2007. Strategic management accounting. Issues in Management Accounting, 3.
⊘ This is a preview!⊘
Do you want full access?
Subscribe today to unlock all pages.
Trusted by 1+ million students worldwide
1 out of 16
Related Documents


Your All-in-One AI-Powered Toolkit for Academic Success.
+13062052269
info@desklib.com
Available 24*7 on WhatsApp / Email
![[object Object]](/_next/static/media/star-bottom.7253800d.svg)
Unlock your academic potential
Copyright © 2020–2026 A2Z Services. All Rights Reserved. Developed and managed by ZUCOL.