Financial Analysis & Share Market Decisions: Crown, Qantas & Seek
VerifiedAdded on 2023/04/23
|20
|3665
|119
Report
AI Summary
This report presents a financial analysis focused on share market decision-making, examining Crown Resorts, Qantas Airways, and Seek Limited. Part 1 details the total investment in these companies, while Part 2 provides a comparative analysis of their products, services, executive compensation, profitability, and dividend policies. Graphical representations compare the companies' average returns against the All Ordinaries Index. Part 3 involves a ratio analysis, including liquidity, profitability, and long-term solvency ratios, to assess the financial health of each company and provide investment recommendations. The analysis uses financial data such as revenue, interest expense, EBIT, net profit, assets, and liabilities to calculate key ratios like current ratio and asset turnover, offering insights for potential investors. This report is available on Desklib, where students can find more solved assignments and study resources.
Running Head: FINANCIAL ANALYSIS 0
Financial Analysis
Financial Analysis
Paraphrase This Document
Need a fresh take? Get an instant paraphrase of this document with our AI Paraphraser
FINANCIAL ANALYSIS 1
Table of Contents
Part 1...........................................................................................................................................................1
TOTAL INVESTMENT..........................................................................................................................2
Part 2...........................................................................................................................................................2
Part A..........................................................................................................................................................2
Part B & C...................................................................................................................................................4
Part D..........................................................................................................................................................8
Part E...........................................................................................................................................................8
Crown Resorts.........................................................................................................................................8
Qantas Airways.......................................................................................................................................8
Seek Limited...........................................................................................................................................9
Part 3...........................................................................................................................................................9
Identification of the data..........................................................................................................................9
Ratio Analysis.......................................................................................................................................10
Liquidity Ratios.................................................................................................................................10
Profitability Ratios.............................................................................................................................11
Long Term Solvency Ratios..............................................................................................................13
Recommendations.....................................................................................................................................14
References.................................................................................................................................................14
Appendix 1................................................................................................................................................17
FINANCIAL ANALYSIS 2
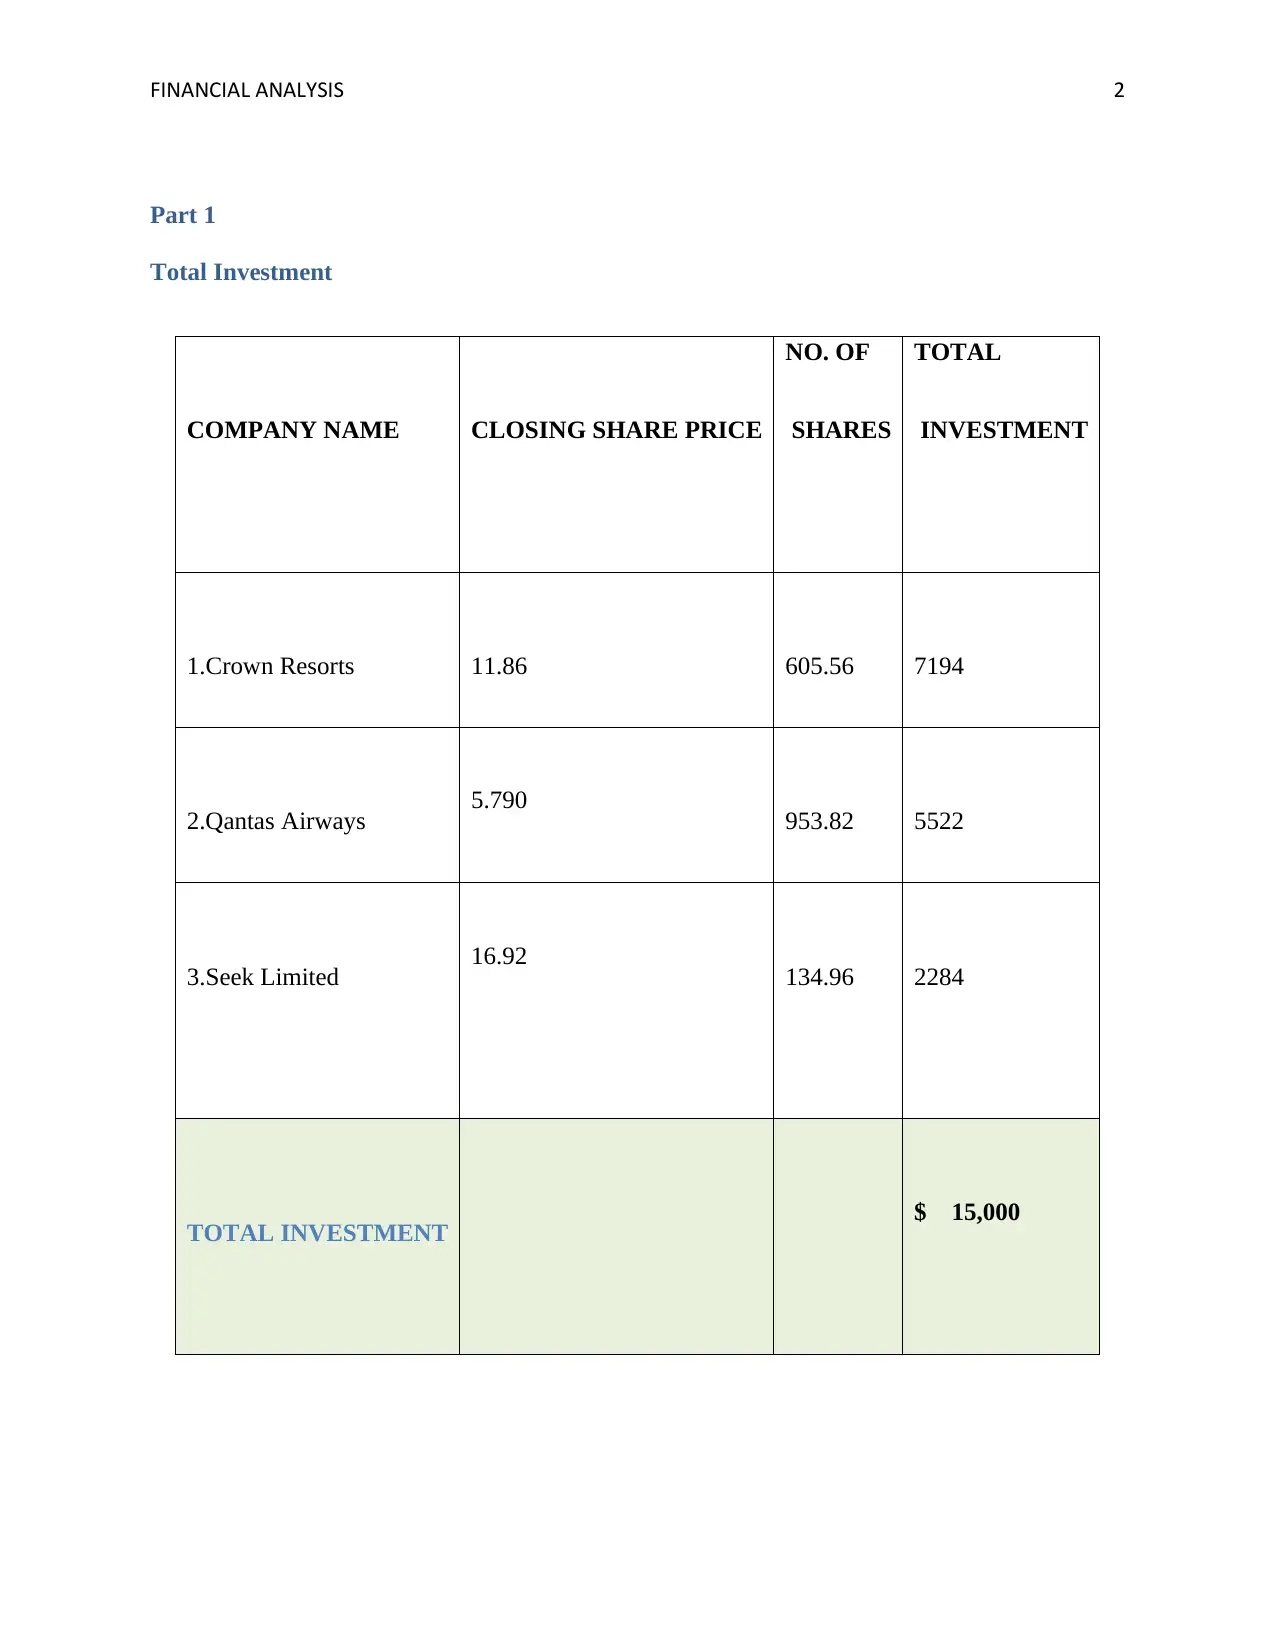
Part 1
Total Investment
COMPANY NAME CLOSING SHARE PRICE
NO. OF
SHARES
TOTAL
INVESTMENT
1.Crown Resorts 11.86 605.56 7194
2.Qantas Airways 5.790 953.82 5522
3.Seek Limited 16.92 134.96 2284
TOTAL INVESTMENT $ 15,000
Part 1
Total Investment
COMPANY NAME CLOSING SHARE PRICE
NO. OF
SHARES
TOTAL
INVESTMENT
1.Crown Resorts 11.86 605.56 7194
2.Qantas Airways 5.790 953.82 5522
3.Seek Limited 16.92 134.96 2284
TOTAL INVESTMENT $ 15,000
⊘ This is a preview!⊘
Do you want full access?
Subscribe today to unlock all pages.
Trusted by 1+ million students worldwide
FINANCIAL ANALYSIS 3
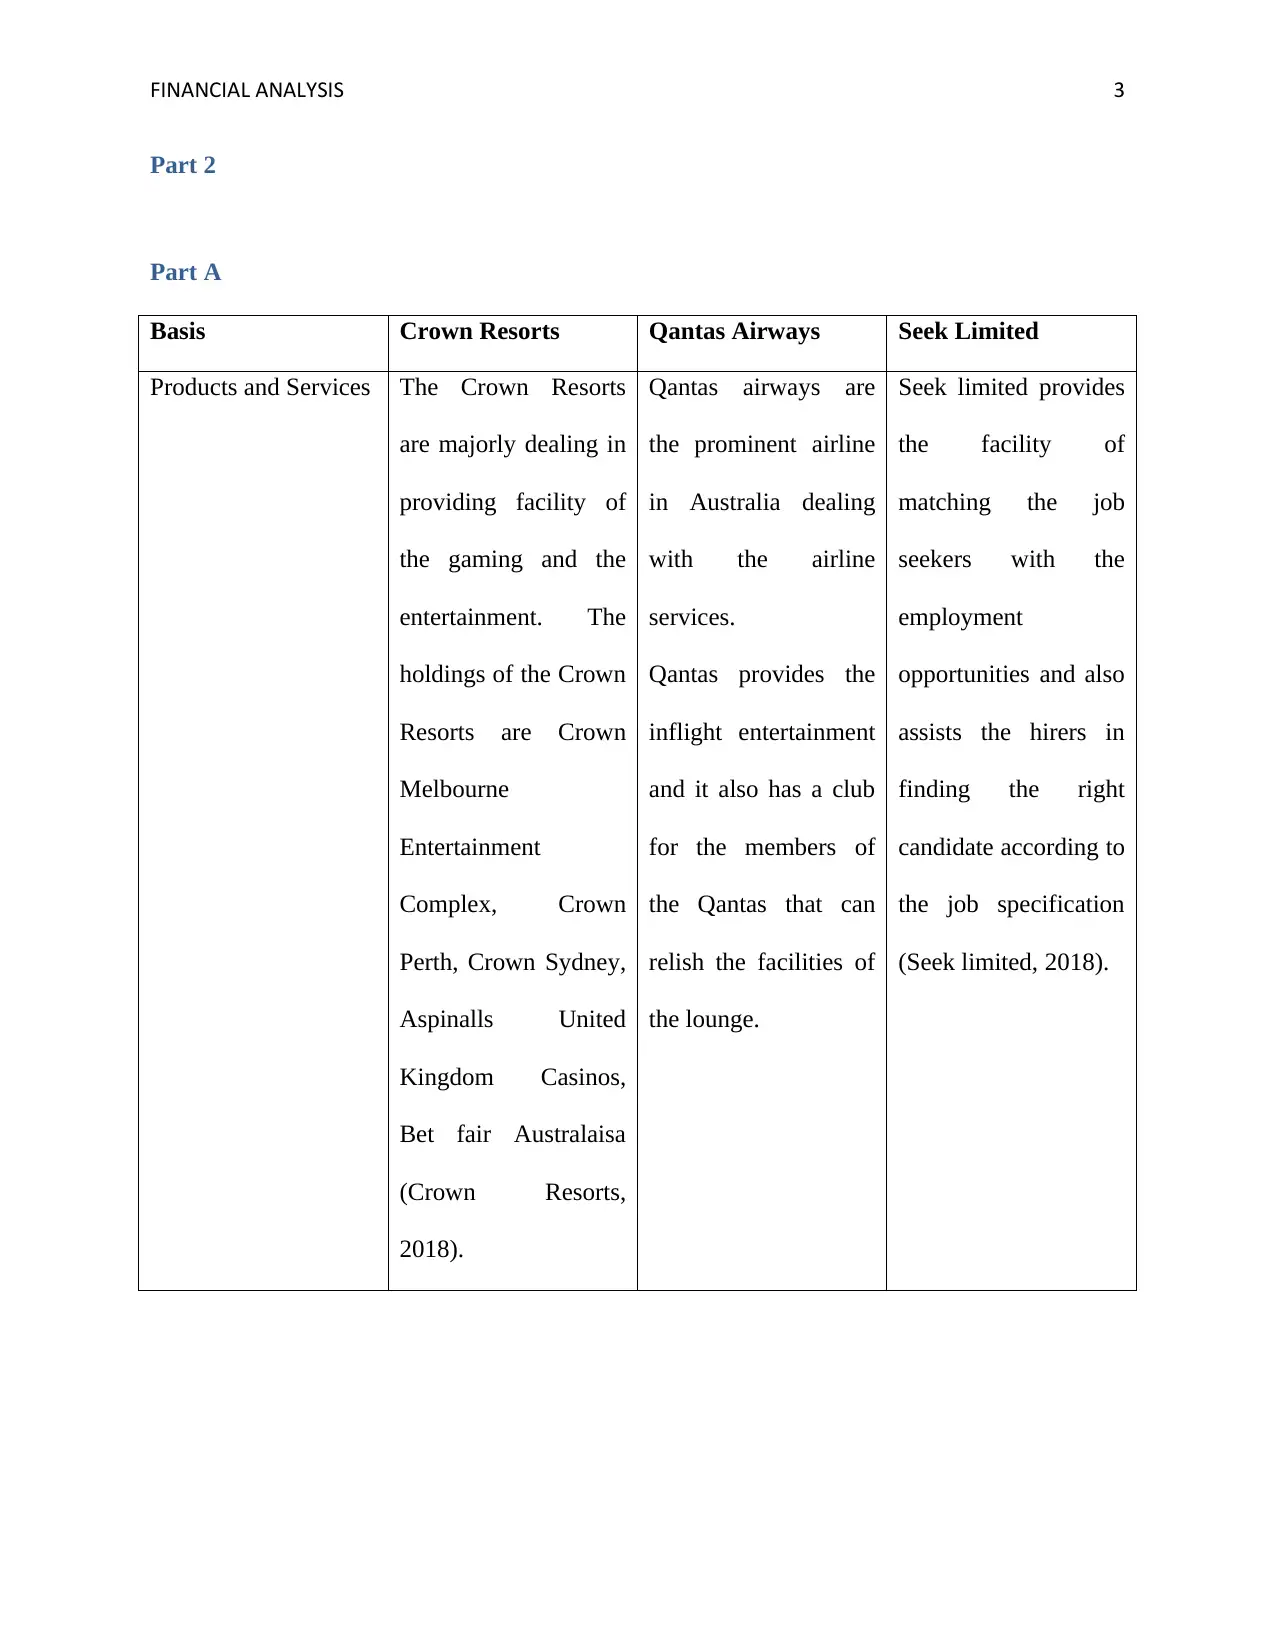
Part 2
Part A
Basis Crown Resorts Qantas Airways Seek Limited
Products and Services The Crown Resorts
are majorly dealing in
providing facility of
the gaming and the
entertainment. The
holdings of the Crown
Resorts are Crown
Melbourne
Entertainment
Complex, Crown
Perth, Crown Sydney,
Aspinalls United
Kingdom Casinos,
Bet fair Australaisa
(Crown Resorts,
2018).
Qantas airways are
the prominent airline
in Australia dealing
with the airline
services.
Qantas provides the
inflight entertainment
and it also has a club
for the members of
the Qantas that can
relish the facilities of
the lounge.
Seek limited provides
the facility of
matching the job
seekers with the
employment
opportunities and also
assists the hirers in
finding the right
candidate according to
the job specification
(Seek limited, 2018).
Paraphrase This Document
Need a fresh take? Get an instant paraphrase of this document with our AI Paraphraser
FINANCIAL ANALYSIS 4
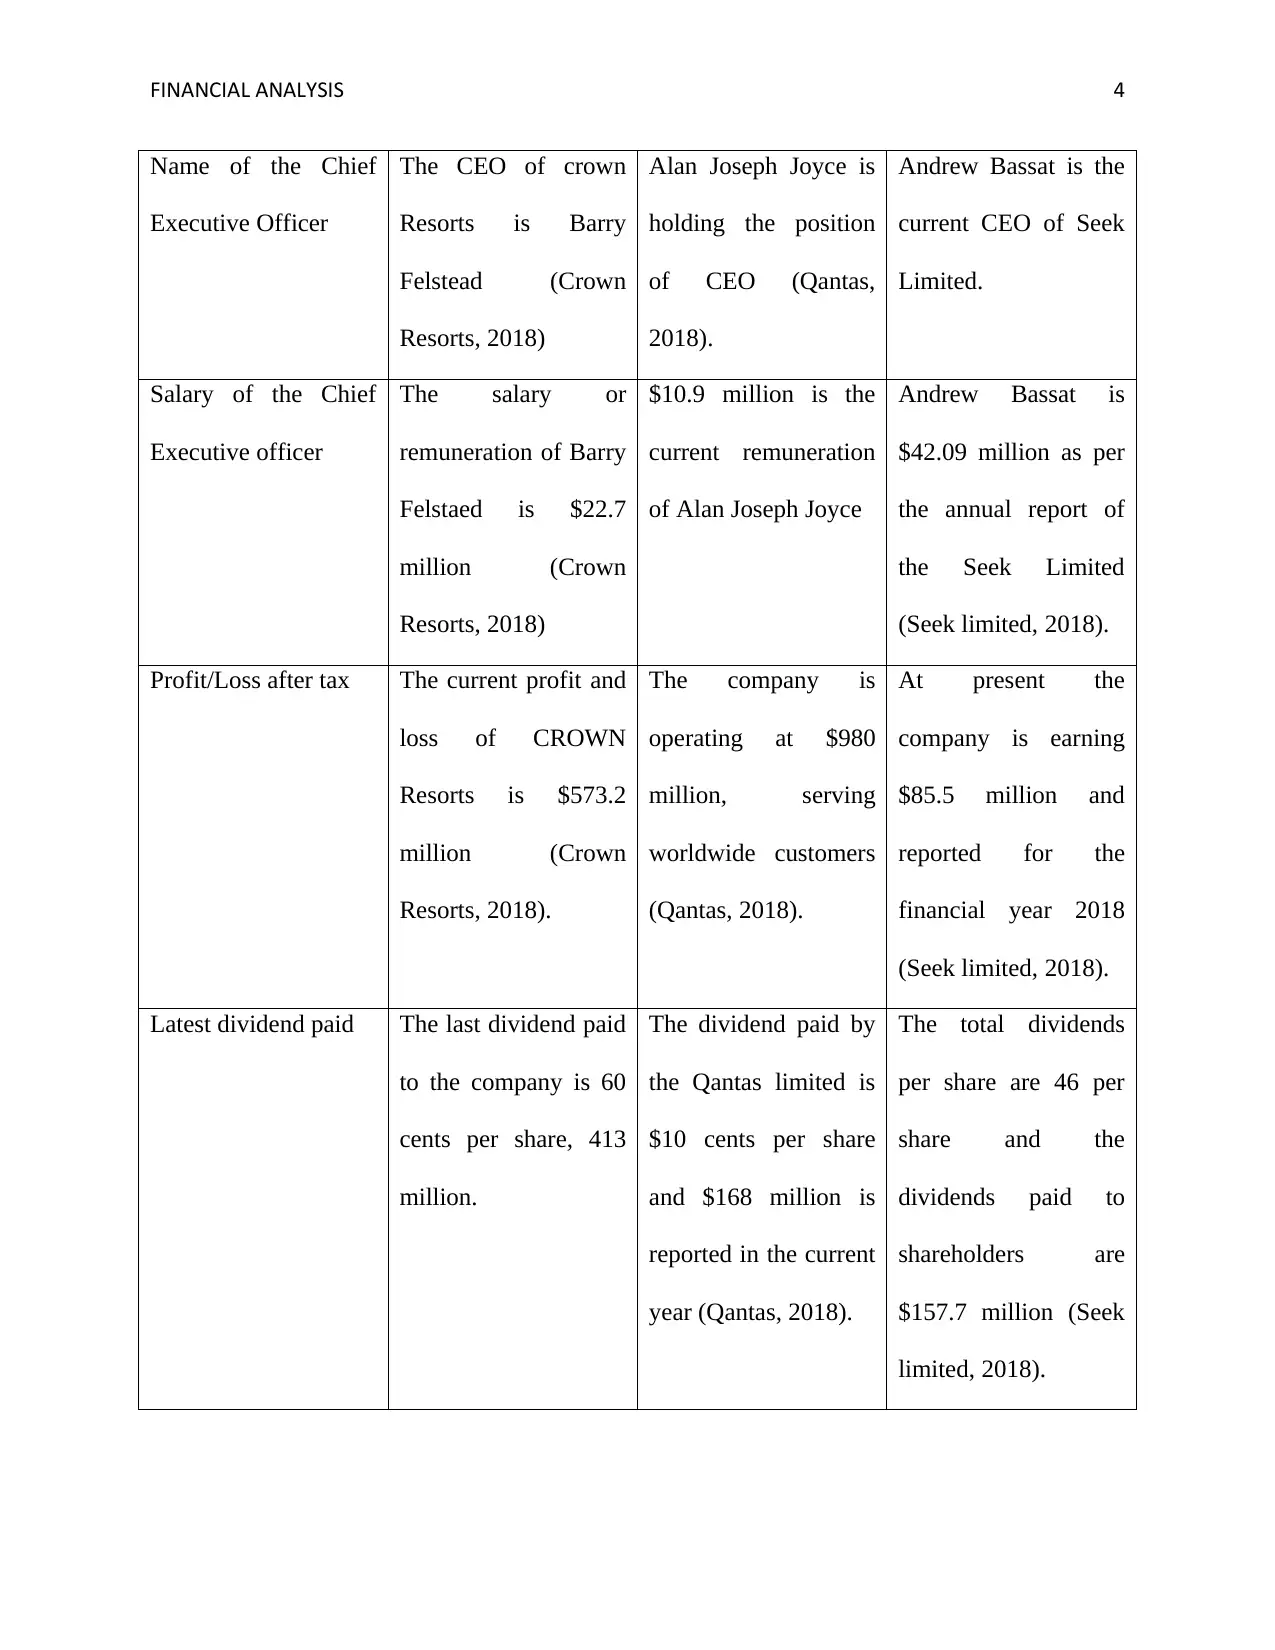
Name of the Chief
Executive Officer
The CEO of crown
Resorts is Barry
Felstead (Crown
Resorts, 2018)
Alan Joseph Joyce is
holding the position
of CEO (Qantas,
2018).
Andrew Bassat is the
current CEO of Seek
Limited.
Salary of the Chief
Executive officer
The salary or
remuneration of Barry
Felstaed is $22.7
million (Crown
Resorts, 2018)
$10.9 million is the
current remuneration
of Alan Joseph Joyce
Andrew Bassat is
$42.09 million as per
the annual report of
the Seek Limited
(Seek limited, 2018).
Profit/Loss after tax The current profit and
loss of CROWN
Resorts is $573.2
million (Crown
Resorts, 2018).
The company is
operating at $980
million, serving
worldwide customers
(Qantas, 2018).
At present the
company is earning
$85.5 million and
reported for the
financial year 2018
(Seek limited, 2018).
Latest dividend paid The last dividend paid
to the company is 60
cents per share, 413
million.
The dividend paid by
the Qantas limited is
$10 cents per share
and $168 million is
reported in the current
year (Qantas, 2018).
The total dividends
per share are 46 per
share and the
dividends paid to
shareholders are
$157.7 million (Seek
limited, 2018).
FINANCIAL ANALYSIS 5
Size of the business
by total assets
$8171 million $18647 million $3785 million
Number of Employees 12000 27000 805
Share Price $12.17 $43.01 $17.81
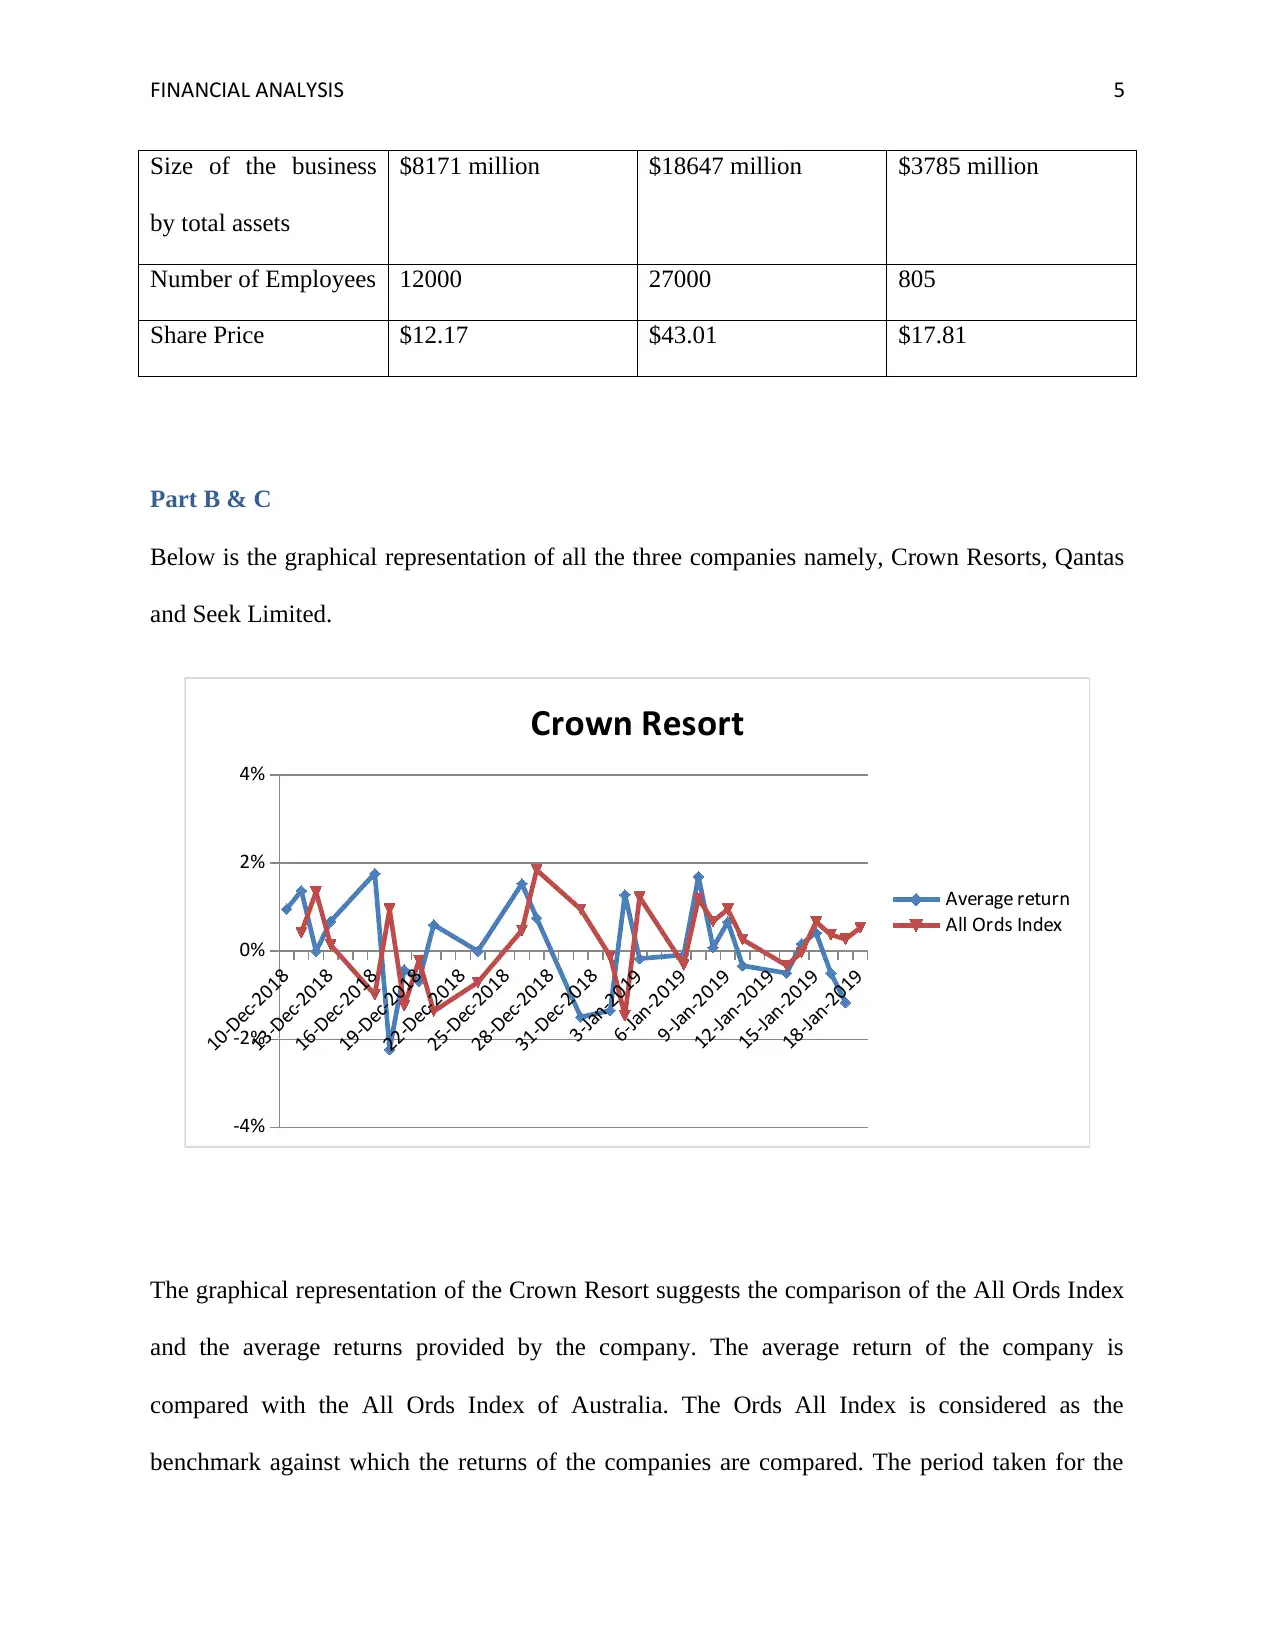
Part B & C
Below is the graphical representation of all the three companies namely, Crown Resorts, Qantas
and Seek Limited.
10-Dec-2018
13-Dec-2018
16-Dec-2018
19-Dec-2018
22-Dec-2018
25-Dec-2018
28-Dec-2018
31-Dec-2018
3-Jan-2019
6-Jan-2019
9-Jan-2019
12-Jan-2019
15-Jan-2019
18-Jan-2019
-4%
-2%
0%
2%
4%
Crown Resort
Average return
All Ords Index
The graphical representation of the Crown Resort suggests the comparison of the All Ords Index
and the average returns provided by the company. The average return of the company is
compared with the All Ords Index of Australia. The Ords All Index is considered as the
benchmark against which the returns of the companies are compared. The period taken for the
Size of the business
by total assets
$8171 million $18647 million $3785 million
Number of Employees 12000 27000 805
Share Price $12.17 $43.01 $17.81
Part B & C
Below is the graphical representation of all the three companies namely, Crown Resorts, Qantas
and Seek Limited.
10-Dec-2018
13-Dec-2018
16-Dec-2018
19-Dec-2018
22-Dec-2018
25-Dec-2018
28-Dec-2018
31-Dec-2018
3-Jan-2019
6-Jan-2019
9-Jan-2019
12-Jan-2019
15-Jan-2019
18-Jan-2019
-4%
-2%
0%
2%
4%
Crown Resort
Average return
All Ords Index
The graphical representation of the Crown Resort suggests the comparison of the All Ords Index
and the average returns provided by the company. The average return of the company is
compared with the All Ords Index of Australia. The Ords All Index is considered as the
benchmark against which the returns of the companies are compared. The period taken for the
⊘ This is a preview!⊘
Do you want full access?
Subscribe today to unlock all pages.
Trusted by 1+ million students worldwide
FINANCIAL ANALYSIS 6
comparison is the period of the 52 weeks and it can be interpreted for the graph that the average
return was always higher than the average returns posed by the All ORDS Index and this reflects
that the share price of the Crown Resorts are dependent of the market factors. Further the returns
produced by the company are giving tuff competition and are more volatile in nature. Moreover
this also reflects that the company is having the immediate connection with the All Ords Index.
The share price of the Crown Resorts Limited has been the biggest market mover on the market
on August 9, 2018. Further the company achieved the diluted earnings per share of 81.2 cents.
And the net profit after tax was down to 70% at $558 million (The motley fool crown, 2018).
10-Dec-2018
12-Dec-2018
14-Dec-2018
16-Dec-2018
18-Dec-2018
20-Dec-2018
22-Dec-2018
24-Dec-2018
26-Dec-2018
28-Dec-2018
30-Dec-2018
1-Jan-2019
3-Jan-2019
5-Jan-2019
7-Jan-2019
9-Jan-2019
11-Jan-2019
13-Jan-2019
15-Jan-2019
17-Jan-2019
-4%
-3%
-2%
-1%
0%
1%
2%
3%
4%
5%
6%
QANTAS
Average return
All Ords Index
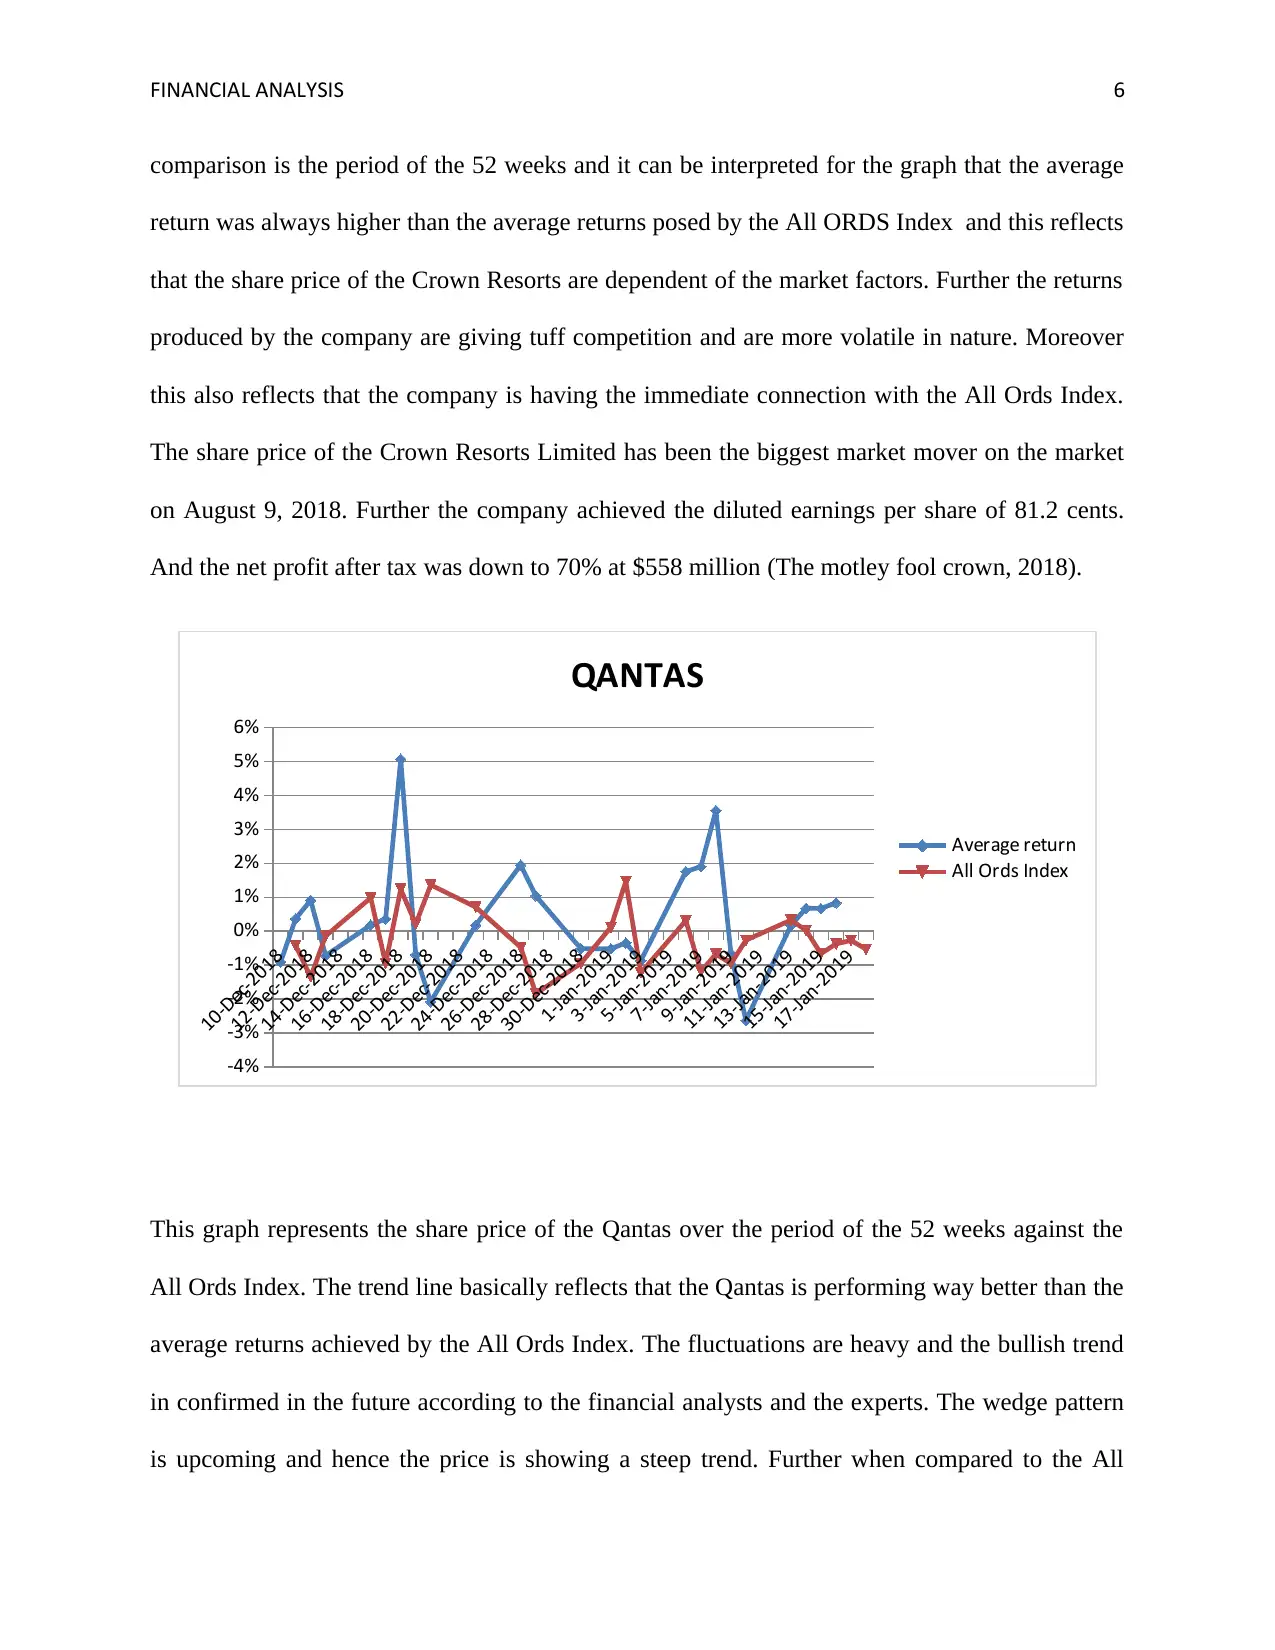
This graph represents the share price of the Qantas over the period of the 52 weeks against the
All Ords Index. The trend line basically reflects that the Qantas is performing way better than the
average returns achieved by the All Ords Index. The fluctuations are heavy and the bullish trend
in confirmed in the future according to the financial analysts and the experts. The wedge pattern
is upcoming and hence the price is showing a steep trend. Further when compared to the All
comparison is the period of the 52 weeks and it can be interpreted for the graph that the average
return was always higher than the average returns posed by the All ORDS Index and this reflects
that the share price of the Crown Resorts are dependent of the market factors. Further the returns
produced by the company are giving tuff competition and are more volatile in nature. Moreover
this also reflects that the company is having the immediate connection with the All Ords Index.
The share price of the Crown Resorts Limited has been the biggest market mover on the market
on August 9, 2018. Further the company achieved the diluted earnings per share of 81.2 cents.
And the net profit after tax was down to 70% at $558 million (The motley fool crown, 2018).
10-Dec-2018
12-Dec-2018
14-Dec-2018
16-Dec-2018
18-Dec-2018
20-Dec-2018
22-Dec-2018
24-Dec-2018
26-Dec-2018
28-Dec-2018
30-Dec-2018
1-Jan-2019
3-Jan-2019
5-Jan-2019
7-Jan-2019
9-Jan-2019
11-Jan-2019
13-Jan-2019
15-Jan-2019
17-Jan-2019
-4%
-3%
-2%
-1%
0%
1%
2%
3%
4%
5%
6%
QANTAS
Average return
All Ords Index
This graph represents the share price of the Qantas over the period of the 52 weeks against the
All Ords Index. The trend line basically reflects that the Qantas is performing way better than the
average returns achieved by the All Ords Index. The fluctuations are heavy and the bullish trend
in confirmed in the future according to the financial analysts and the experts. The wedge pattern
is upcoming and hence the price is showing a steep trend. Further when compared to the All
Paraphrase This Document
Need a fresh take? Get an instant paraphrase of this document with our AI Paraphraser
FINANCIAL ANALYSIS 7
Ords Index the position of the trends are high. The returns are independent of the performance of
the market factors. The returns of the company showed negative returns in the year few times.
Even after the impressive year and the company did announced the strong dividend, the share fell
but the company improved its operations and the share price went up by 2% to $6.04 on
November 28, 2018 as the oil prices fell down and this can lift up the position of the Qantas out
to the financial year 2020 (The motley fool qantas, 2018).
10-Dec-2018
13-Dec-2018
16-Dec-2018
19-Dec-2018
22-Dec-2018
25-Dec-2018
28-Dec-2018
31-Dec-2018
3-Jan-2019
6-Jan-2019
9-Jan-2019
12-Jan-2019
15-Jan-2019
18-Jan-2019
-4%
-3%
-2%
-1%
0%
1%
2%
3%
4%
Seek Limited
All Ords Index
Average return
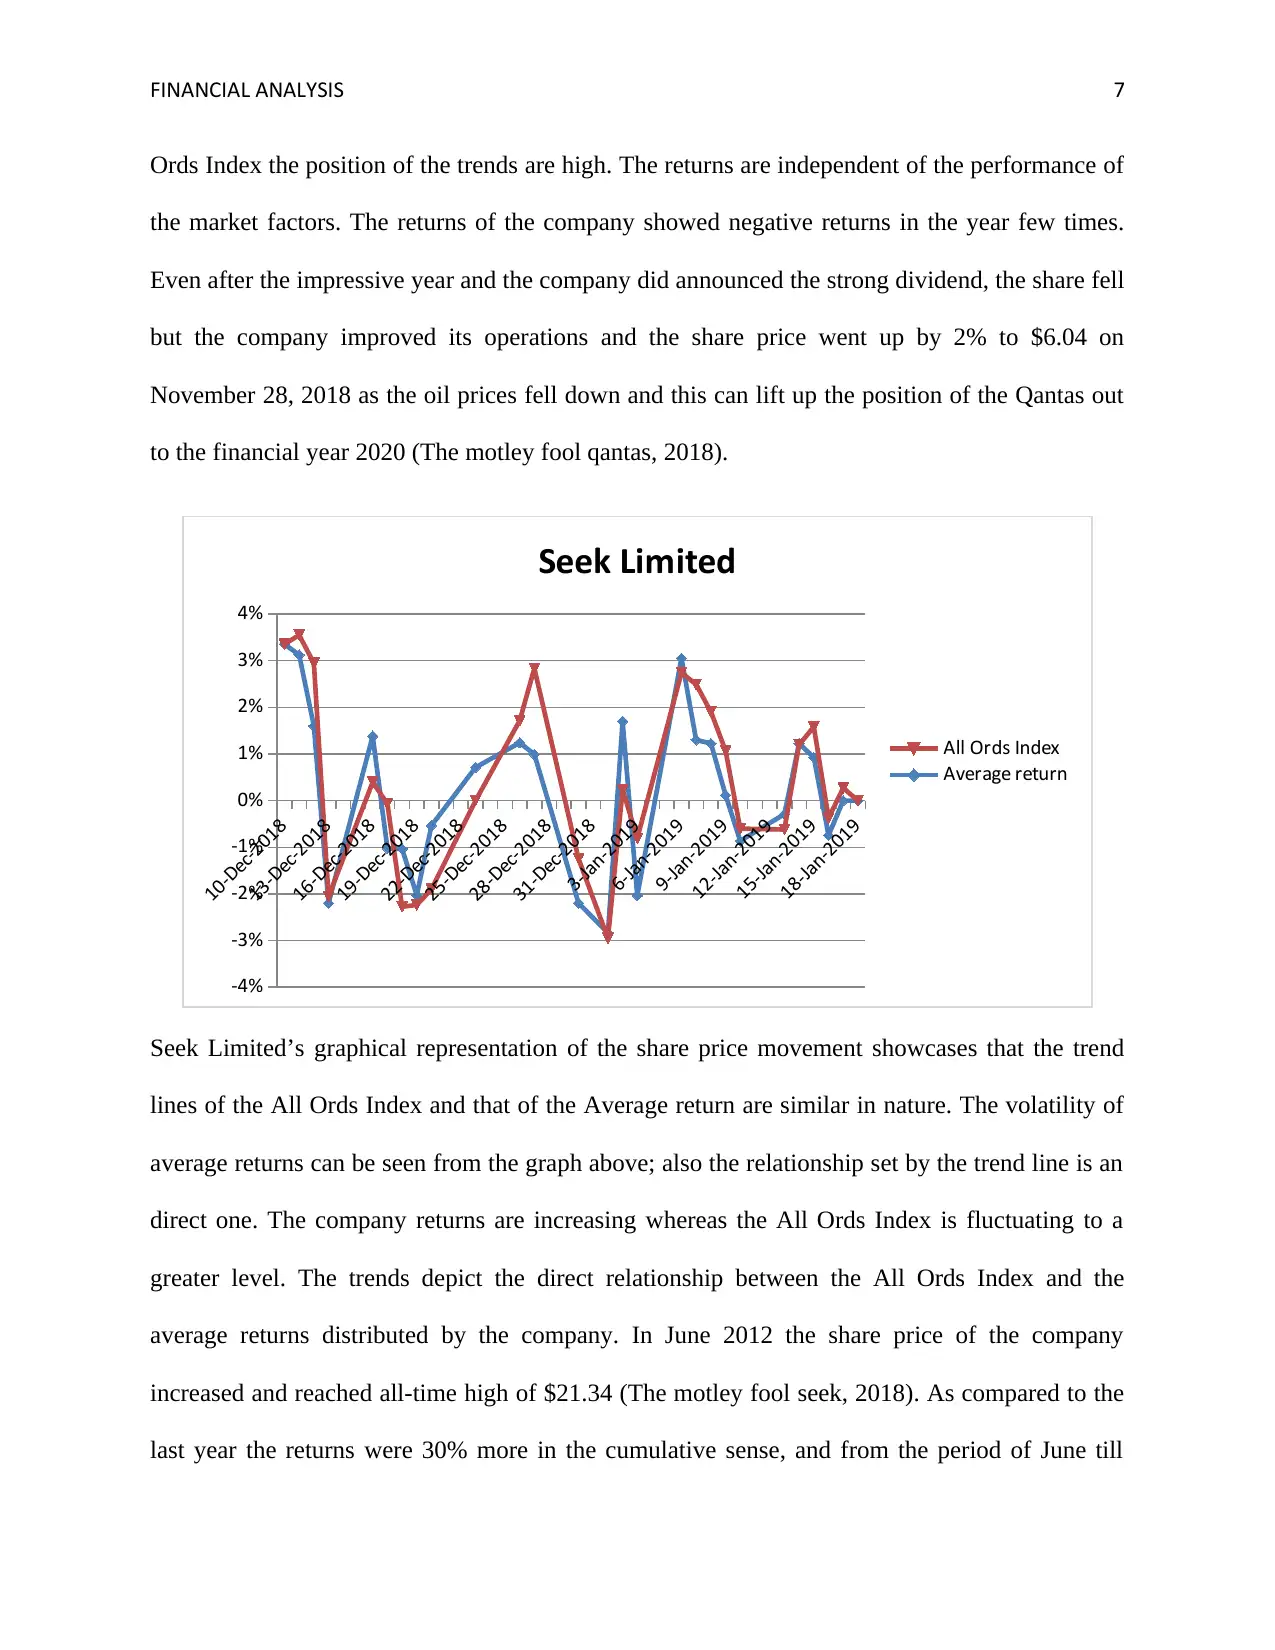
Seek Limited’s graphical representation of the share price movement showcases that the trend
lines of the All Ords Index and that of the Average return are similar in nature. The volatility of
average returns can be seen from the graph above; also the relationship set by the trend line is an
direct one. The company returns are increasing whereas the All Ords Index is fluctuating to a
greater level. The trends depict the direct relationship between the All Ords Index and the
average returns distributed by the company. In June 2012 the share price of the company
increased and reached all-time high of $21.34 (The motley fool seek, 2018). As compared to the
last year the returns were 30% more in the cumulative sense, and from the period of June till
Ords Index the position of the trends are high. The returns are independent of the performance of
the market factors. The returns of the company showed negative returns in the year few times.
Even after the impressive year and the company did announced the strong dividend, the share fell
but the company improved its operations and the share price went up by 2% to $6.04 on
November 28, 2018 as the oil prices fell down and this can lift up the position of the Qantas out
to the financial year 2020 (The motley fool qantas, 2018).
10-Dec-2018
13-Dec-2018
16-Dec-2018
19-Dec-2018
22-Dec-2018
25-Dec-2018
28-Dec-2018
31-Dec-2018
3-Jan-2019
6-Jan-2019
9-Jan-2019
12-Jan-2019
15-Jan-2019
18-Jan-2019
-4%
-3%
-2%
-1%
0%
1%
2%
3%
4%
Seek Limited
All Ords Index
Average return
Seek Limited’s graphical representation of the share price movement showcases that the trend
lines of the All Ords Index and that of the Average return are similar in nature. The volatility of
average returns can be seen from the graph above; also the relationship set by the trend line is an
direct one. The company returns are increasing whereas the All Ords Index is fluctuating to a
greater level. The trends depict the direct relationship between the All Ords Index and the
average returns distributed by the company. In June 2012 the share price of the company
increased and reached all-time high of $21.34 (The motley fool seek, 2018). As compared to the
last year the returns were 30% more in the cumulative sense, and from the period of June till

FINANCIAL ANALYSIS 8
November it can be seen that the price of the company rose and from the perspective of the
investors and the shareholders, this is the good option to hold or sell as it is going to deliver the
future returns. Further those who have already brought, these investments will result for the
longer duration benefits and hence the share shall be kept on hold (Mickeboror, 2018).
Part D
Closing
at
10/12/20
18
Closing
at
18/01/20
19
Differen
ce
Current
Numbe
r of
shares
Loss per
price
Crown
Resorts 11.86 11.88 -0.02 5157 48% -103.14
7193.8
1
60
5
Qantas
Airways 5.79 6.15 -0.36
3959.0
0 37% -1425.24
5522.6
4
89
7
Seek Limited 16.90 17.43 -0.53
1637.0
0 15% -867.61
2283.5
5
13
1
Total
10753.
00
100
%
15000.
00
⊘ This is a preview!⊘
Do you want full access?
Subscribe today to unlock all pages.
Trusted by 1+ million students worldwide
FINANCIAL ANALYSIS 9
Part E
Crown Resorts
Therefore this is a great option from the point of view of the investors to gain exposure of the
tourism boom in Australia. The company was also going with the option of the repurchase at the
rate of the 4.4% of the issued capital. Hence this option is preferable for the investors having the
bullish attitude towards the shares of the Crown Resorts. Therefore the shares shall be purchased
(The motley fool crown, 2018).
Qantas Airways
The Qantas showed the break record performance for the significant year even after having the
ideology behind that the airline industry not suitable or say more fluctuating for the investors to
invest in. therefore it is advised to the investors to wait for the price of the shares to fall, as the
chances are that oil prices are going to fell considering the trend of the oil prices (The motley
fool qantas, 2018).
Seek Limited
The company is a low growth company but is investing for future heavily. Hence this option is a
good option to hold. Hence the Seek Limited’s investors are required to hold the options as the
opportunities will cater the investors once the investments are made by the company at the larger
scale.
Part 3
Identification of the data
Particulars Crown Resort Qantas Seek Limited
Paraphrase This Document
Need a fresh take? Get an instant paraphrase of this document with our AI Paraphraser

FINANCIAL ANALYSIS 10
Revenue / Sales 3493 14715 1310
Interest Expense 76 230 43.4
EBIT 820 1573 343.1
Net Profit Before Tax 744 1391 174
Net Profit After Tax 573 980 91
Current Assets 2076 3712 625
Total Assets 8171 18647 3786
Current Liabilities 843 7596 764
Total Liabilities 3013 14688 2148
Total Equity 5157 3959 1637
Ratio Analysis
Ratio analysis is the technique which is used to compare the data either on the basis of the
previous year or on the basis of the industry benchmarks. It is basically a technique which is used
to decide the financial performance of the companies. For the purpose of this report the ratios
analysis technique has been undertaken with the aim of finding out the results of the three
companies namely the Crown Resorts, Qantas and the Seek limited (Faello, 2015).
Calculation of
Ratios
Crown
Resort
Qantas Seek
Limited
Liquidity Ratios
FINANCIAL ANALYSIS 11
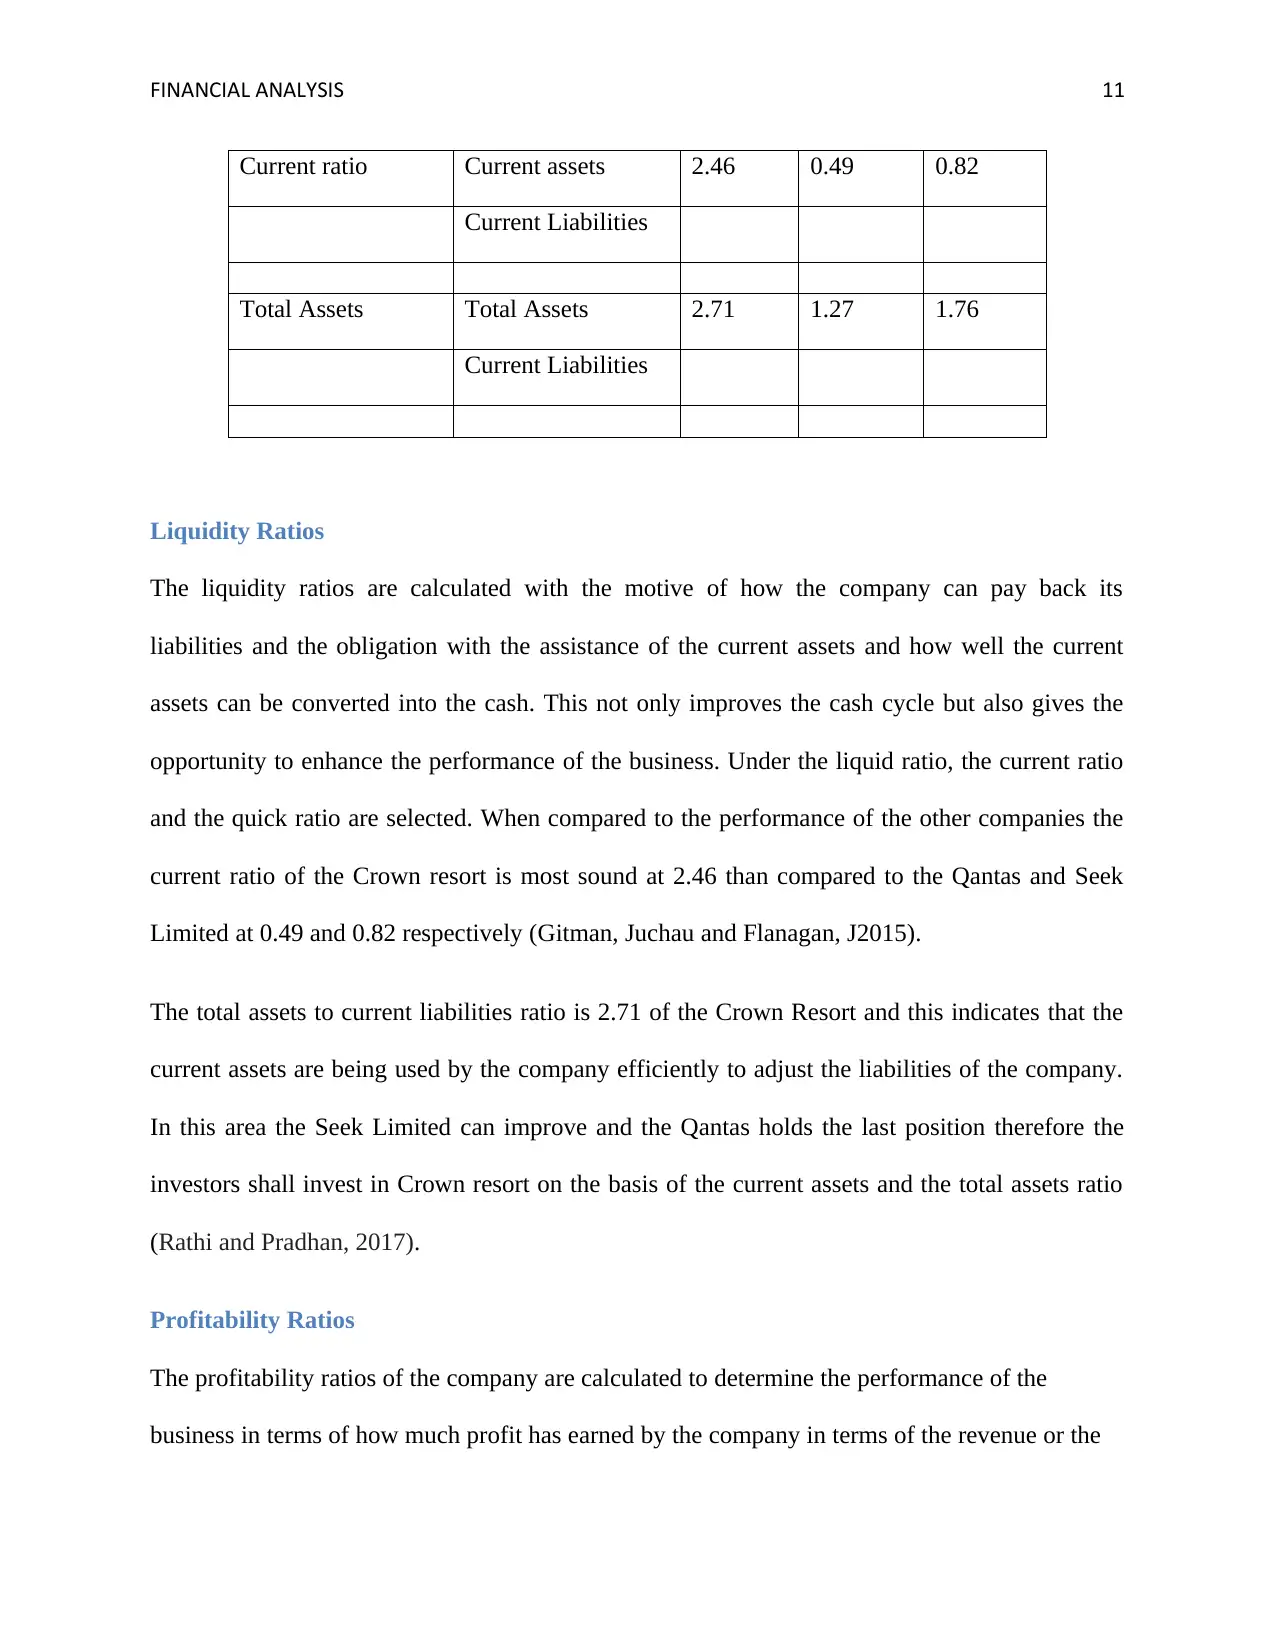
Current ratio Current assets 2.46 0.49 0.82
Current Liabilities
Total Assets Total Assets 2.71 1.27 1.76
Current Liabilities
Liquidity Ratios
The liquidity ratios are calculated with the motive of how the company can pay back its
liabilities and the obligation with the assistance of the current assets and how well the current
assets can be converted into the cash. This not only improves the cash cycle but also gives the
opportunity to enhance the performance of the business. Under the liquid ratio, the current ratio
and the quick ratio are selected. When compared to the performance of the other companies the
current ratio of the Crown resort is most sound at 2.46 than compared to the Qantas and Seek
Limited at 0.49 and 0.82 respectively (Gitman, Juchau and Flanagan, J2015).
The total assets to current liabilities ratio is 2.71 of the Crown Resort and this indicates that the
current assets are being used by the company efficiently to adjust the liabilities of the company.
In this area the Seek Limited can improve and the Qantas holds the last position therefore the
investors shall invest in Crown resort on the basis of the current assets and the total assets ratio
(Rathi and Pradhan, 2017).
Profitability Ratios
The profitability ratios of the company are calculated to determine the performance of the
business in terms of how much profit has earned by the company in terms of the revenue or the
⊘ This is a preview!⊘
Do you want full access?
Subscribe today to unlock all pages.
Trusted by 1+ million students worldwide
1 out of 20
Related Documents


Your All-in-One AI-Powered Toolkit for Academic Success.
+13062052269
info@desklib.com
Available 24*7 on WhatsApp / Email
![[object Object]](/_next/static/media/star-bottom.7253800d.svg)
Unlock your academic potential
Copyright © 2020–2026 A2Z Services. All Rights Reserved. Developed and managed by ZUCOL.