Financial Analysis of Singapore Airlines (FDM Assessment, 2019)
VerifiedAdded on 2019/09/30
|20
|3290
|295
Report
AI Summary
This report provides a detailed financial analysis of Singapore Airlines, examining its performance based on data from 2019. The analysis includes horizontal and vertical analysis, exploring the economic conditions of the aviation sector and the company's financial ratios, including profitability, dividend, solvency, liquidity, and efficiency ratios. The report also delves into non-financial aspects such as brand preference, customer service, strengths, weaknesses, opportunities, and threats. Furthermore, it covers news, criticisms, and corporate governance aspects, concluding with a summary of the company's overall financial health and market position. This report is a comprehensive assessment of Singapore Airlines' operations and financial standing, offering a valuable resource for understanding its performance within the aviation industry.
Company Analysis
on
Name | FDM Assessment | 21 August 2024
on
Name | FDM Assessment | 21 August 2024
Paraphrase This Document
Need a fresh take? Get an instant paraphrase of this document with our AI Paraphraser
TABLE OF CONTENTS
INTRODUCTION ....................................................................................................................1
HORIZONTAL AND VERTICAL ANALYSIS.............................................................................2
ECONOMIC CONDITION OF THE AVITAION SECTOR...............................................................6
RATIO ANALYSIS.................................................................................................................7
ANALYSIS OF NON-FINANCIAL THINGS..............................................................................11
SCETION B- NEWS/CRISTICISM/CORPORATE GOVERNANCE..............................................12
CONCLUSION......................................................................................................................13
REFERENCES.......................................................................................................................14
APPENDIX...........................................................................................................................16
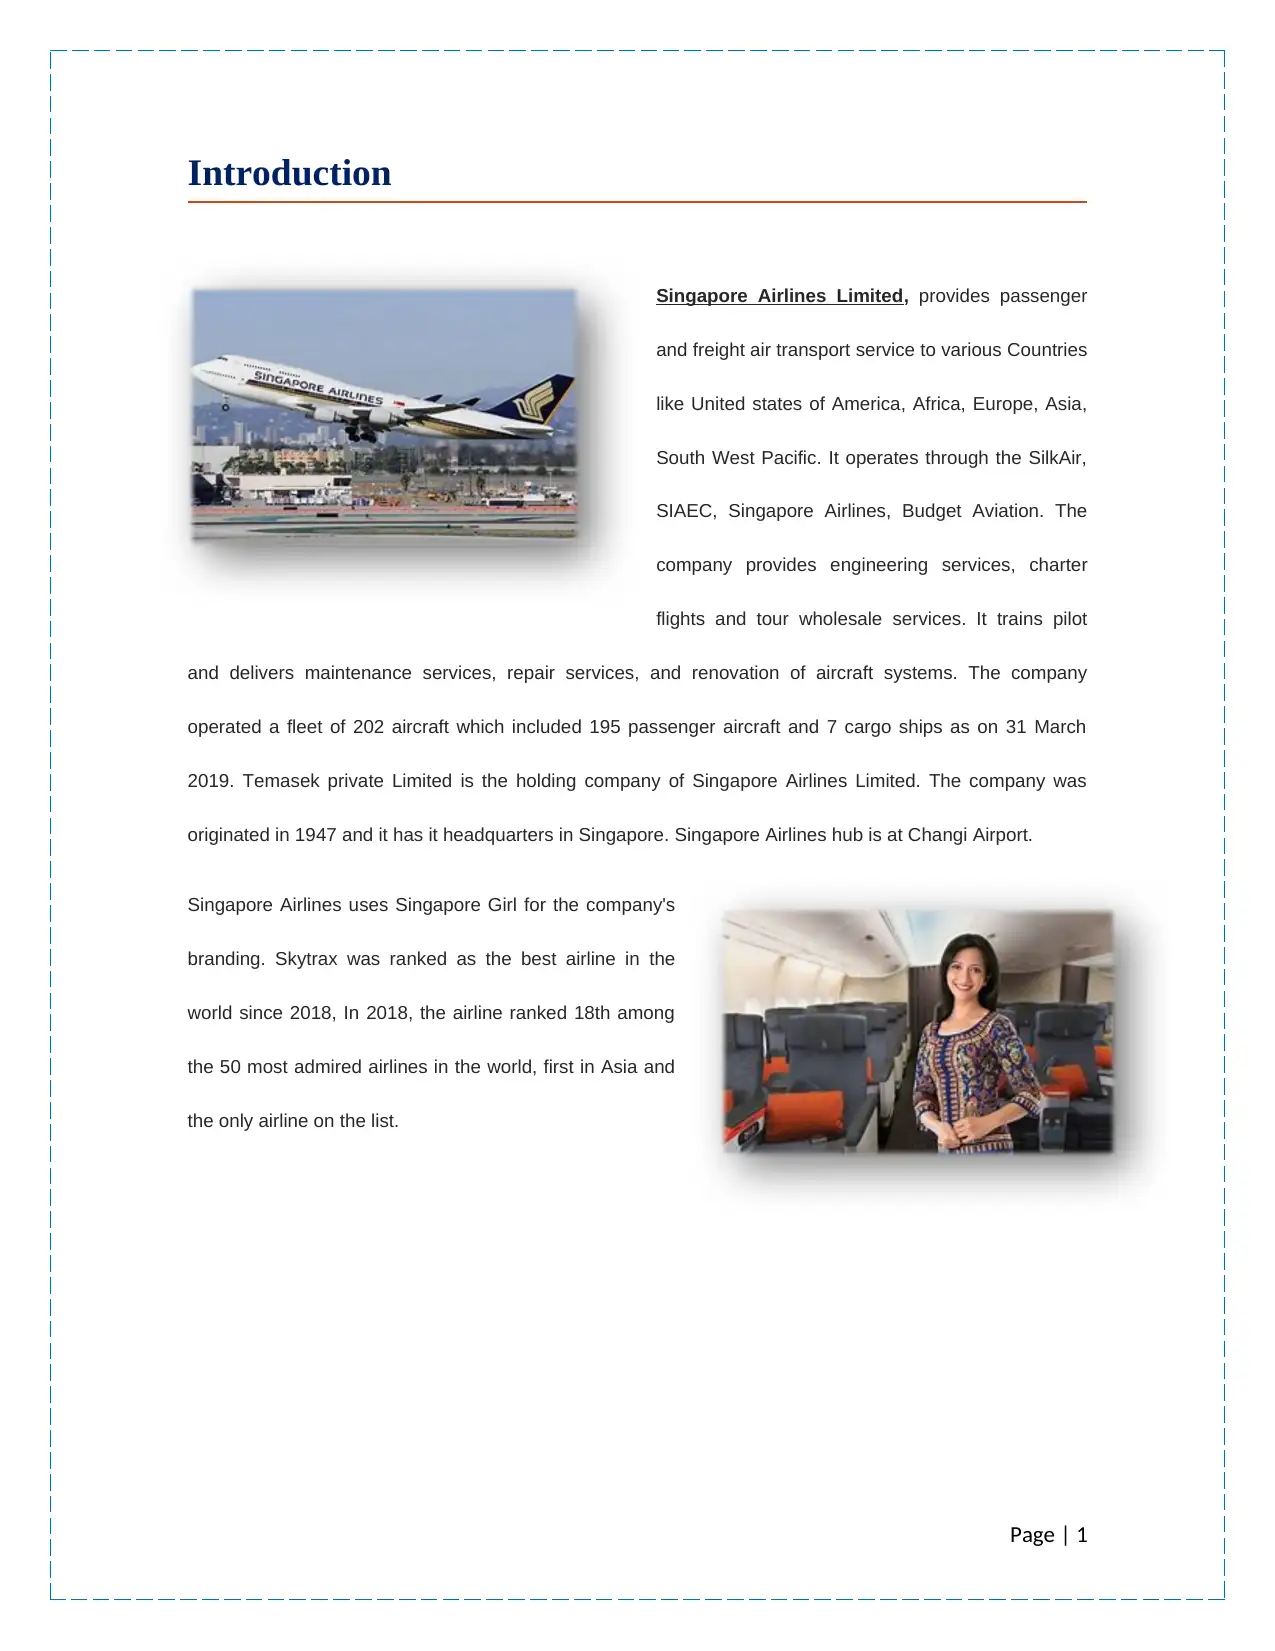
Introduction
Singapore Airlines Limited, provides passenger
and freight air transport service to various Countries
like United states of America, Africa, Europe, Asia,
South West Pacific. It operates through the SilkAir,
SIAEC, Singapore Airlines, Budget Aviation. The
company provides engineering services, charter
flights and tour wholesale services. It trains pilot
and delivers maintenance services, repair services, and renovation of aircraft systems. The company
operated a fleet of 202 aircraft which included 195 passenger aircraft and 7 cargo ships as on 31 March
2019. Temasek private Limited is the holding company of Singapore Airlines Limited. The company was
originated in 1947 and it has it headquarters in Singapore. Singapore Airlines hub is at Changi Airport.
Singapore Airlines uses Singapore Girl for the company's
branding. Skytrax was ranked as the best airline in the
world since 2018, In 2018, the airline ranked 18th among
the 50 most admired airlines in the world, first in Asia and
the only airline on the list.
Page | 1
⊘ This is a preview!⊘
Do you want full access?
Subscribe today to unlock all pages.
Trusted by 1+ million students worldwide
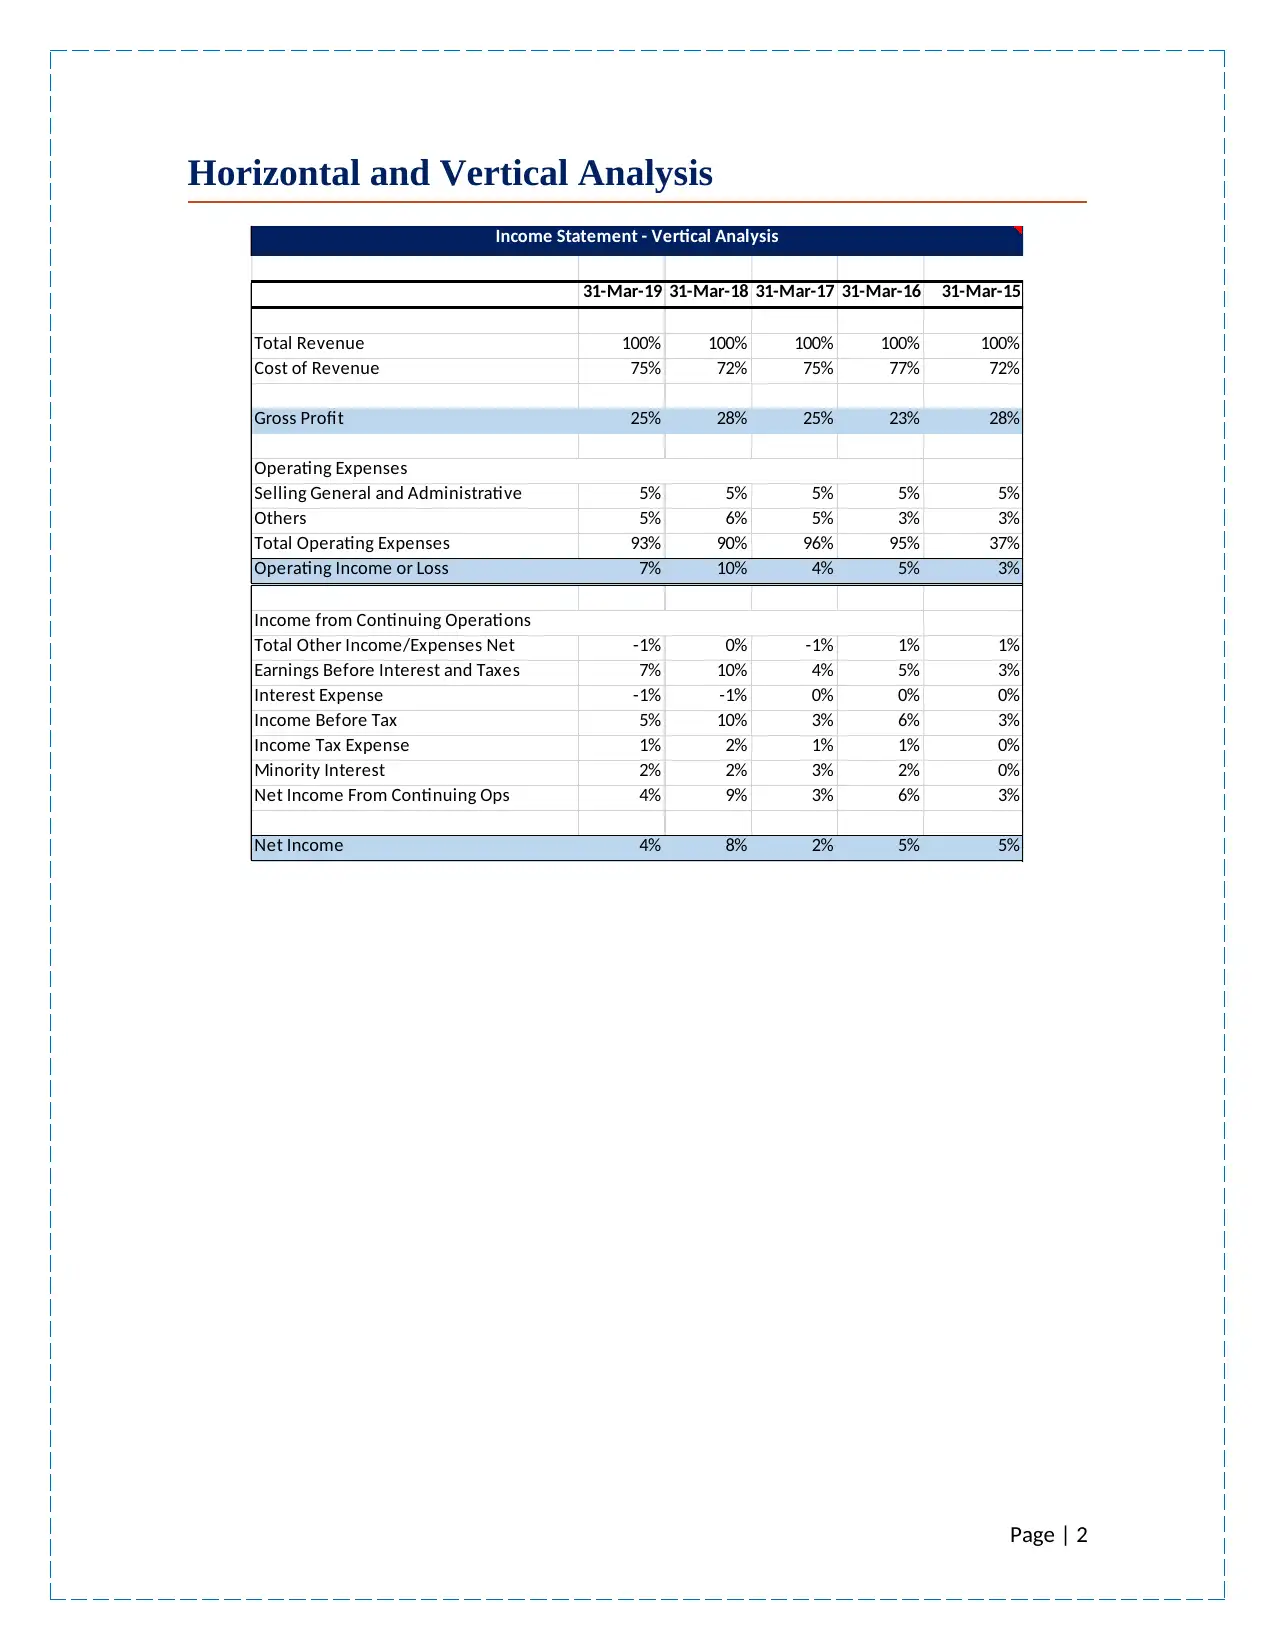
Horizontal and Vertical Analysis
31-Mar-19 31-Mar-18 31-Mar-17 31-Mar-16 31-Mar-15
Total Revenue 100% 100% 100% 100% 100%
Cost of Revenue 75% 72% 75% 77% 72%
Gross Profit 25% 28% 25% 23% 28%
Selling General and Administrative 5% 5% 5% 5% 5%
Others 5% 6% 5% 3% 3%
Total Operating Expenses 93% 90% 96% 95% 37%
Operating Income or Loss 7% 10% 4% 5% 3%
Total Other Income/Expenses Net -1% 0% -1% 1% 1%
Earnings Before Interest and Taxes 7% 10% 4% 5% 3%
Interest Expense -1% -1% 0% 0% 0%
Income Before Tax 5% 10% 3% 6% 3%
Income Tax Expense 1% 2% 1% 1% 0%
Minority Interest 2% 2% 3% 2% 0%
Net Income From Continuing Ops 4% 9% 3% 6% 3%
Net Income 4% 8% 2% 5% 5%
Operating Expenses
Income from Continuing Operations
Income Statement - Vertical Analysis
Page | 2
Paraphrase This Document
Need a fresh take? Get an instant paraphrase of this document with our AI Paraphraser
31-Mar-19 31-Mar-18 31-Mar-17 31-Mar-16 31-Mar-15
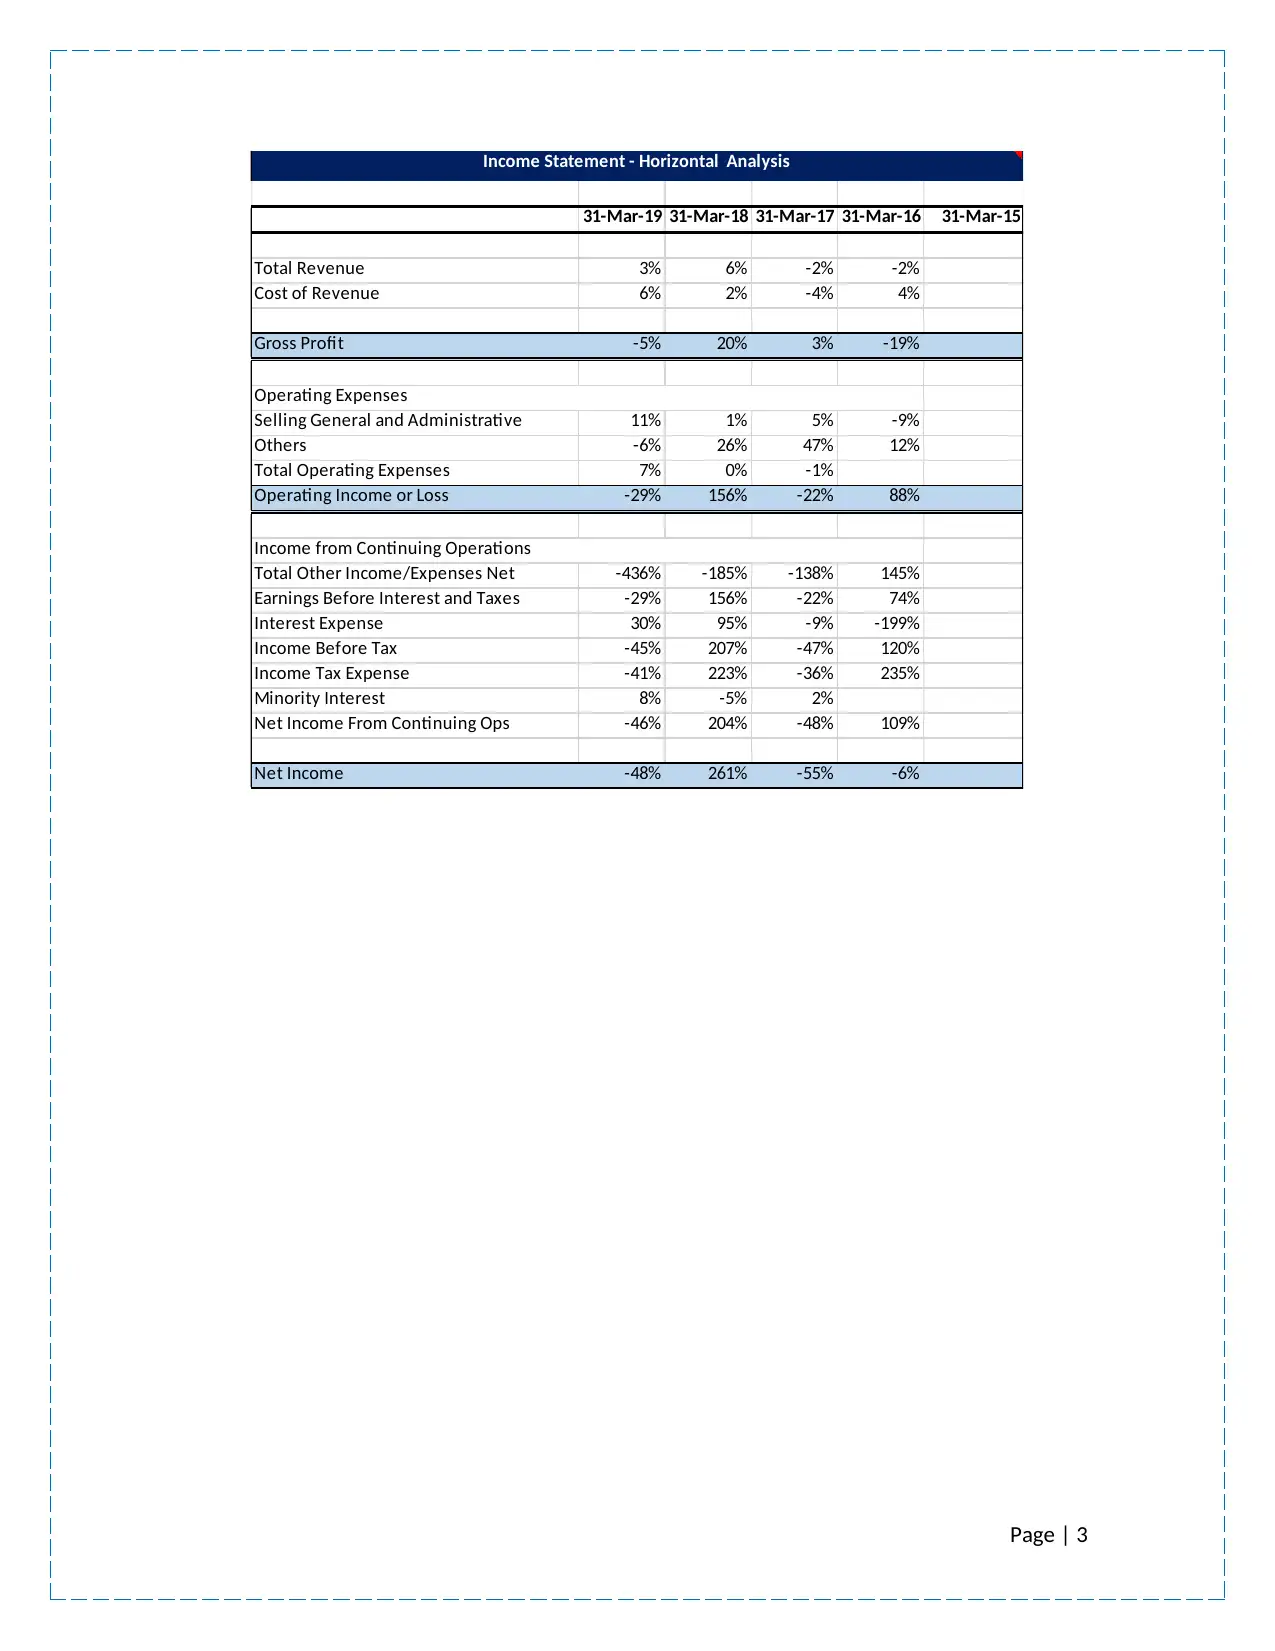
Total Revenue 3% 6% -2% -2%
Cost of Revenue 6% 2% -4% 4%
Gross Profit -5% 20% 3% -19%
Selling General and Administrative 11% 1% 5% -9%
Others -6% 26% 47% 12%
Total Operating Expenses 7% 0% -1%
Operating Income or Loss -29% 156% -22% 88%
Total Other Income/Expenses Net -436% -185% -138% 145%
Earnings Before Interest and Taxes -29% 156% -22% 74%
Interest Expense 30% 95% -9% -199%
Income Before Tax -45% 207% -47% 120%
Income Tax Expense -41% 223% -36% 235%
Minority Interest 8% -5% 2%
Net Income From Continuing Ops -46% 204% -48% 109%
Net Income -48% 261% -55% -6%
Operating Expenses
Income from Continuing Operations
Income Statement - Horizontal Analysis
Page | 3

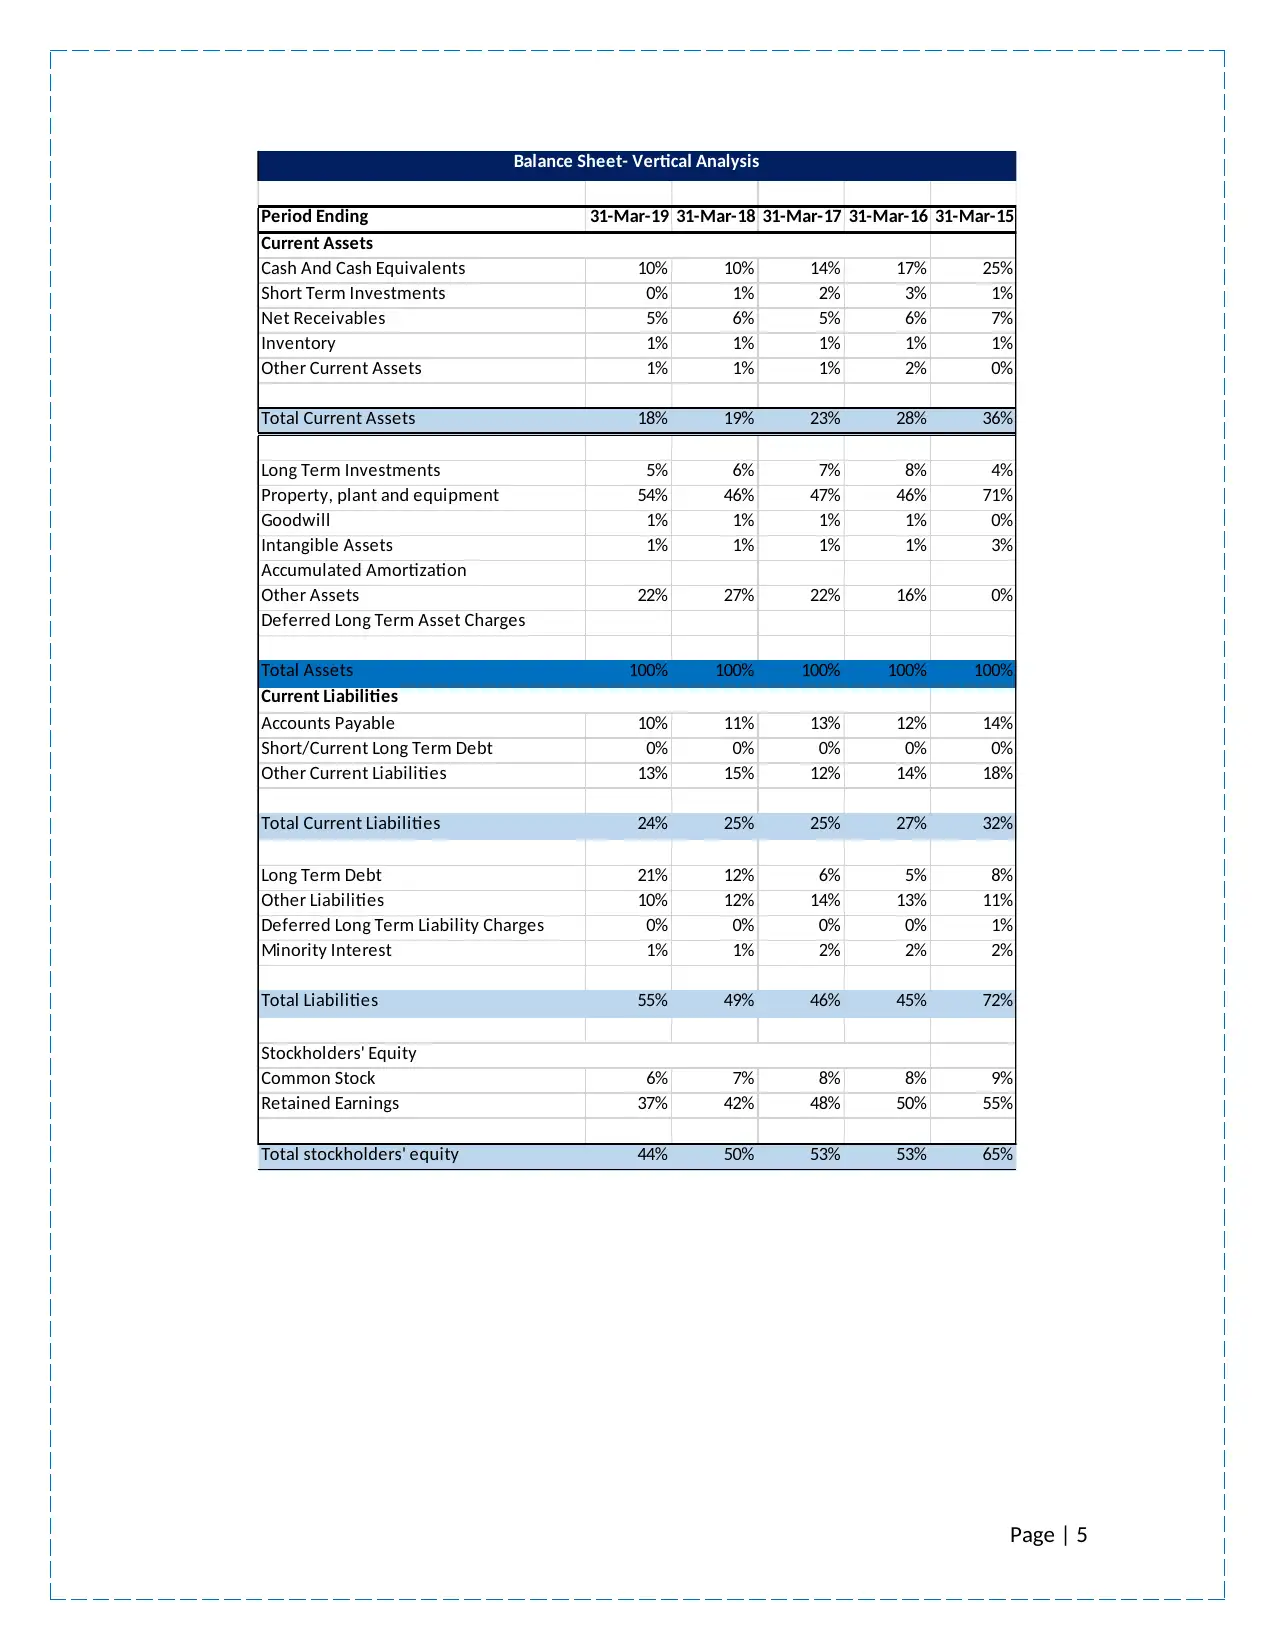
Period Ending 31-Mar-19 31-Mar-18 31-Mar-17 31-Mar-16 31-Mar-15
Cash And Cash Equivalents 10% 10% 14% 17% 25%
Short Term Investments 0% 1% 2% 3% 1%
Net Receivables 5% 6% 5% 6% 7%
Inventory 1% 1% 1% 1% 1%
Other Current Assets 1% 1% 1% 2% 0%
Total Current Assets 18% 19% 23% 28% 36%
Long Term Investments 5% 6% 7% 8% 4%
Property, plant and equipment 54% 46% 47% 46% 71%
Goodwill 1% 1% 1% 1% 0%
Intangible Assets 1% 1% 1% 1% 3%
Accumulated Amortization
Other Assets 22% 27% 22% 16% 0%
Deferred Long Term Asset Charges
Total Assets 100% 100% 100% 100% 100%
Accounts Payable 10% 11% 13% 12% 14%
Short/Current Long Term Debt 0% 0% 0% 0% 0%
Other Current Liabilities 13% 15% 12% 14% 18%
Total Current Liabilities 24% 25% 25% 27% 32%
Long Term Debt 21% 12% 6% 5% 8%
Other Liabilities 10% 12% 14% 13% 11%
Deferred Long Term Liability Charges 0% 0% 0% 0% 1%
Minority Interest 1% 1% 2% 2% 2%
Total Liabilities 55% 49% 46% 45% 72%
Common Stock 6% 7% 8% 8% 9%
Retained Earnings 37% 42% 48% 50% 55%
Total stockholders' equity 44% 50% 53% 53% 65%
Current Assets
Current Liabilities
Stockholders' Equity
Balance Sheet- Vertical Analysis
Page | 4
⊘ This is a preview!⊘
Do you want full access?
Subscribe today to unlock all pages.
Trusted by 1+ million students worldwide
Period Ending 31-Mar-19 31-Mar-18 31-Mar-17 31-Mar-16 31-Mar-15
Cash And Cash Equivalents 10% 10% 14% 17% 25%
Short Term Investments 0% 1% 2% 3% 1%
Net Receivables 5% 6% 5% 6% 7%
Inventory 1% 1% 1% 1% 1%
Other Current Assets 1% 1% 1% 2% 0%
Total Current Assets 18% 19% 23% 28% 36%
Long Term Investments 5% 6% 7% 8% 4%
Property, plant and equipment 54% 46% 47% 46% 71%
Goodwill 1% 1% 1% 1% 0%
Intangible Assets 1% 1% 1% 1% 3%
Accumulated Amortization
Other Assets 22% 27% 22% 16% 0%
Deferred Long Term Asset Charges
Total Assets 100% 100% 100% 100% 100%
Accounts Payable 10% 11% 13% 12% 14%
Short/Current Long Term Debt 0% 0% 0% 0% 0%
Other Current Liabilities 13% 15% 12% 14% 18%
Total Current Liabilities 24% 25% 25% 27% 32%
Long Term Debt 21% 12% 6% 5% 8%
Other Liabilities 10% 12% 14% 13% 11%
Deferred Long Term Liability Charges 0% 0% 0% 0% 1%
Minority Interest 1% 1% 2% 2% 2%
Total Liabilities 55% 49% 46% 45% 72%
Common Stock 6% 7% 8% 8% 9%
Retained Earnings 37% 42% 48% 50% 55%
Total stockholders' equity 44% 50% 53% 53% 65%
Current Assets
Current Liabilities
Stockholders' Equity
Balance Sheet- Vertical Analysis
Page | 5
Paraphrase This Document
Need a fresh take? Get an instant paraphrase of this document with our AI Paraphraser
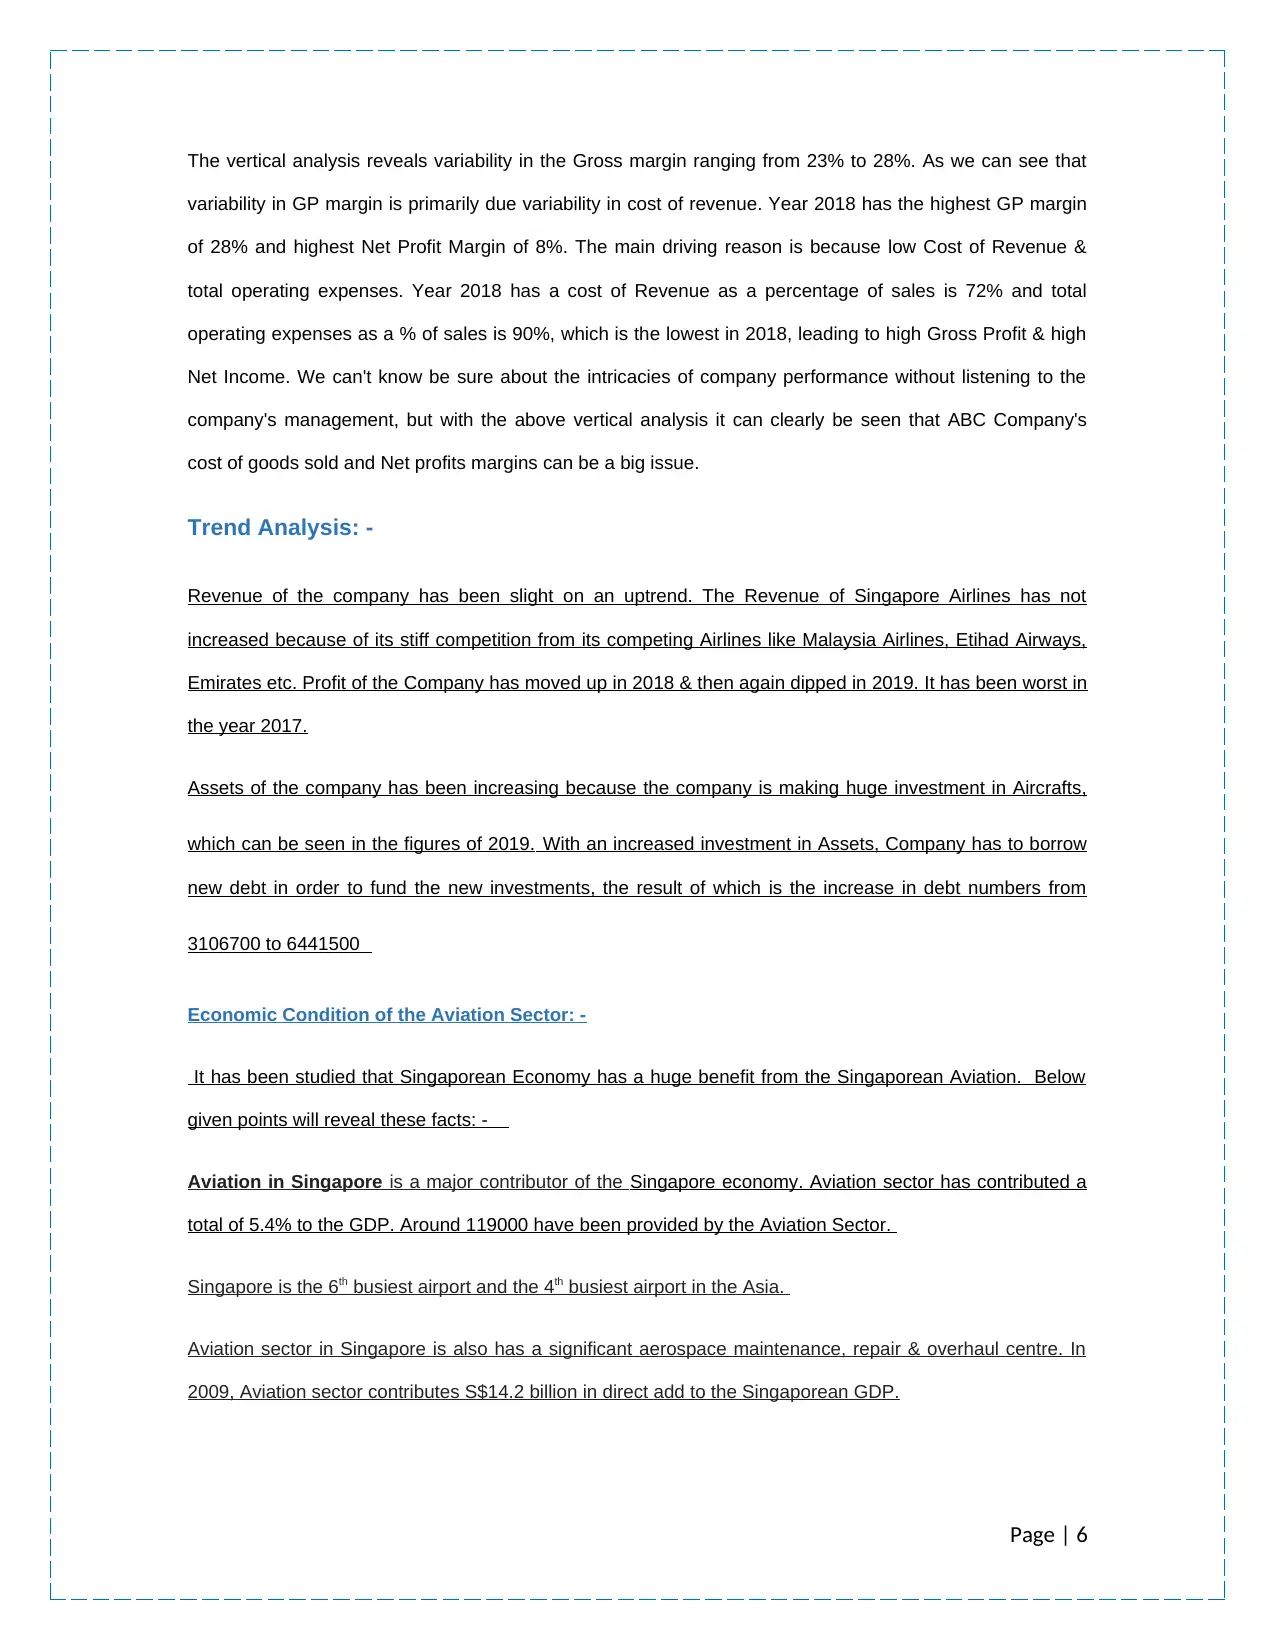
The vertical analysis reveals variability in the Gross margin ranging from 23% to 28%. As we can see that
variability in GP margin is primarily due variability in cost of revenue. Year 2018 has the highest GP margin
of 28% and highest Net Profit Margin of 8%. The main driving reason is because low Cost of Revenue &
total operating expenses. Year 2018 has a cost of Revenue as a percentage of sales is 72% and total
operating expenses as a % of sales is 90%, which is the lowest in 2018, leading to high Gross Profit & high
Net Income. We can't know be sure about the intricacies of company performance without listening to the
company's management, but with the above vertical analysis it can clearly be seen that ABC Company's
cost of goods sold and Net profits margins can be a big issue.
Trend Analysis: -
Revenue of the company has been slight on an uptrend. The Revenue of Singapore Airlines has not
increased because of its stiff competition from its competing Airlines like Malaysia Airlines, Etihad Airways,
Emirates etc. Profit of the Company has moved up in 2018 & then again dipped in 2019. It has been worst in
the year 2017.
Assets of the company has been increasing because the company is making huge investment in Aircrafts,
which can be seen in the figures of 2019. With an increased investment in Assets, Company has to borrow
new debt in order to fund the new investments, the result of which is the increase in debt numbers from
3106700 to 6441500
Economic Condition of the Aviation Sector: -
It has been studied that Singaporean Economy has a huge benefit from the Singaporean Aviation. Below
given points will reveal these facts: -
Aviation in Singapore is a major contributor of the Singapore economy. Aviation sector has contributed a
total of 5.4% to the GDP. Around 119000 have been provided by the Aviation Sector.
Singapore is the 6th busiest airport and the 4th busiest airport in the Asia.
Aviation sector in Singapore is also has a significant aerospace maintenance, repair & overhaul centre. In
2009, Aviation sector contributes S$14.2 billion in direct add to the Singaporean GDP.
Page | 6
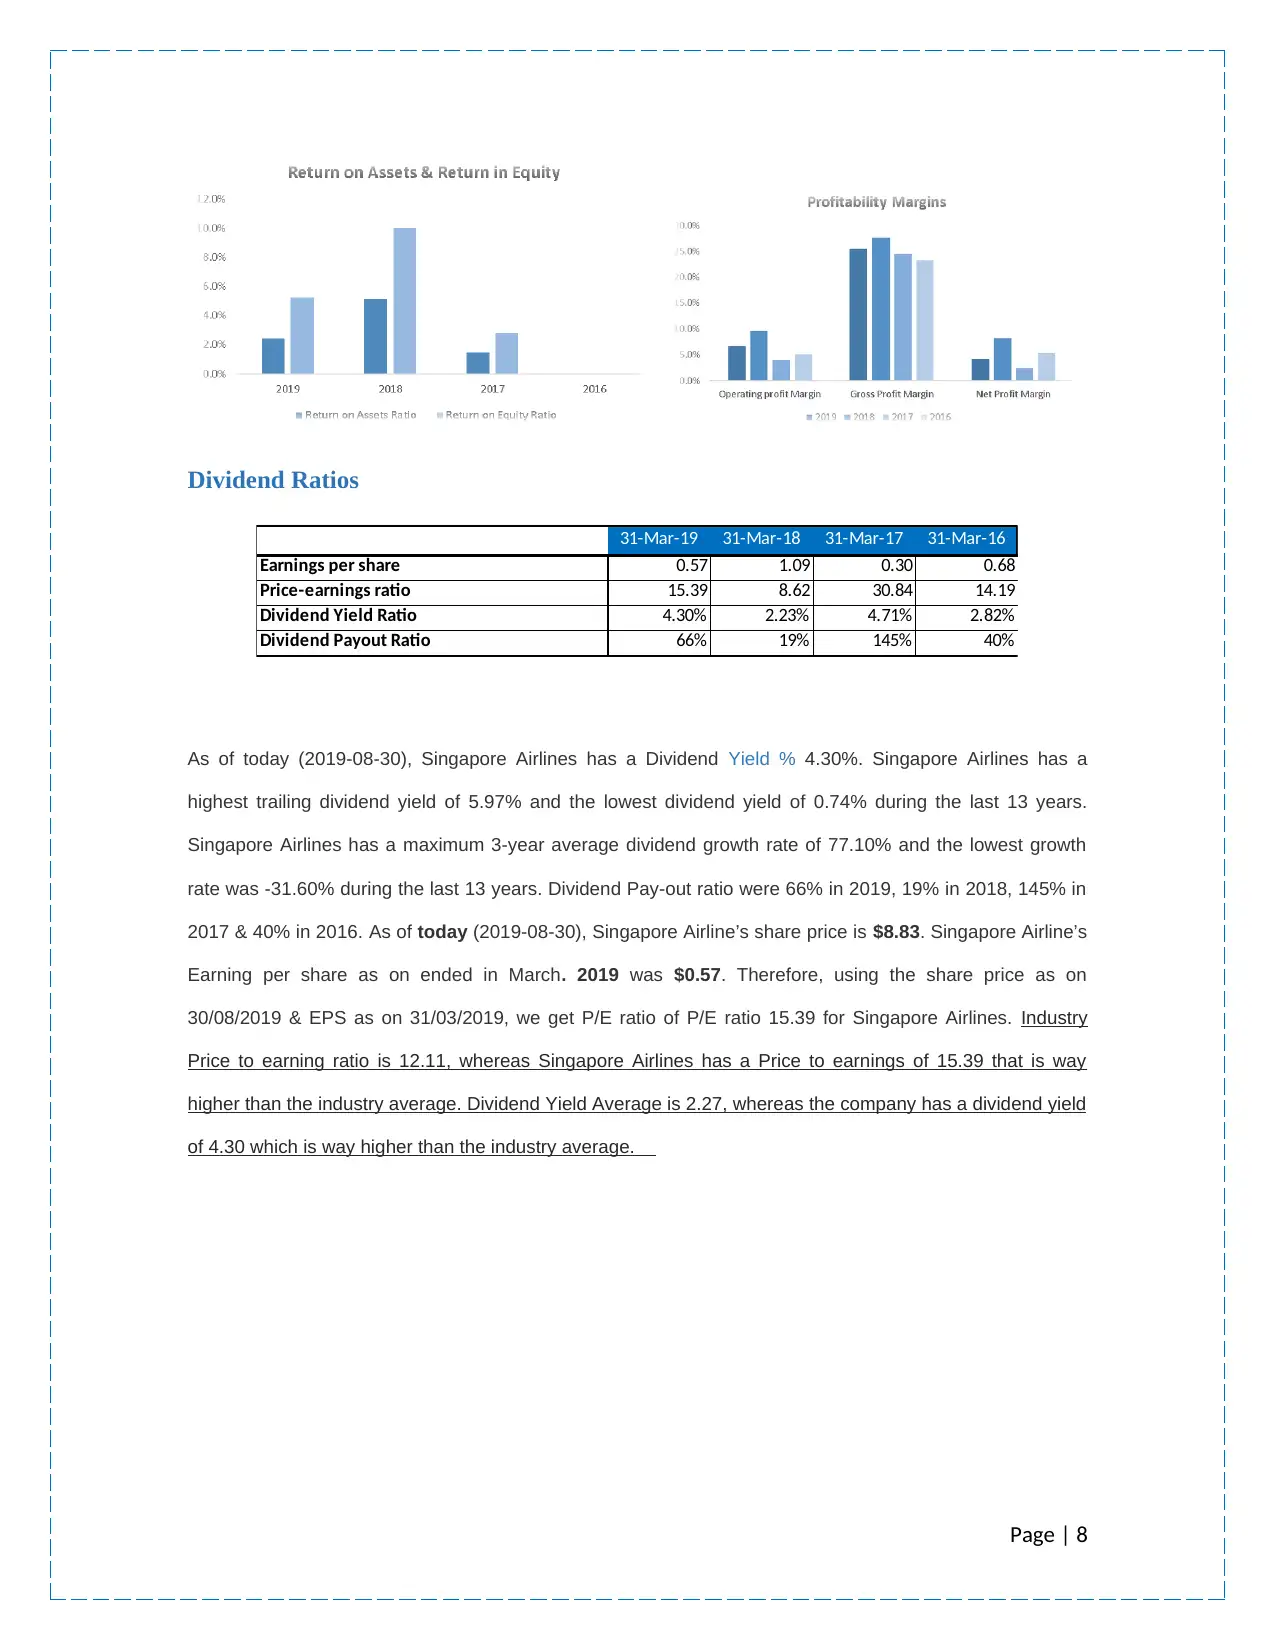
Ratio Analysis
Profitability Ratios
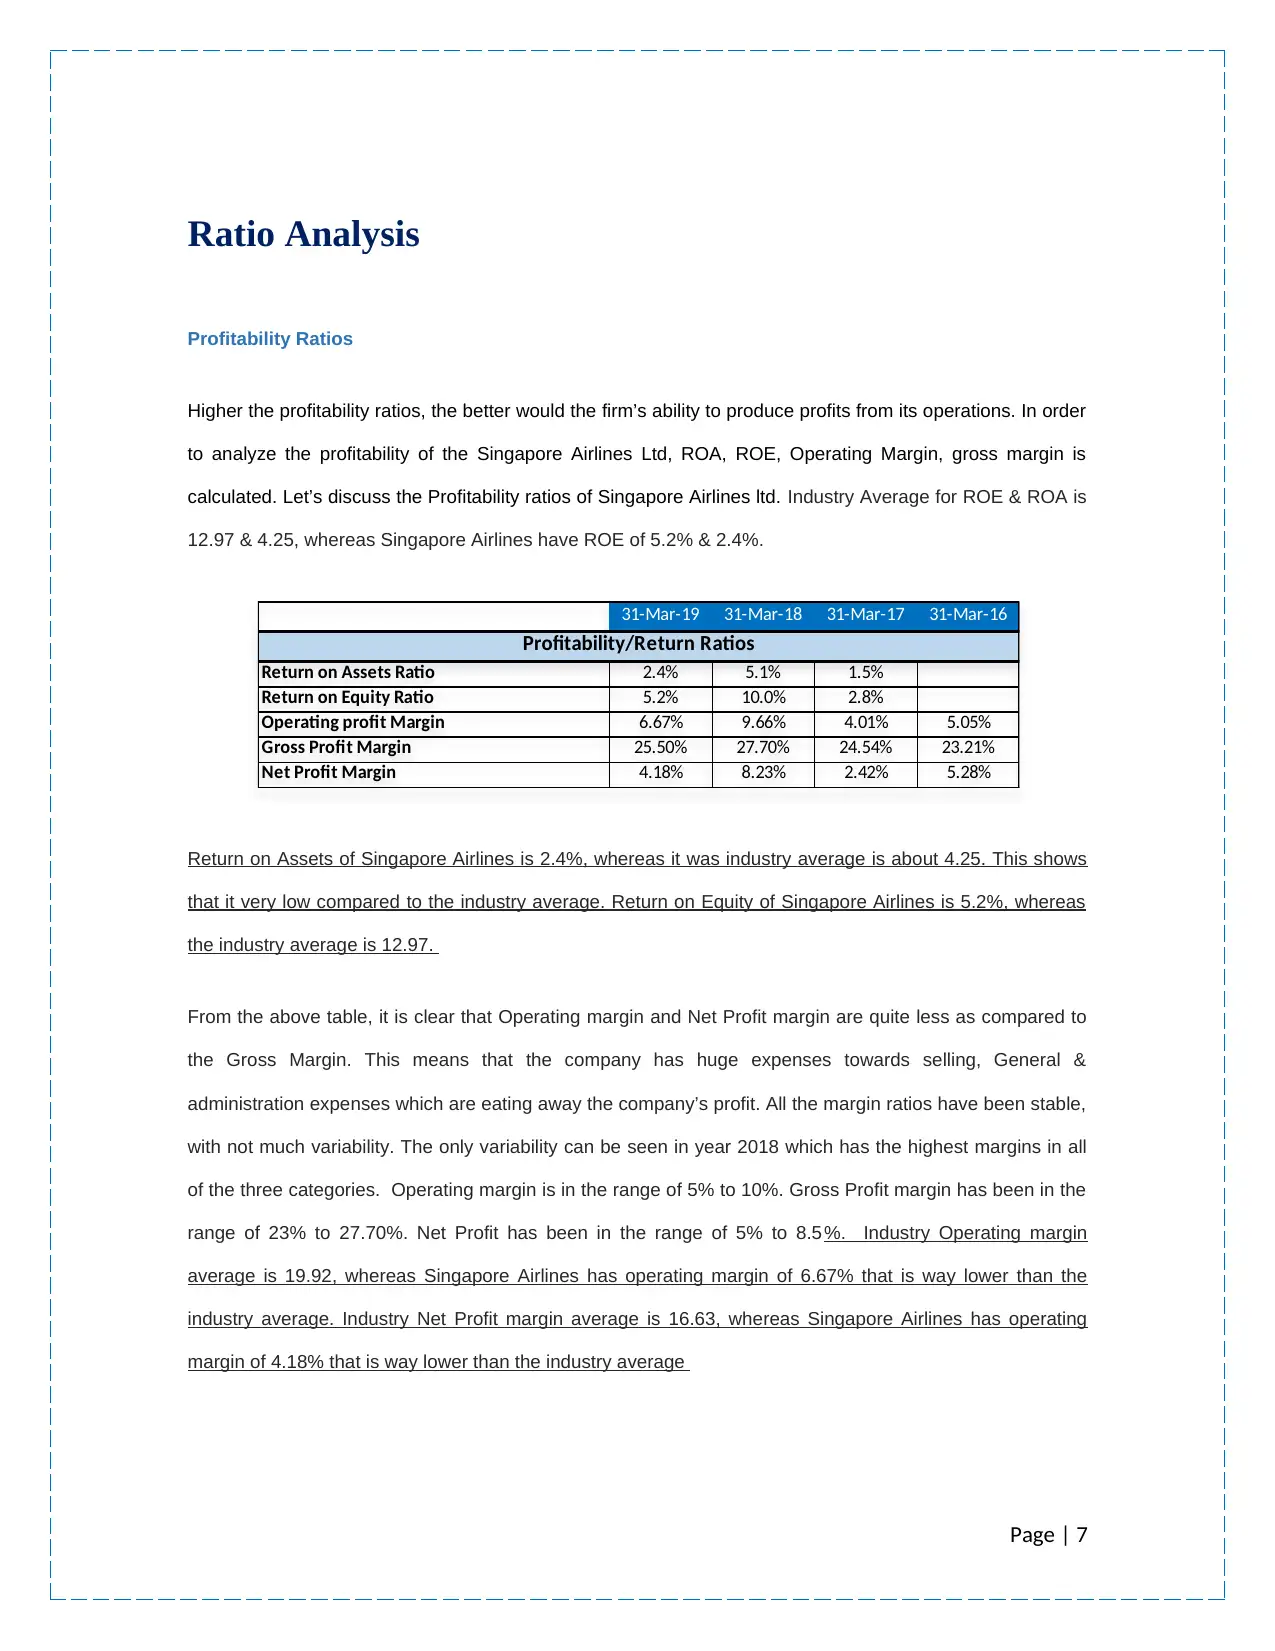
Higher the profitability ratios, the better would the firm’s ability to produce profits from its operations. In order
to analyze the profitability of the Singapore Airlines Ltd, ROA, ROE, Operating Margin, gross margin is
calculated. Let’s discuss the Profitability ratios of Singapore Airlines ltd. Industry Average for ROE & ROA is
12.97 & 4.25, whereas Singapore Airlines have ROE of 5.2% & 2.4%.
Return on Assets of Singapore Airlines is 2.4%, whereas it was industry average is about 4.25. This shows
that it very low compared to the industry average. Return on Equity of Singapore Airlines is 5.2%, whereas
the industry average is 12.97.
From the above table, it is clear that Operating margin and Net Profit margin are quite less as compared to
the Gross Margin. This means that the company has huge expenses towards selling, General &
administration expenses which are eating away the company’s profit. All the margin ratios have been stable,
with not much variability. The only variability can be seen in year 2018 which has the highest margins in all
of the three categories. Operating margin is in the range of 5% to 10%. Gross Profit margin has been in the
range of 23% to 27.70%. Net Profit has been in the range of 5% to 8.5 %. Industry Operating margin
average is 19.92, whereas Singapore Airlines has operating margin of 6.67% that is way lower than the
industry average. Industry Net Profit margin average is 16.63, whereas Singapore Airlines has operating
margin of 4.18% that is way lower than the industry average
Page | 7
31-Mar-19 31-Mar-18 31-Mar-17 31-Mar-16
Return on Assets Ratio 2.4% 5.1% 1.5%
Return on Equity Ratio 5.2% 10.0% 2.8%
Operating profit Margin 6.67% 9.66% 4.01% 5.05%
Gross Profit Margin 25.50% 27.70% 24.54% 23.21%
Net Profit Margin 4.18% 8.23% 2.42% 5.28%
Profitability/Return Ratios
Profitability Ratios
Higher the profitability ratios, the better would the firm’s ability to produce profits from its operations. In order
to analyze the profitability of the Singapore Airlines Ltd, ROA, ROE, Operating Margin, gross margin is
calculated. Let’s discuss the Profitability ratios of Singapore Airlines ltd. Industry Average for ROE & ROA is
12.97 & 4.25, whereas Singapore Airlines have ROE of 5.2% & 2.4%.
Return on Assets of Singapore Airlines is 2.4%, whereas it was industry average is about 4.25. This shows
that it very low compared to the industry average. Return on Equity of Singapore Airlines is 5.2%, whereas
the industry average is 12.97.
From the above table, it is clear that Operating margin and Net Profit margin are quite less as compared to
the Gross Margin. This means that the company has huge expenses towards selling, General &
administration expenses which are eating away the company’s profit. All the margin ratios have been stable,
with not much variability. The only variability can be seen in year 2018 which has the highest margins in all
of the three categories. Operating margin is in the range of 5% to 10%. Gross Profit margin has been in the
range of 23% to 27.70%. Net Profit has been in the range of 5% to 8.5 %. Industry Operating margin
average is 19.92, whereas Singapore Airlines has operating margin of 6.67% that is way lower than the
industry average. Industry Net Profit margin average is 16.63, whereas Singapore Airlines has operating
margin of 4.18% that is way lower than the industry average
Page | 7
31-Mar-19 31-Mar-18 31-Mar-17 31-Mar-16
Return on Assets Ratio 2.4% 5.1% 1.5%
Return on Equity Ratio 5.2% 10.0% 2.8%
Operating profit Margin 6.67% 9.66% 4.01% 5.05%
Gross Profit Margin 25.50% 27.70% 24.54% 23.21%
Net Profit Margin 4.18% 8.23% 2.42% 5.28%
Profitability/Return Ratios
⊘ This is a preview!⊘
Do you want full access?
Subscribe today to unlock all pages.
Trusted by 1+ million students worldwide
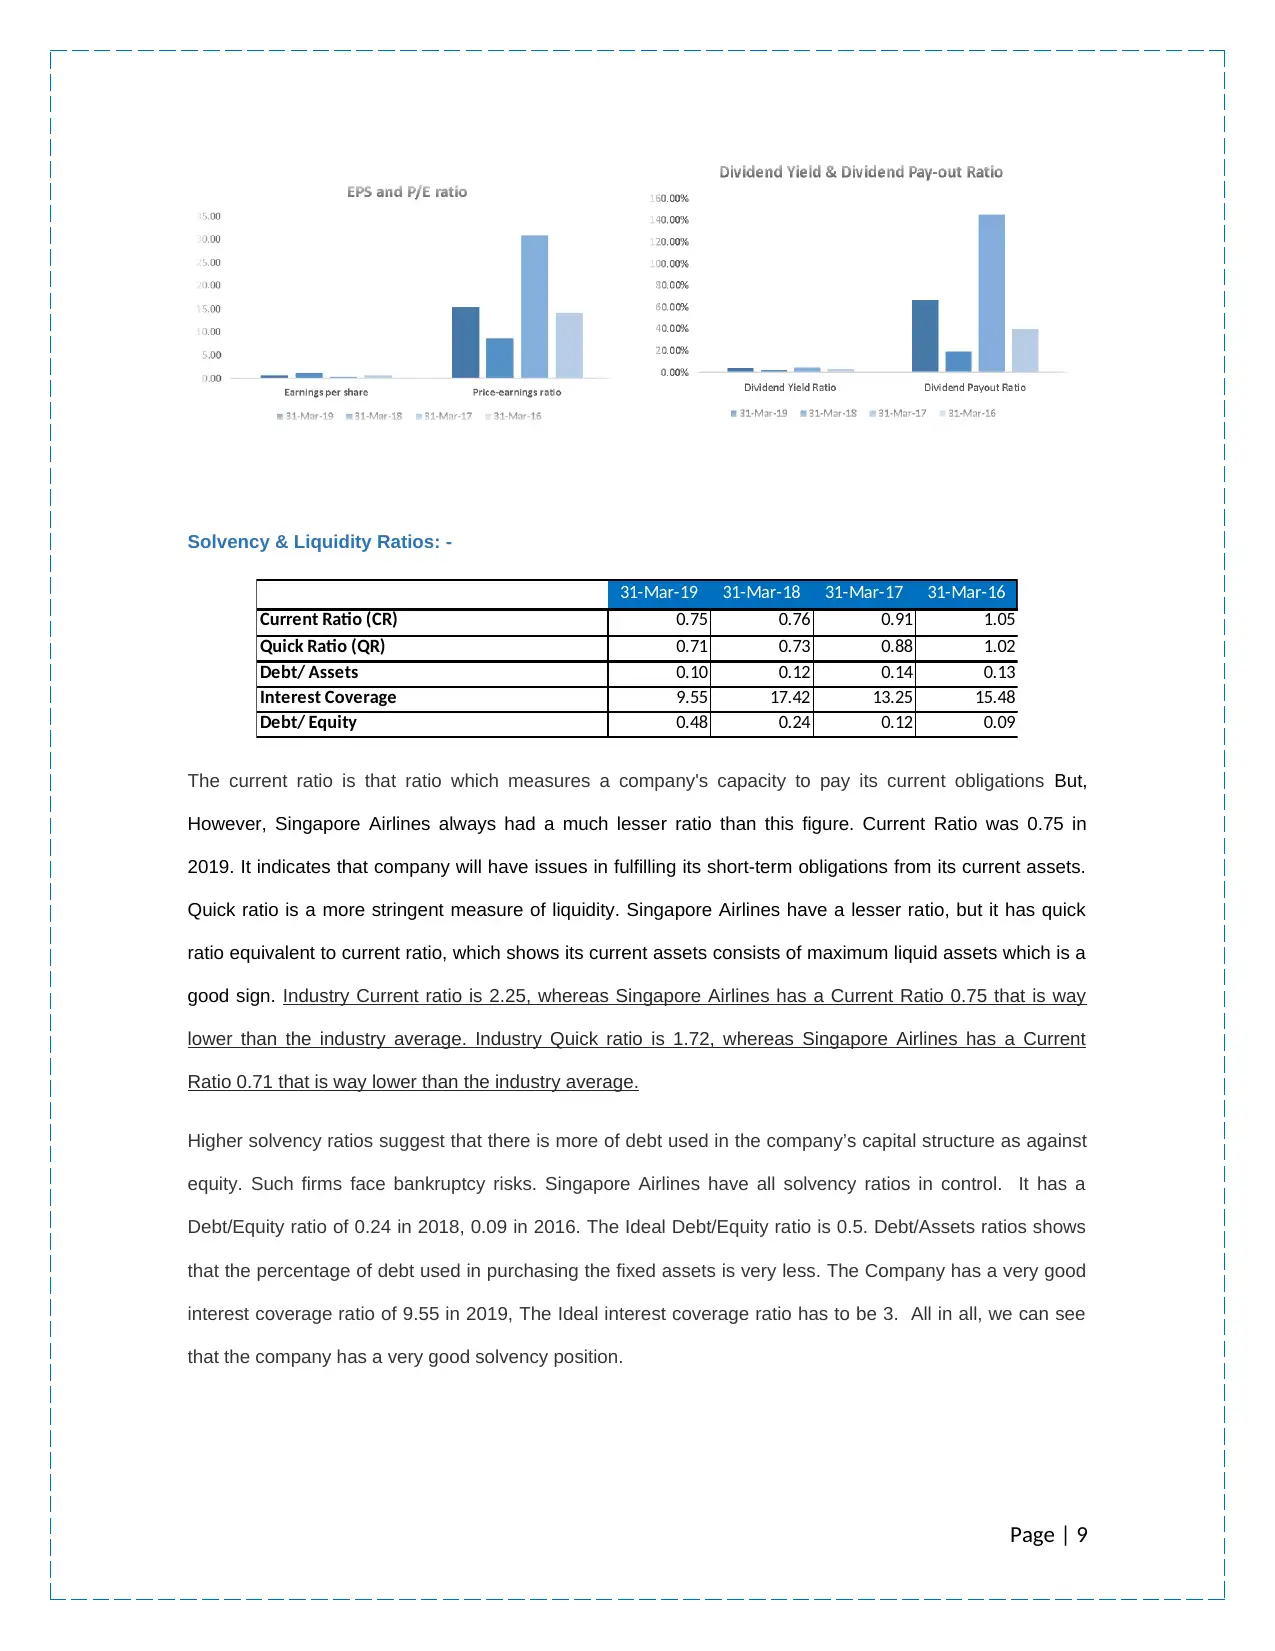
Dividend Ratios
31-Mar-19 31-Mar-18 31-Mar-17 31-Mar-16
Earnings per share 0.57 1.09 0.30 0.68
Price-earnings ratio 15.39 8.62 30.84 14.19
Dividend Yield Ratio 4.30% 2.23% 4.71% 2.82%
Dividend Payout Ratio 66% 19% 145% 40%
As of today (2019-08-30), Singapore Airlines has a Dividend Yield % 4.30%. Singapore Airlines has a
highest trailing dividend yield of 5.97% and the lowest dividend yield of 0.74% during the last 13 years.
Singapore Airlines has a maximum 3-year average dividend growth rate of 77.10% and the lowest growth
rate was -31.60% during the last 13 years. Dividend Pay-out ratio were 66% in 2019, 19% in 2018, 145% in
2017 & 40% in 2016. As of today (2019-08-30), Singapore Airline’s share price is $8.83. Singapore Airline’s
Earning per share as on ended in March. 2019 was $0.57. Therefore, using the share price as on
30/08/2019 & EPS as on 31/03/2019, we get P/E ratio of P/E ratio 15.39 for Singapore Airlines. Industry
Price to earning ratio is 12.11, whereas Singapore Airlines has a Price to earnings of 15.39 that is way
higher than the industry average. Dividend Yield Average is 2.27, whereas the company has a dividend yield
of 4.30 which is way higher than the industry average.
Page | 8
Paraphrase This Document
Need a fresh take? Get an instant paraphrase of this document with our AI Paraphraser
Solvency & Liquidity Ratios: -
31-Mar-19 31-Mar-18 31-Mar-17 31-Mar-16
Current Ratio (CR) 0.75 0.76 0.91 1.05
Quick Ratio (QR) 0.71 0.73 0.88 1.02
Debt/ Assets 0.10 0.12 0.14 0.13
Interest Coverage 9.55 17.42 13.25 15.48
Debt/ Equity 0.48 0.24 0.12 0.09
The current ratio is that ratio which measures a company's capacity to pay its current obligations But,
However, Singapore Airlines always had a much lesser ratio than this figure. Current Ratio was 0.75 in
2019. It indicates that company will have issues in fulfilling its short-term obligations from its current assets.
Quick ratio is a more stringent measure of liquidity. Singapore Airlines have a lesser ratio, but it has quick
ratio equivalent to current ratio, which shows its current assets consists of maximum liquid assets which is a
good sign. Industry Current ratio is 2.25, whereas Singapore Airlines has a Current Ratio 0.75 that is way
lower than the industry average. Industry Quick ratio is 1.72, whereas Singapore Airlines has a Current
Ratio 0.71 that is way lower than the industry average.
Higher solvency ratios suggest that there is more of debt used in the company’s capital structure as against
equity. Such firms face bankruptcy risks. Singapore Airlines have all solvency ratios in control. It has a
Debt/Equity ratio of 0.24 in 2018, 0.09 in 2016. The Ideal Debt/Equity ratio is 0.5. Debt/Assets ratios shows
that the percentage of debt used in purchasing the fixed assets is very less. The Company has a very good
interest coverage ratio of 9.55 in 2019, The Ideal interest coverage ratio has to be 3. All in all, we can see
that the company has a very good solvency position.
Page | 9
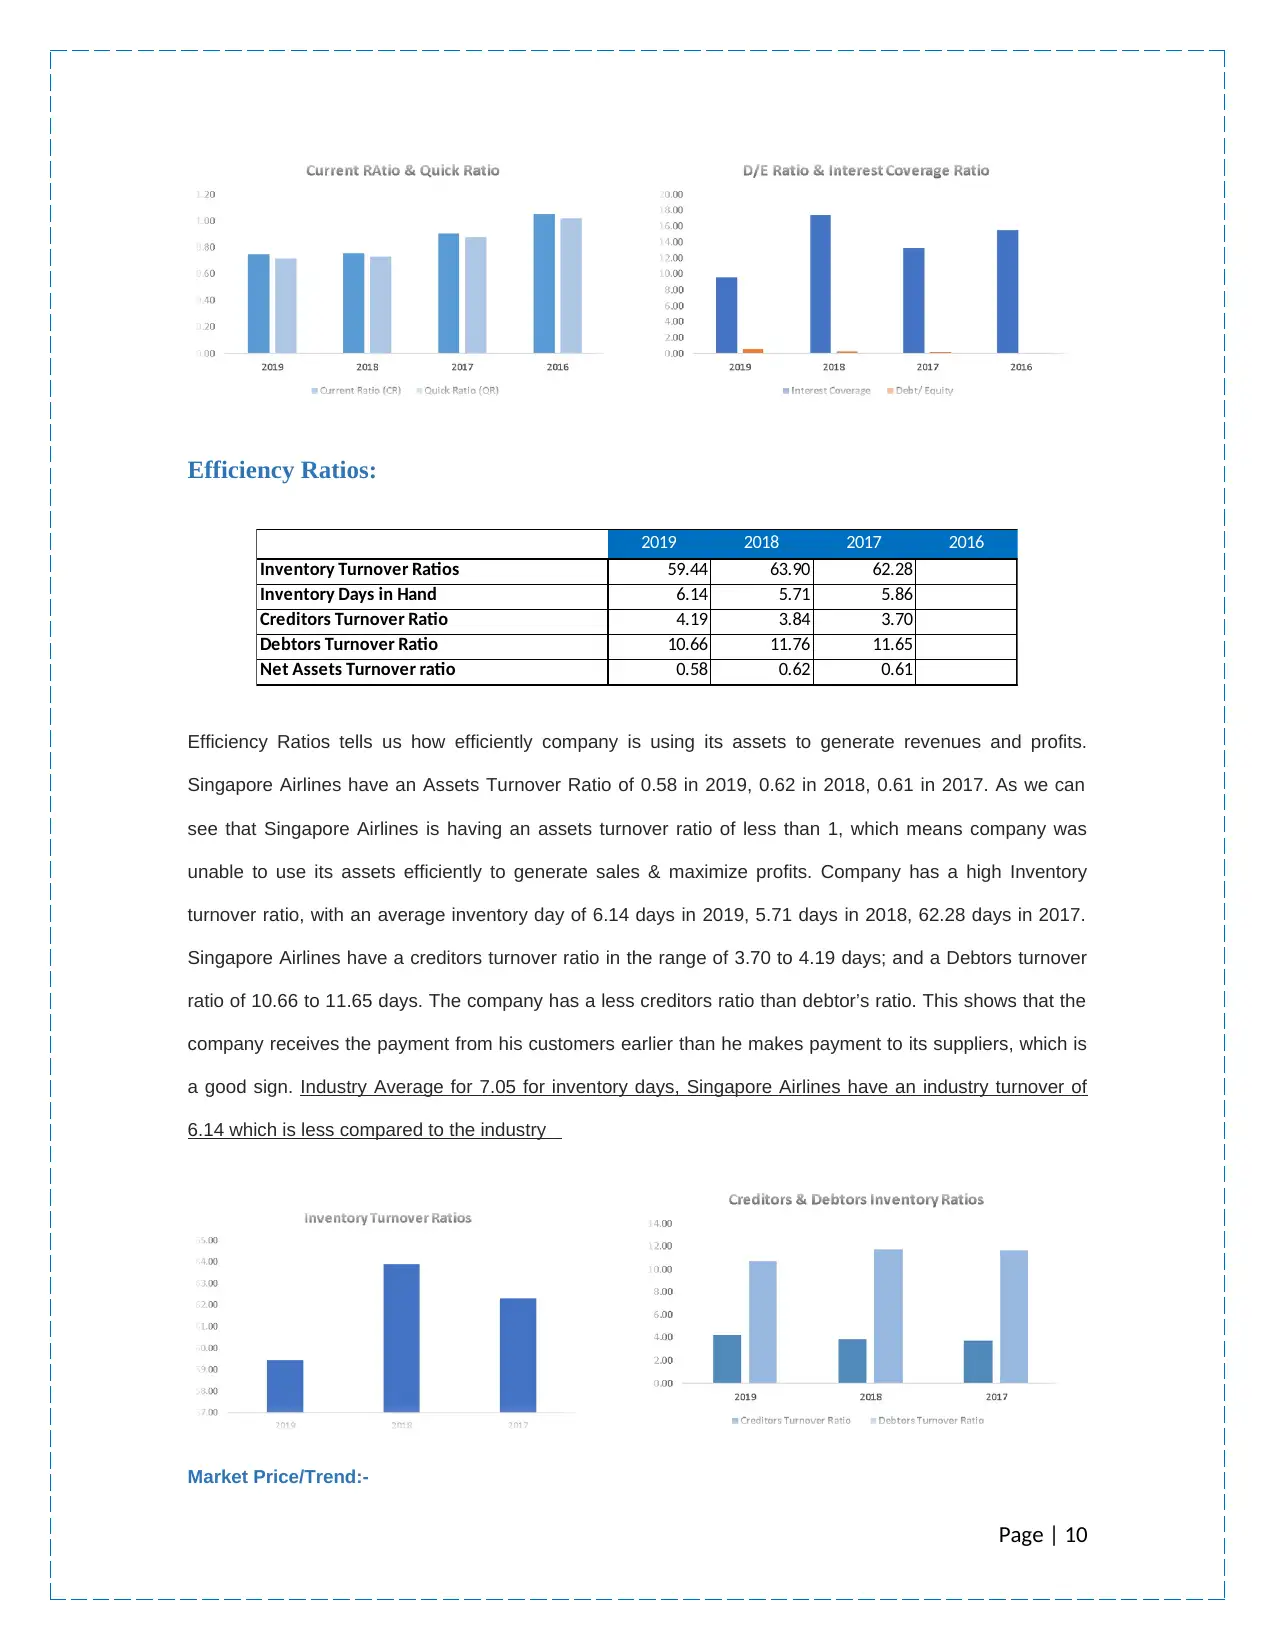
Efficiency Ratios:
2019 2018 2017 2016
Inventory Turnover Ratios 59.44 63.90 62.28
Inventory Days in Hand 6.14 5.71 5.86
Creditors Turnover Ratio 4.19 3.84 3.70
Debtors Turnover Ratio 10.66 11.76 11.65
Net Assets Turnover ratio 0.58 0.62 0.61
Efficiency Ratios tells us how efficiently company is using its assets to generate revenues and profits.
Singapore Airlines have an Assets Turnover Ratio of 0.58 in 2019, 0.62 in 2018, 0.61 in 2017. As we can
see that Singapore Airlines is having an assets turnover ratio of less than 1, which means company was
unable to use its assets efficiently to generate sales & maximize profits. Company has a high Inventory
turnover ratio, with an average inventory day of 6.14 days in 2019, 5.71 days in 2018, 62.28 days in 2017.
Singapore Airlines have a creditors turnover ratio in the range of 3.70 to 4.19 days; and a Debtors turnover
ratio of 10.66 to 11.65 days. The company has a less creditors ratio than debtor’s ratio. This shows that the
company receives the payment from his customers earlier than he makes payment to its suppliers, which is
a good sign. Industry Average for 7.05 for inventory days, Singapore Airlines have an industry turnover of
6.14 which is less compared to the industry
Market Price/Trend:-
Page | 10
⊘ This is a preview!⊘
Do you want full access?
Subscribe today to unlock all pages.
Trusted by 1+ million students worldwide
1 out of 20
Related Documents


Your All-in-One AI-Powered Toolkit for Academic Success.
+13062052269
info@desklib.com
Available 24*7 on WhatsApp / Email
![[object Object]](/_next/static/media/star-bottom.7253800d.svg)
Unlock your academic potential
Copyright © 2020–2026 A2Z Services. All Rights Reserved. Developed and managed by ZUCOL.