Comprehensive Financial Analysis Report: Simon Company

Verified

Added on  2022/12/22

|8
|1728
|56
Report
AI Summary
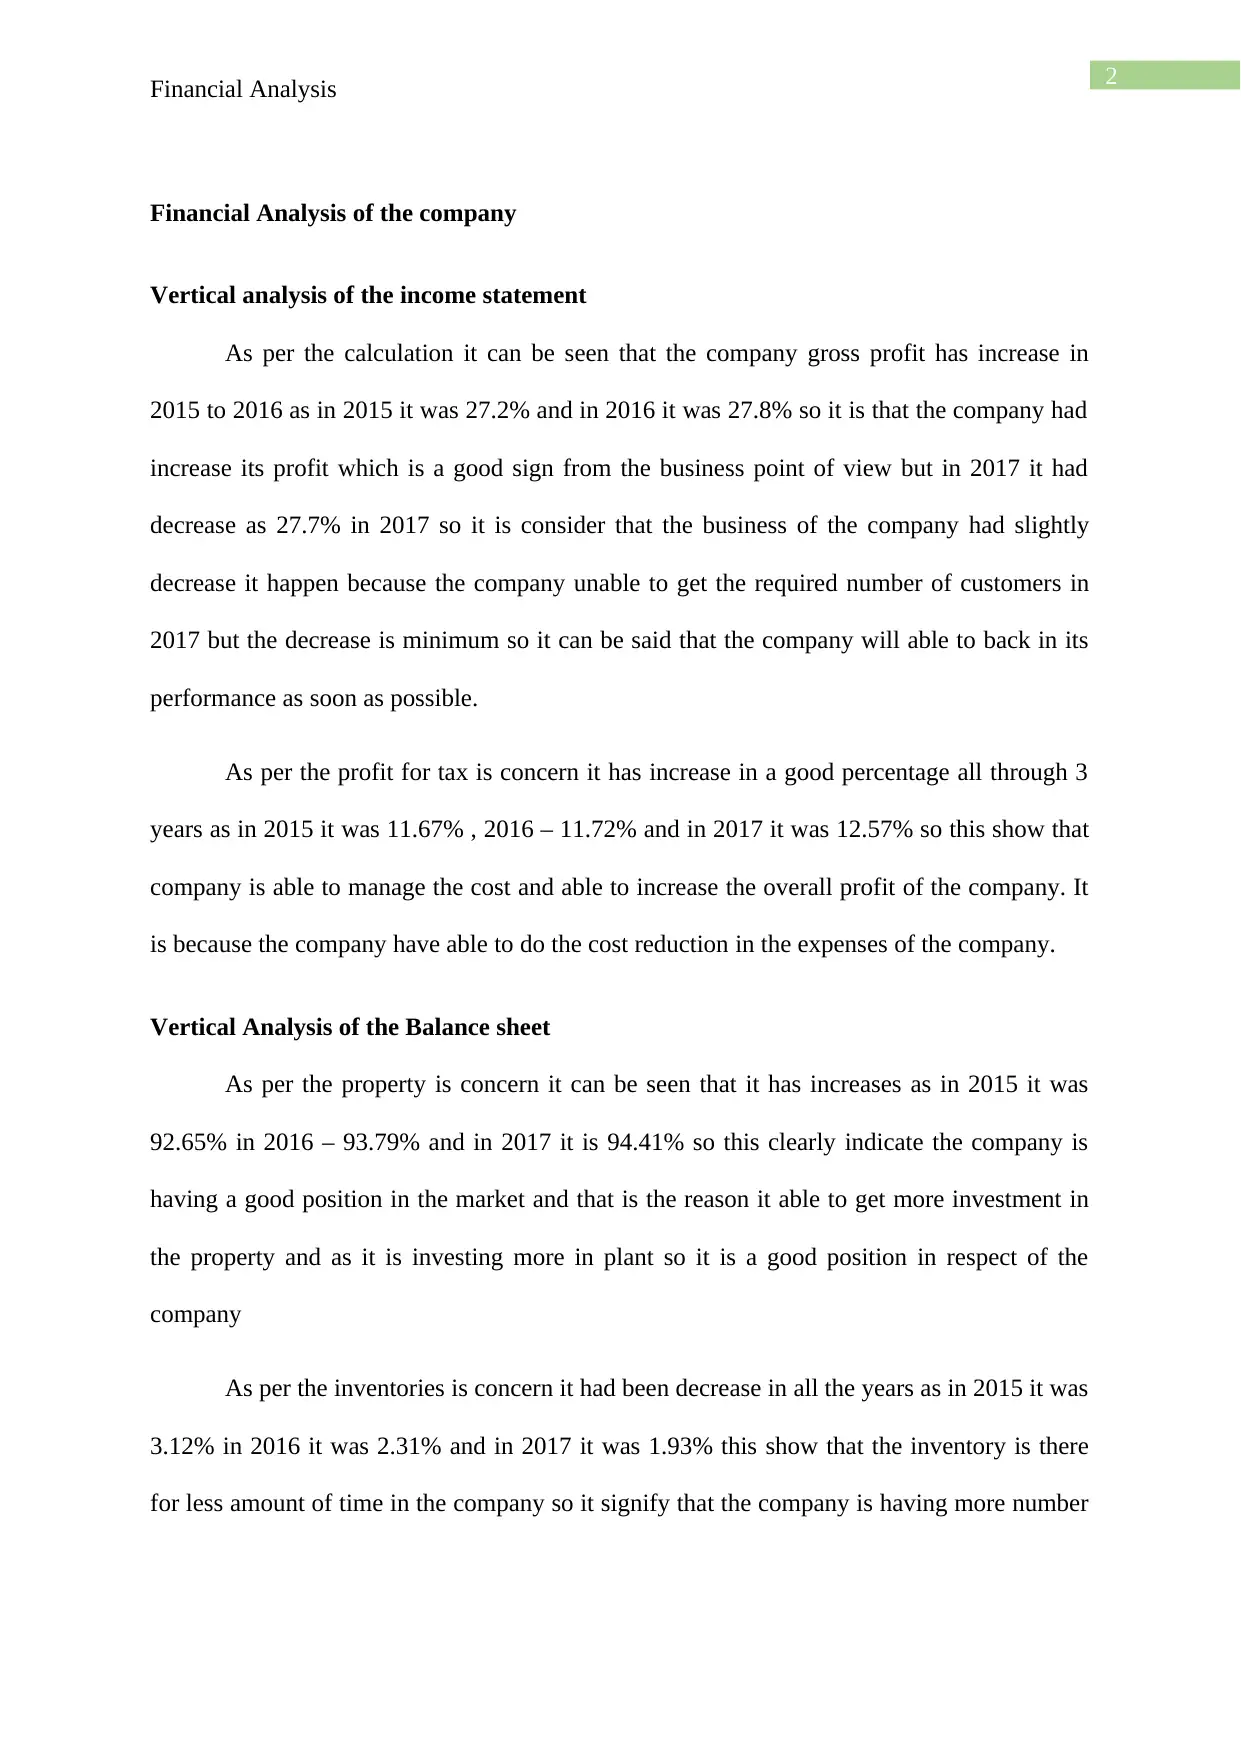
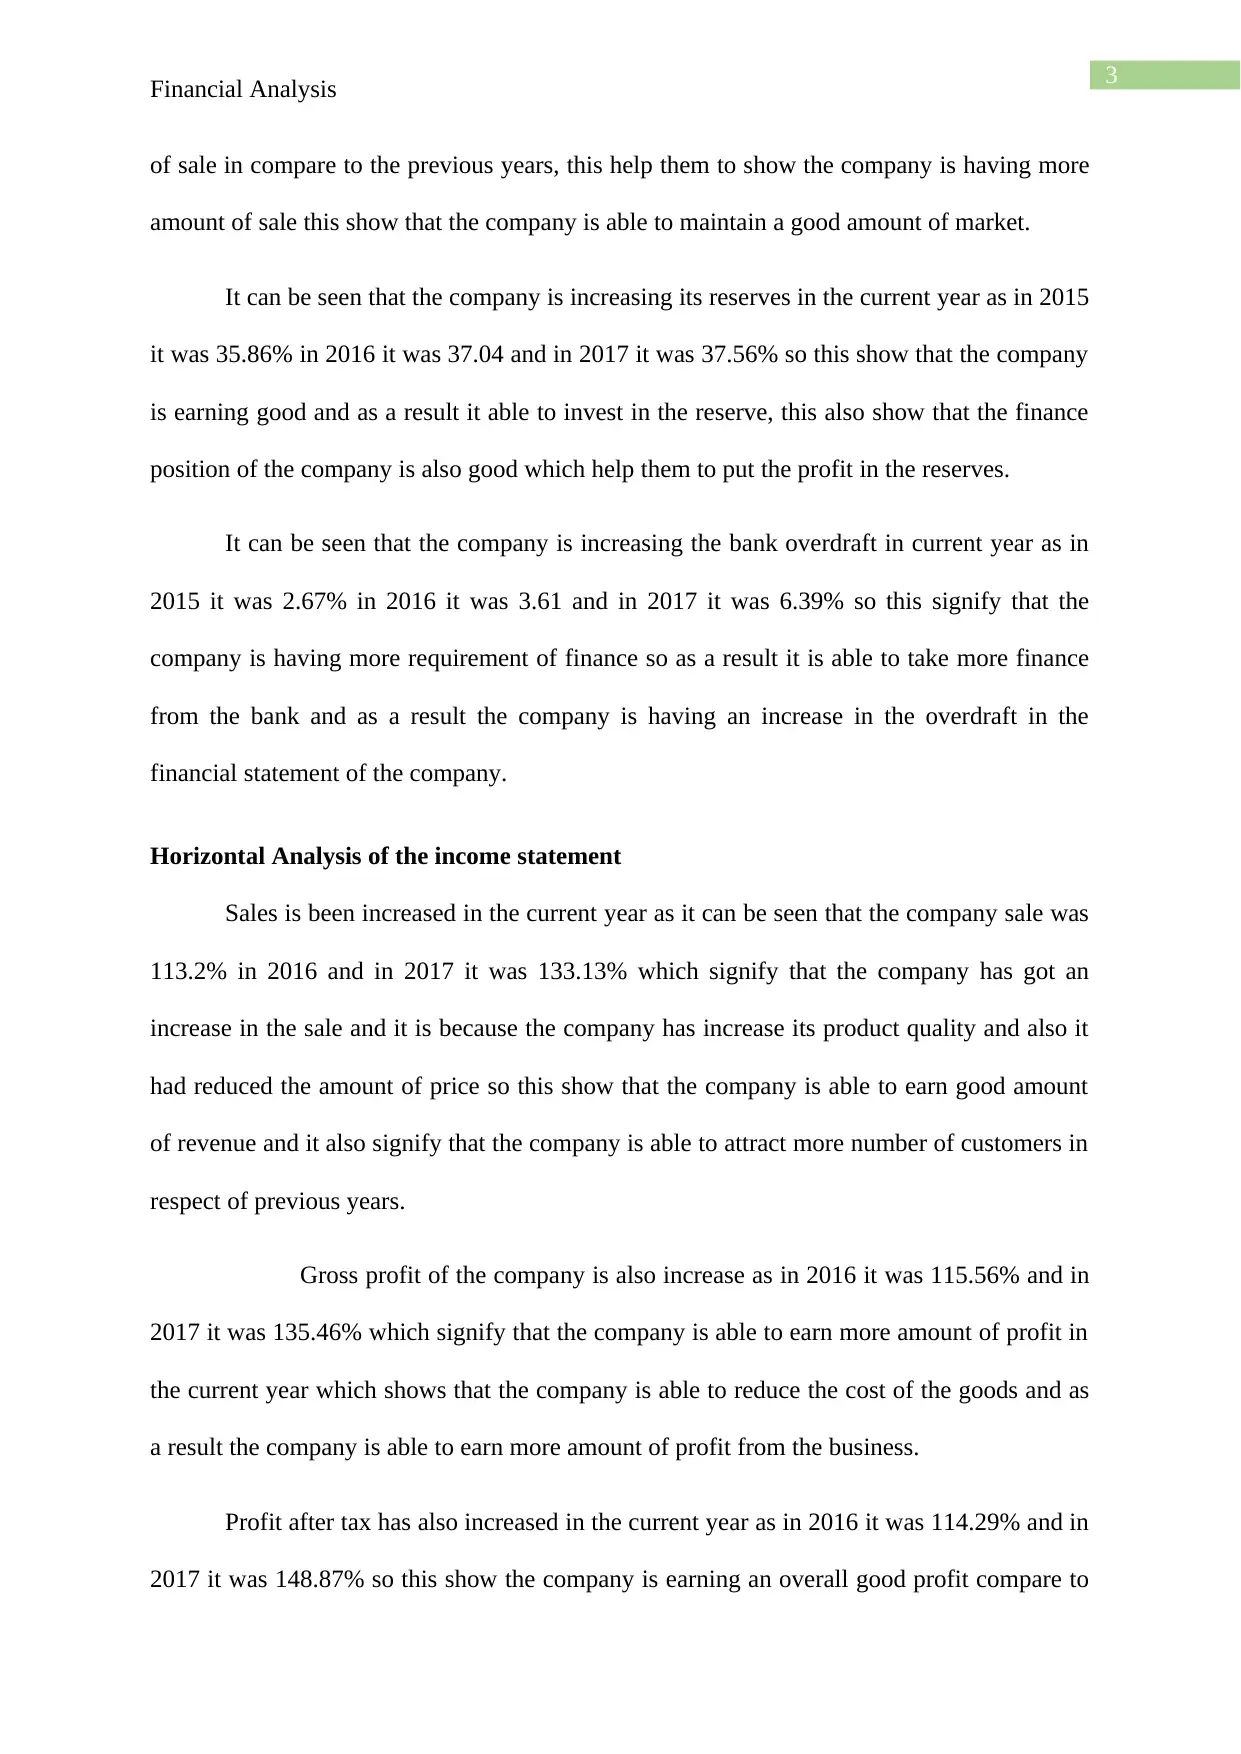
This report provides a financial analysis of Simon Company, examining its performance from 2015 to 2017. The analysis includes vertical and horizontal analyses of the income statement and balance sheet, along with ratio analysis to assess liquidity, efficiency, and gearing. The report highlights key trends, such as increasing sales, gross profit, and profit after tax, indicating strong financial health and effective cost management. It also notes a decrease in liquid ratios and provides insights into working capital management and debt levels. Based on the analysis, the report recommends that Simon Company should consider diversifying its product offerings and maintain its focus on all three product lines (bulbs, switches, and consumer electronics) to maximize profitability and market share, while also improving its liquidity position. The analysis is based on the financial statements provided, with a focus on key performance indicators and financial ratios.
Document Page
Running head: Financial Analysis
Financial Analysis
Name of the Student
Name of the University
Author Note
tabler-icon-diamond-filled.svg

Paraphrase This Document

Need a fresh take? Get an instant paraphrase of this document with our AI Paraphraser
Document Page
1
Financial Analysis
Table of Contents
Vertical analysis of the income statement..................................................................................2
Vertical Analysis of the Balance sheet.......................................................................................2
Horizontal Analysis of the income statement............................................................................3
Horizontal Analysis of the Balance sheet..................................................................................4
Ratio Analysis of the company..................................................................................................4
\Overall View of the Analysis....................................................................................................5
Document Page
2
Financial Analysis
Financial Analysis of the company
Vertical analysis of the income statement
As per the calculation it can be seen that the company gross profit has increase in
2015 to 2016 as in 2015 it was 27.2% and in 2016 it was 27.8% so it is that the company had
increase its profit which is a good sign from the business point of view but in 2017 it had
decrease as 27.7% in 2017 so it is consider that the business of the company had slightly
decrease it happen because the company unable to get the required number of customers in
2017 but the decrease is minimum so it can be said that the company will able to back in its
performance as soon as possible.
As per the profit for tax is concern it has increase in a good percentage all through 3
years as in 2015 it was 11.67% , 2016 – 11.72% and in 2017 it was 12.57% so this show that
company is able to manage the cost and able to increase the overall profit of the company. It
is because the company have able to do the cost reduction in the expenses of the company.
Vertical Analysis of the Balance sheet
As per the property is concern it can be seen that it has increases as in 2015 it was
92.65% in 2016 – 93.79% and in 2017 it is 94.41% so this clearly indicate the company is
having a good position in the market and that is the reason it able to get more investment in
the property and as it is investing more in plant so it is a good position in respect of the
company
As per the inventories is concern it had been decrease in all the years as in 2015 it was
3.12% in 2016 it was 2.31% and in 2017 it was 1.93% this show that the inventory is there
for less amount of time in the company so it signify that the company is having more number
Document Page
3
Financial Analysis
of sale in compare to the previous years, this help them to show the company is having more
amount of sale this show that the company is able to maintain a good amount of market.
It can be seen that the company is increasing its reserves in the current year as in 2015
it was 35.86% in 2016 it was 37.04 and in 2017 it was 37.56% so this show that the company
is earning good and as a result it able to invest in the reserve, this also show that the finance
position of the company is also good which help them to put the profit in the reserves.
It can be seen that the company is increasing the bank overdraft in current year as in
2015 it was 2.67% in 2016 it was 3.61 and in 2017 it was 6.39% so this signify that the
company is having more requirement of finance so as a result it is able to take more finance
from the bank and as a result the company is having an increase in the overdraft in the
financial statement of the company.
Horizontal Analysis of the income statement
Sales is been increased in the current year as it can be seen that the company sale was
113.2% in 2016 and in 2017 it was 133.13% which signify that the company has got an
increase in the sale and it is because the company has increase its product quality and also it
had reduced the amount of price so this show that the company is able to earn good amount
of revenue and it also signify that the company is able to attract more number of customers in
respect of previous years.
Gross profit of the company is also increase as in 2016 it was 115.56% and in
2017 it was 135.46% which signify that the company is able to earn more amount of profit in
the current year which shows that the company is able to reduce the cost of the goods and as
a result the company is able to earn more amount of profit from the business.
Profit after tax has also increased in the current year as in 2016 it was 114.29% and in
2017 it was 148.87% so this show the company is earning an overall good profit compare to
tabler-icon-diamond-filled.svg

Paraphrase This Document

Need a fresh take? Get an instant paraphrase of this document with our AI Paraphraser
Document Page
4
Financial Analysis
the previous year this also signify that the company is able to save its cost in the operation
and selling expense and as a result it will able to earn more amount of profit and as the
company is earning good so this show that the financial position of the company is very
good.
Horizontal Analysis of the Balance sheet
Property and plant is also increase in the current year it can be seen that in 2016 it was
107.5% and in 2017 it was 117.84% so this can be seen that the increase is having good
finance position this also signify that the company is earning good and to expand the business
they have invested in the property and plant so that it can use the money to increase the
amount of plant in the financial statements
Cash is also increase in the current year it can see that in 2016 it was 120% and in
2017 it was 133.33% so this show the company have increase the cash balance this show that
the company is having good liquid position and can easily pay off the liability in the
company. This also show the financial position is very good and it can easily pay off the short
term debt.
Total asset is also increase in the current year it can be seen that in 2016 it was
106.19% and in 2017 it was 115.63 so this signify that the asset have been increase in the
current year it show that the company is having a good amount of cash and in return of that it
able to increase the amount of total asset so this show that the company is having a good
financial position and having is able to get more number of business in the market.
Ratio Analysis of the company
The liquid ratio has been decrease in the current year as it can be seen that the
quick and current ratio of the company is decrease as the current ratio of the company was in
2015 as 1.57 and in 2016 is 1.17 and in 2017 it was 0.66 so this signify that the company is
Document Page
5
Financial Analysis
not able to maintain a good ratio which show that the company is unable to gather fund in
respect of the short term debt and is unable to manage its liability payoff so this show that
there is lack of liquidity in the financial statement of the company.
As per the efficiency is been consider the company is good as the receivable
collection period is decreasing year to year this show that the company is increasing its
working capital cycle as in 2015 it was 20 days in 2016 it was 17 days and in 2017 it was 14
days so this show that the company have made more strict in regards with the debtor which
show that the company want to have more rotation of their money and it will help to increase
the overall sale of the company.
The gearing ratio of the company is also good as it has not been much change in the
ratio as in 2015 it was 43.69% in 2016 it was 43.18% and in 2017 it was 42.13% this show
the company is paying its debt and is able to save also the interest which is there with the
debt so this is the good sign that the company is having and it show that the company have
good financial position so it can easily pay the debt this also show that the company is having
good amount capital and it does not have much amount of debt in the financial statements.
\Overall View of the Analysis
It can be seen from the above that the company is having a good performance in
respect of previous year so they should do the same and it can also be said that the company
is having not much good liquid position so they should increase the liquidity in the asset so
that they can easily pay off the short term liability. It is also seen that the company is having a
good gearing ratio which show that the company is able to pay of its debt and it able to
increase the equity of the company.
Recommendation
Document Page
6
Financial Analysis
So it can be seen that the company is gaining a huge sale in regard with the sale of
consumer electrical equipment but is should not stop or cut off the sale of the bulb and
switches as there sale is also increase so it can be seen that consumer are demanding the bulb
and switchs also so it should start its market for all the three items and should not go for just
Consumer Electrical Equipment’s as if it go for all the three than it can even to the
diversification of its business and as a result it will able to earn more amount of the profit. So
as the profit is seen that clearly states that there is a huge market for bulb and switches so it
should not stop the production of those unit and should give emphasis on all the three items.
tabler-icon-diamond-filled.svg

Paraphrase This Document

Need a fresh take? Get an instant paraphrase of this document with our AI Paraphraser
Document Page
7
Financial Analysis
chevron_up_icon
1 out of 8
circle_padding
hide_on_mobile
zoom_out_icon
[object Object]