Financial Analysis of Singapore Airlines: JMD1156 Finance Report
VerifiedAdded on 2024/05/29
|17
|4364
|362
Report
AI Summary
This report provides a financial analysis of Singapore Airlines, evaluating the company's performance using horizontal and ratio analysis. It examines key balance sheet items, including current and non-current assets and liabilities, as well as owner's equity, across a three-year period (2015-2017). The analysis includes liquidity ratios (current and quick ratio), solvency ratios (debt-to-equity and debt-to-assets), and profitability ratios (net margin, ROA, ROE). The report highlights trends in these ratios, noting a decline in liquidity and a high level of debt. The analysis also covers the profit and loss statement, examining revenue, expenses, and operating profit. This financial evaluation aims to provide insights into the financial health and performance of Singapore Airlines.
JMD1156 FINANCE HOSPITALITY
1
1
Paraphrase This Document
Need a fresh take? Get an instant paraphrase of this document with our AI Paraphraser
Table of Contents
Introduction......................................................................................................................................3
Financial analysis of Singapore Airlines.........................................................................................4
Conclusion.....................................................................................................................................15
References......................................................................................................................................16
2
Introduction
In the economy, there are various sectors in which business is carried out and one of them is
hospitality in which customers are provided with various facilities and services. In carrying out
of them there will be a requirement of funds and they will have to be obtained from appropriate
sources. Also, the proper evaluation shall be made so that all the shortcomings which are
involved can be identified and steps for their resolution can be taken. In this report, the financial
analysis will be performed for Singapore Airlines and all the aspects will be included in this so
that the appropriate decisions are taken in their respect. The profitability, liquidity and other
factors will be evaluated appropriately.
3
⊘ This is a preview!⊘
Do you want full access?
Subscribe today to unlock all pages.
Trusted by 1+ million students worldwide
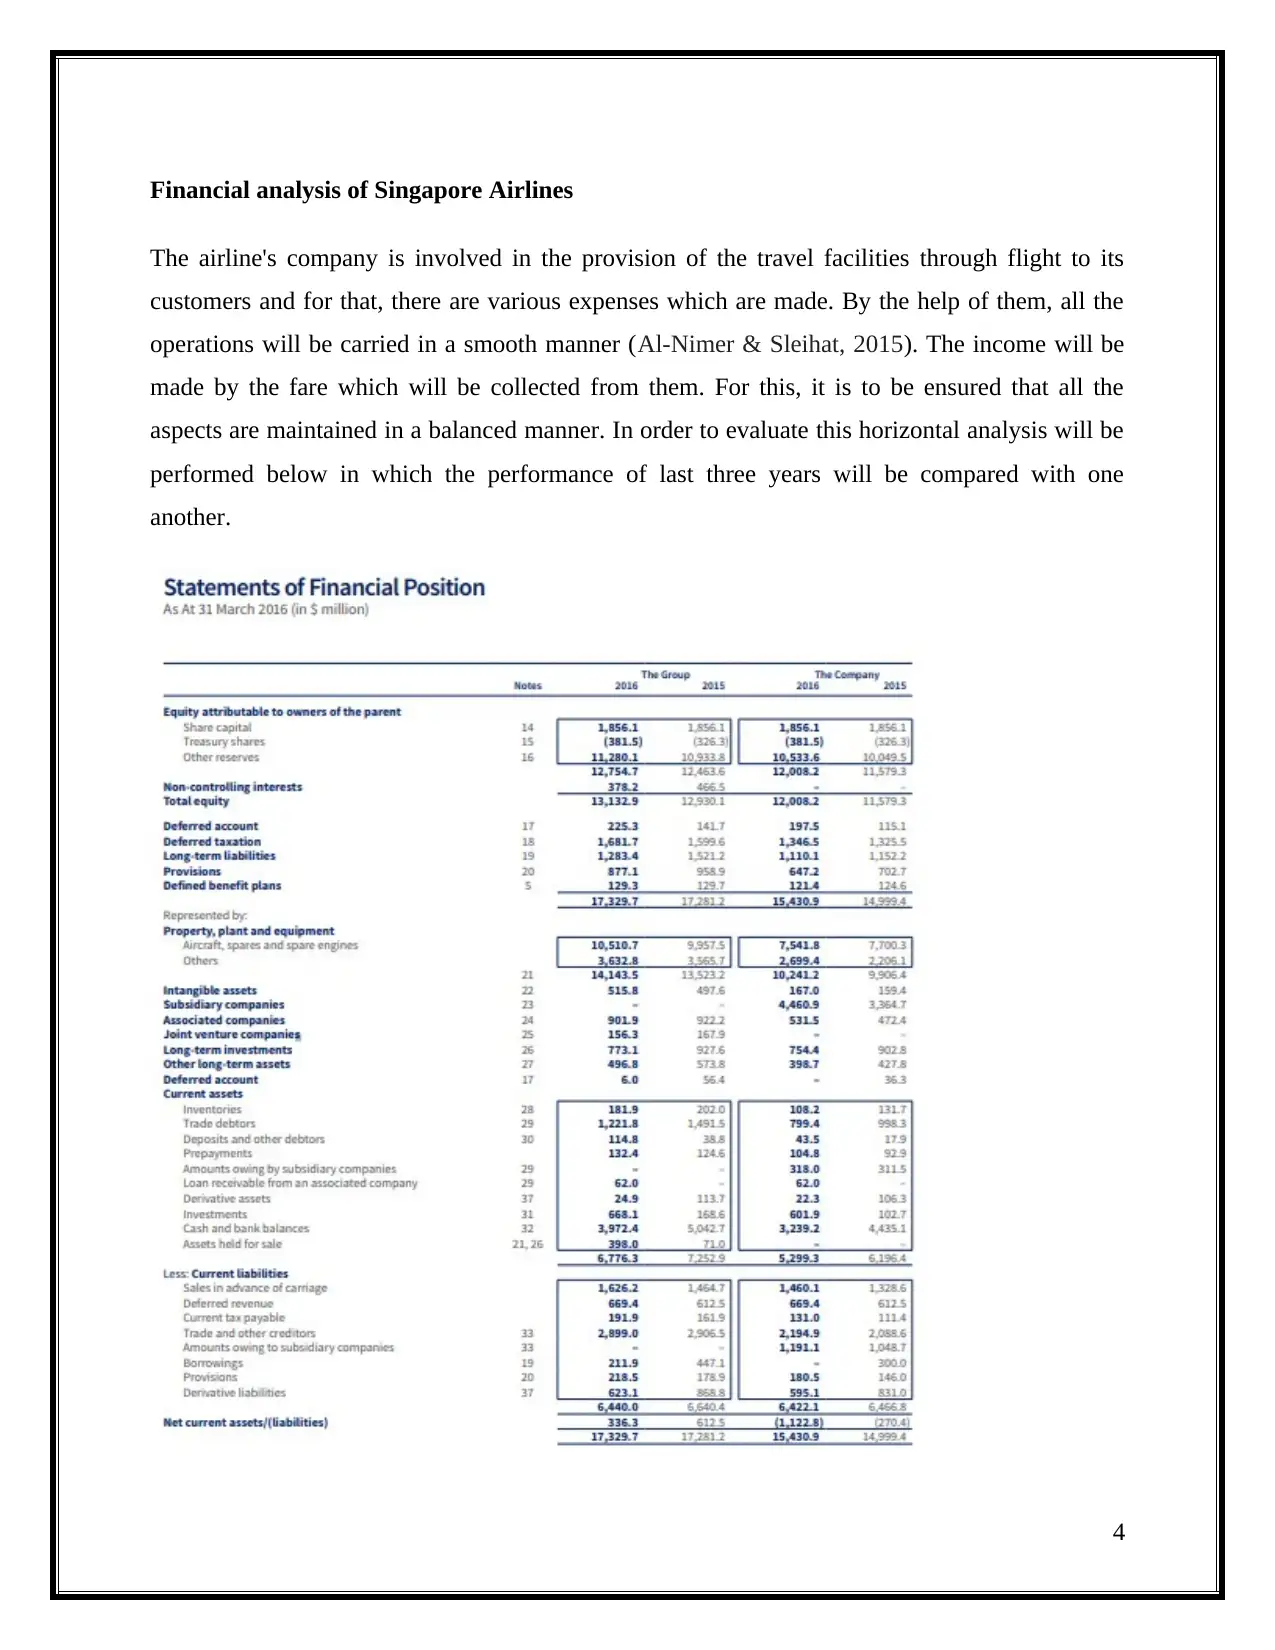
Financial analysis of Singapore Airlines
The airline's company is involved in the provision of the travel facilities through flight to its
customers and for that, there are various expenses which are made. By the help of them, all the
operations will be carried in a smooth manner (Al-Nimer & Sleihat, 2015). The income will be
made by the fare which will be collected from them. For this, it is to be ensured that all the
aspects are maintained in a balanced manner. In order to evaluate this horizontal analysis will be
performed below in which the performance of last three years will be compared with one
another.
4
Paraphrase This Document
Need a fresh take? Get an instant paraphrase of this document with our AI Paraphraser
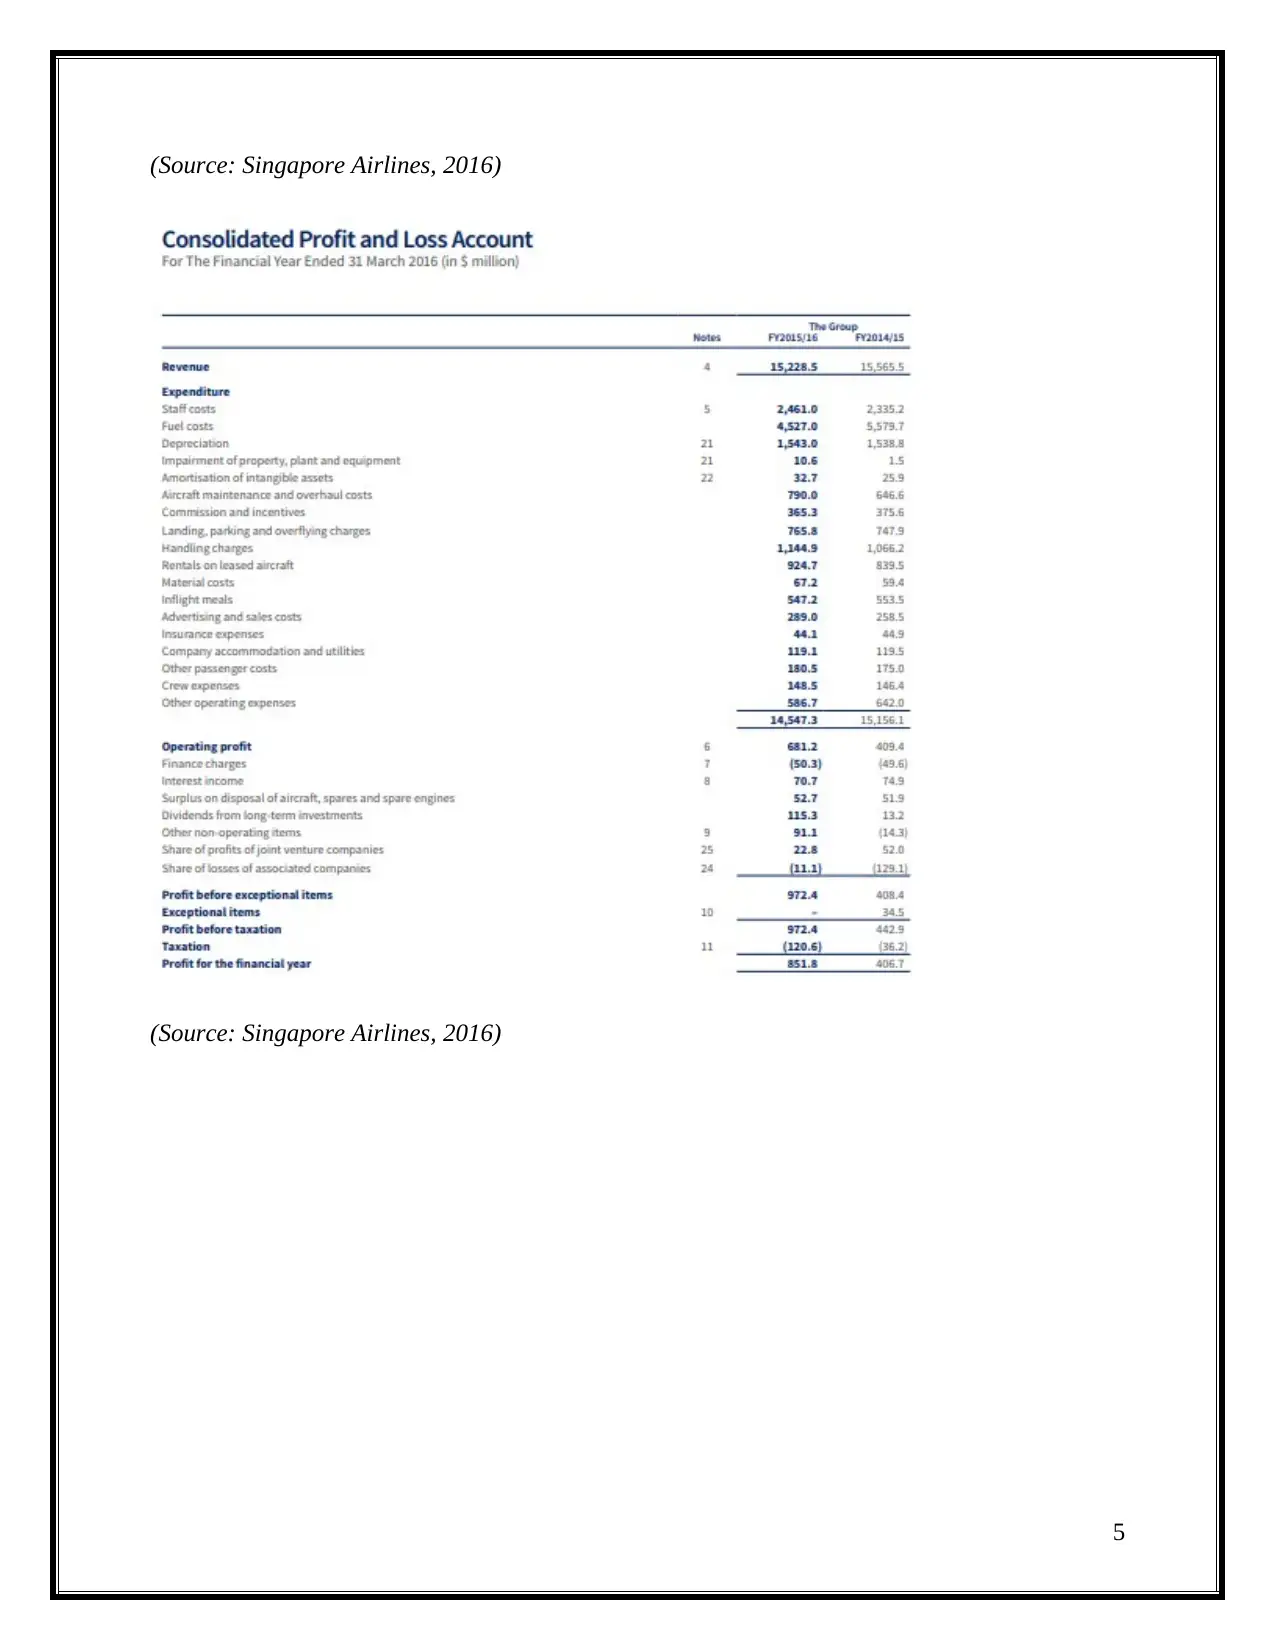
(Source: Singapore Airlines, 2016)
(Source: Singapore Airlines, 2016)
5
(Source: Singapore Airlines, 2016)
5
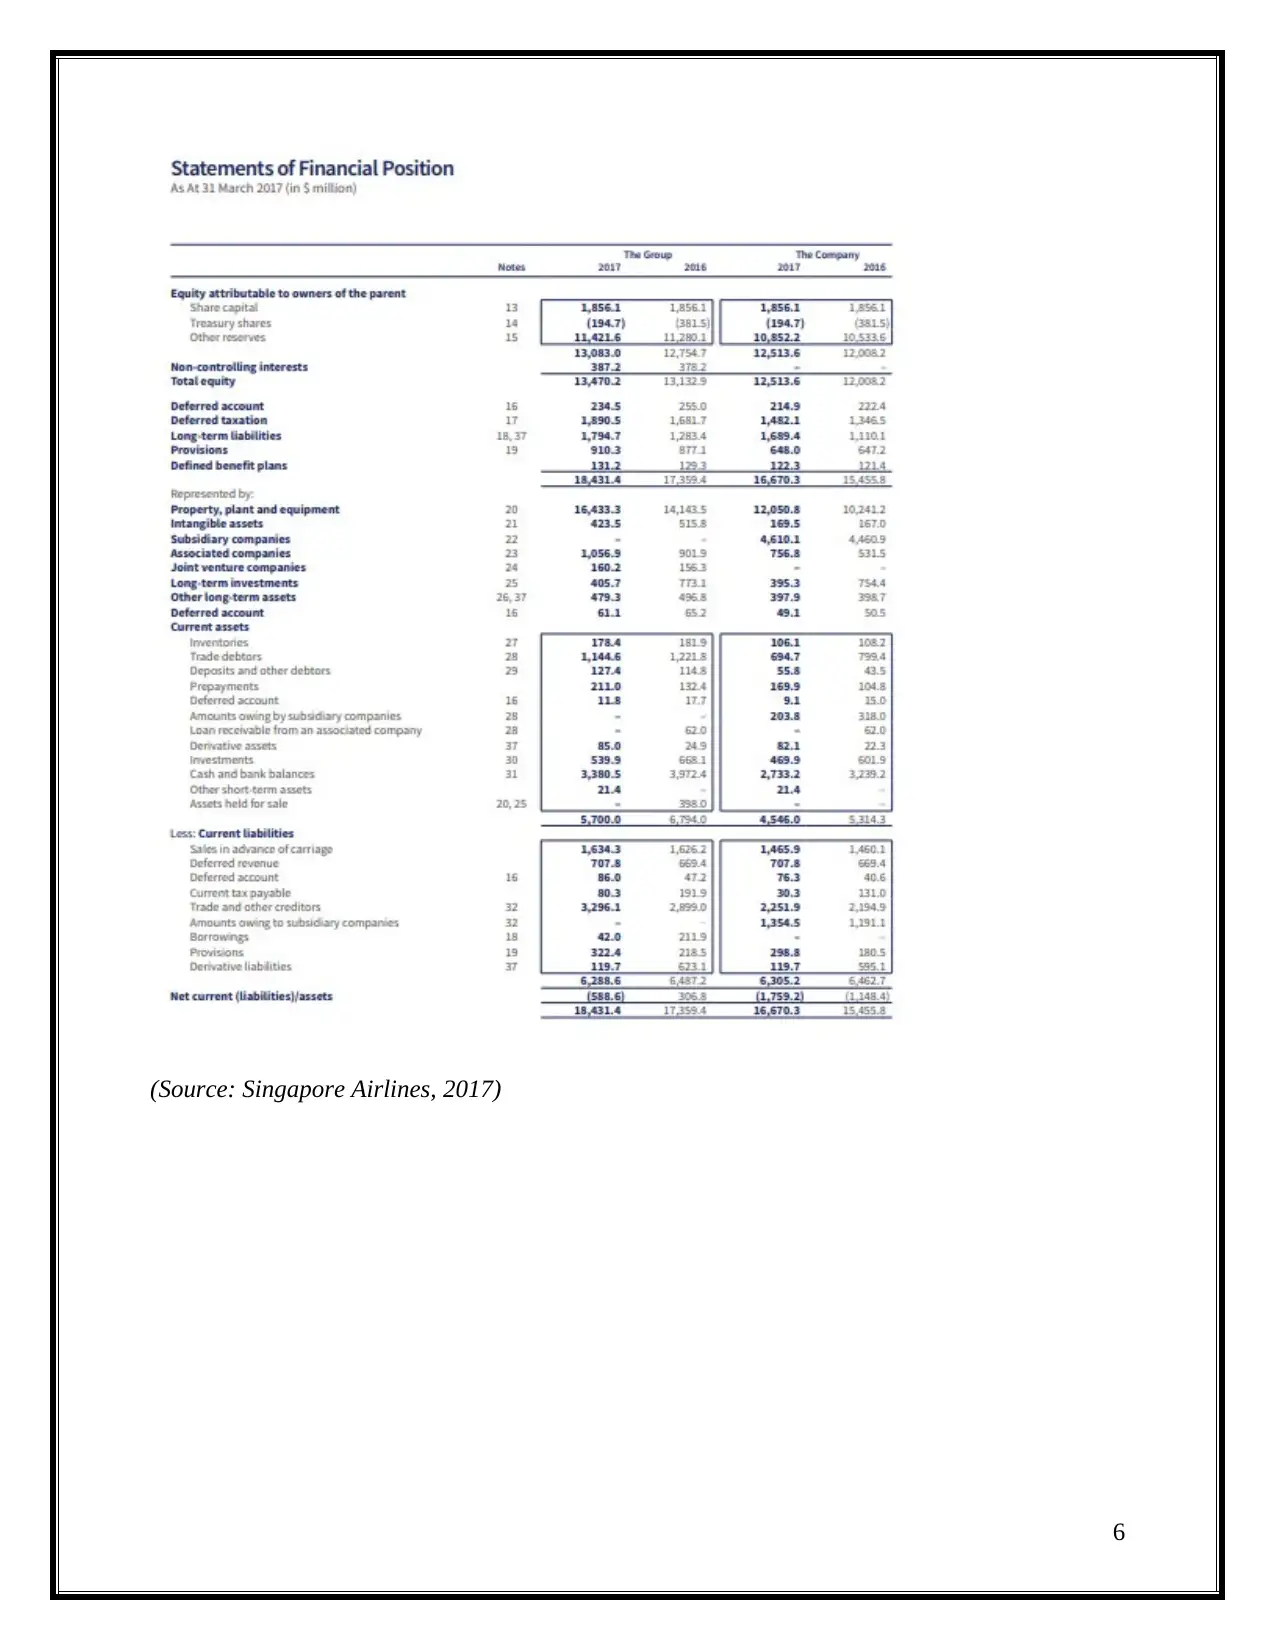
(Source: Singapore Airlines, 2017)
6
6
⊘ This is a preview!⊘
Do you want full access?
Subscribe today to unlock all pages.
Trusted by 1+ million students worldwide
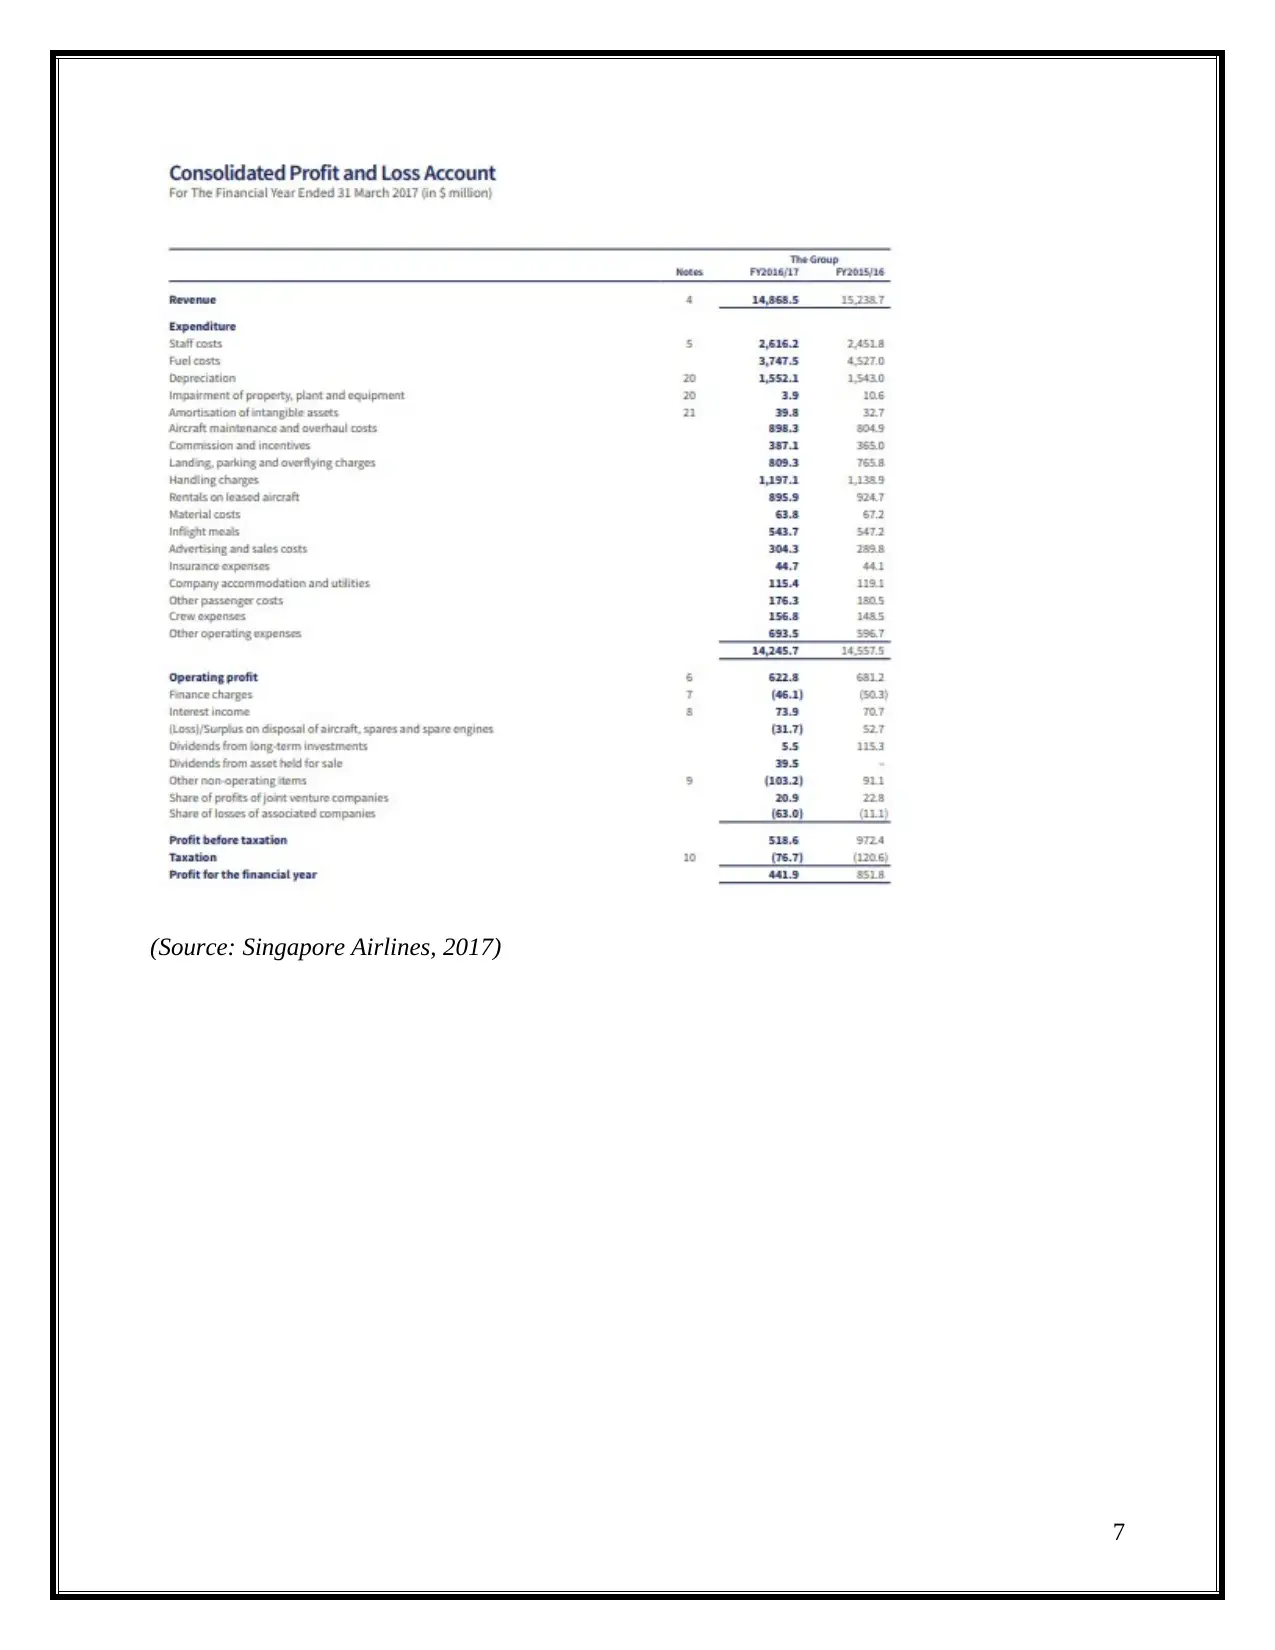
(Source: Singapore Airlines, 2017)
7
7
Paraphrase This Document
Need a fresh take? Get an instant paraphrase of this document with our AI Paraphraser
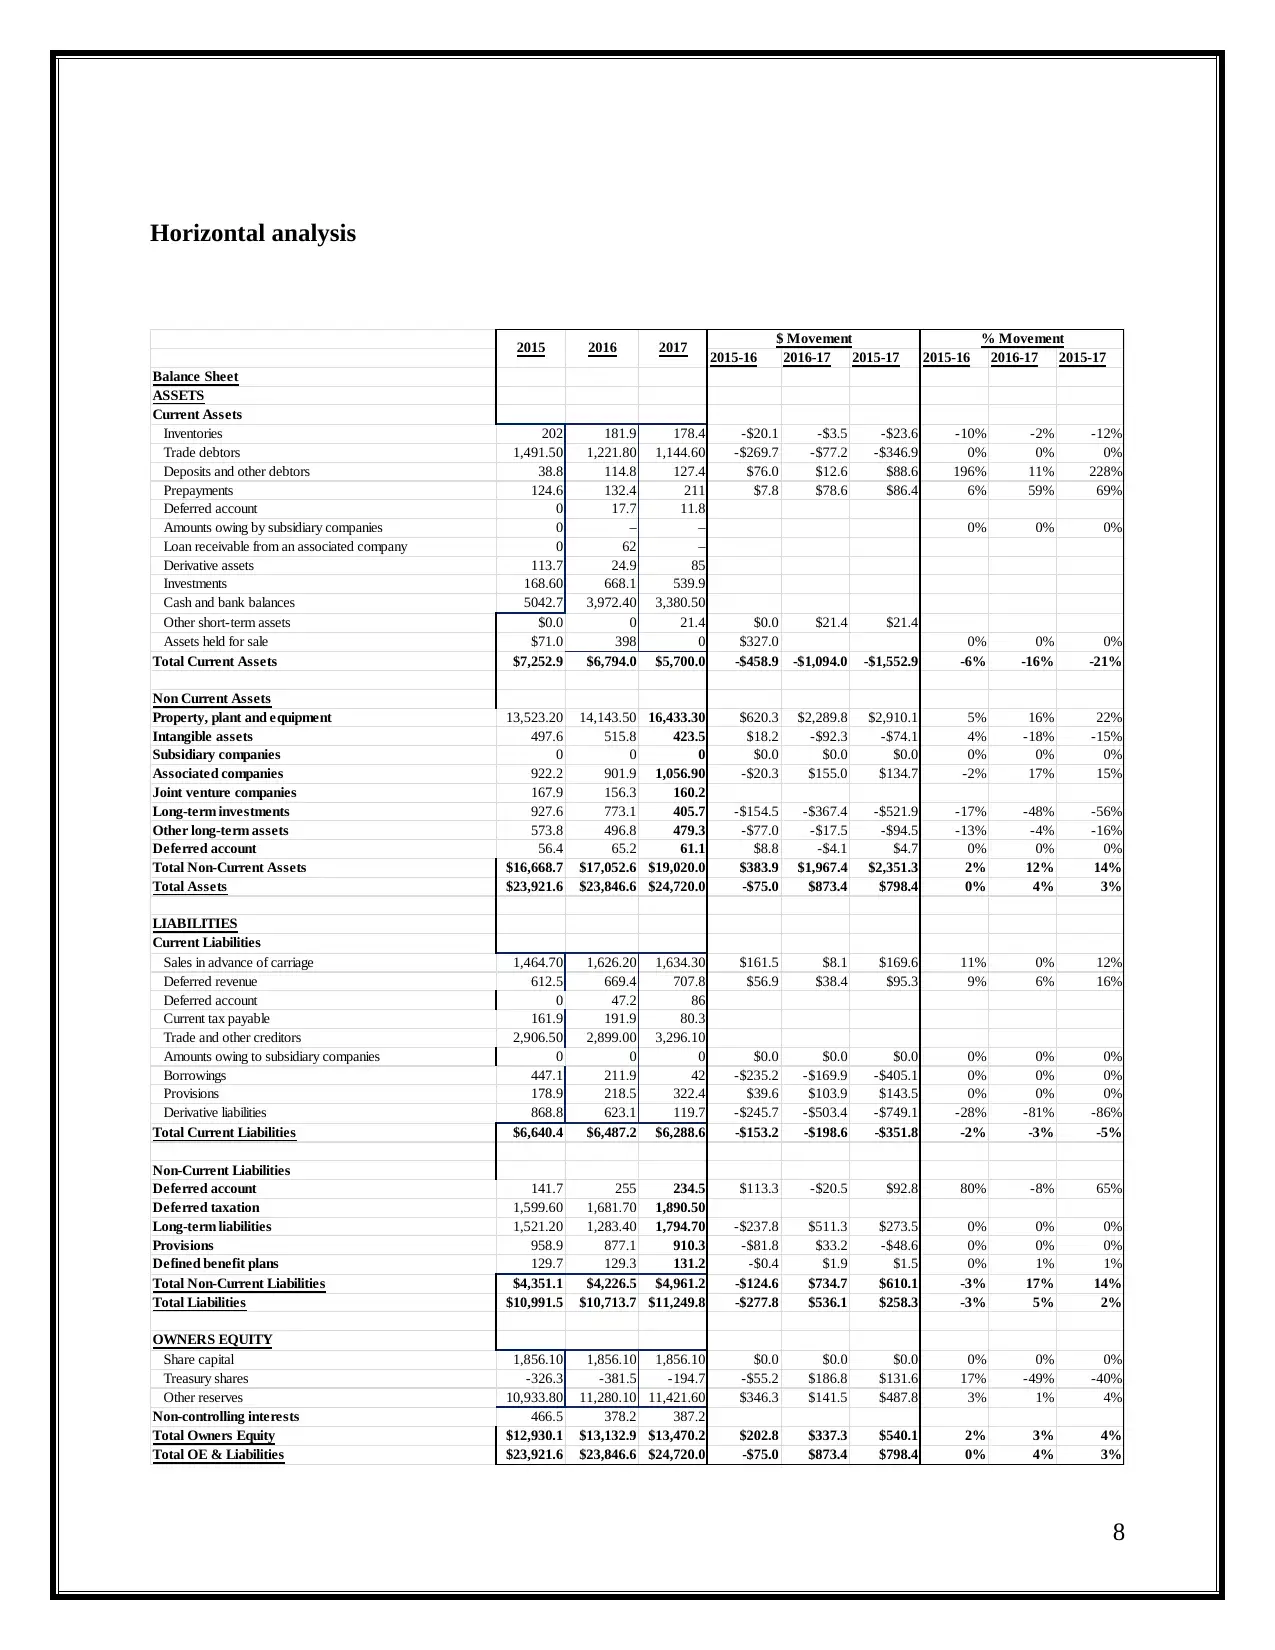
Horizontal analysis
2015-16 2016-17 2015-17 2015-16 2016-17 2015-17
Balance Sheet
ASSETS
Current Assets
Inventories 202 181.9 178.4 -$20.1 -$3.5 -$23.6 -10% -2% -12%
Trade debtors 1,491.50 1,221.80 1,144.60 -$269.7 -$77.2 -$346.9 0% 0% 0%
Deposits and other debtors 38.8 114.8 127.4 $76.0 $12.6 $88.6 196% 11% 228%
Prepayments 124.6 132.4 211 $7.8 $78.6 $86.4 6% 59% 69%
Deferred account 0 17.7 11.8
Amounts owing by subsidiary companies 0 – – 0% 0% 0%
Loan receivable from an associated company 0 62 –
Derivative assets 113.7 24.9 85
Investments 168.60 668.1 539.9
Cash and bank balances 5042.7 3,972.40 3,380.50
Other short-term assets $0.0 0 21.4 $0.0 $21.4 $21.4
Assets held for sale $71.0 398 0 $327.0 0% 0% 0%
Total Current Assets $7,252.9 $6,794.0 $5,700.0 -$458.9 -$1,094.0 -$1,552.9 -6% -16% -21%
Non Current Assets
Property, plant and equipment 13,523.20 14,143.50 16,433.30 $620.3 $2,289.8 $2,910.1 5% 16% 22%
Intangible assets 497.6 515.8 423.5 $18.2 -$92.3 -$74.1 4% -18% -15%
Subsidiary companies 0 0 0 $0.0 $0.0 $0.0 0% 0% 0%
Associated companies 922.2 901.9 1,056.90 -$20.3 $155.0 $134.7 -2% 17% 15%
Joint venture companies 167.9 156.3 160.2
Long-term investments 927.6 773.1 405.7 -$154.5 -$367.4 -$521.9 -17% -48% -56%
Other long-term assets 573.8 496.8 479.3 -$77.0 -$17.5 -$94.5 -13% -4% -16%
Deferred account 56.4 65.2 61.1 $8.8 -$4.1 $4.7 0% 0% 0%
Total Non-Current Assets $16,668.7 $17,052.6 $19,020.0 $383.9 $1,967.4 $2,351.3 2% 12% 14%
Total Assets $23,921.6 $23,846.6 $24,720.0 -$75.0 $873.4 $798.4 0% 4% 3%
LIABILITIES
Current Liabilities
Sales in advance of carriage 1,464.70 1,626.20 1,634.30 $161.5 $8.1 $169.6 11% 0% 12%
Deferred revenue 612.5 669.4 707.8 $56.9 $38.4 $95.3 9% 6% 16%
Deferred account 0 47.2 86
Current tax payable 161.9 191.9 80.3
Trade and other creditors 2,906.50 2,899.00 3,296.10
Amounts owing to subsidiary companies 0 0 0 $0.0 $0.0 $0.0 0% 0% 0%
Borrowings 447.1 211.9 42 -$235.2 -$169.9 -$405.1 0% 0% 0%
Provisions 178.9 218.5 322.4 $39.6 $103.9 $143.5 0% 0% 0%
Derivative liabilities 868.8 623.1 119.7 -$245.7 -$503.4 -$749.1 -28% -81% -86%
Total Current Liabilities $6,640.4 $6,487.2 $6,288.6 -$153.2 -$198.6 -$351.8 -2% -3% -5%
Non-Current Liabilities
Deferred account 141.7 255 234.5 $113.3 -$20.5 $92.8 80% -8% 65%
Deferred taxation 1,599.60 1,681.70 1,890.50
Long-term liabilities 1,521.20 1,283.40 1,794.70 -$237.8 $511.3 $273.5 0% 0% 0%
Provisions 958.9 877.1 910.3 -$81.8 $33.2 -$48.6 0% 0% 0%
Defined benefit plans 129.7 129.3 131.2 -$0.4 $1.9 $1.5 0% 1% 1%
Total Non-Current Liabilities $4,351.1 $4,226.5 $4,961.2 -$124.6 $734.7 $610.1 -3% 17% 14%
Total Liabilities $10,991.5 $10,713.7 $11,249.8 -$277.8 $536.1 $258.3 -3% 5% 2%
OWNERS EQUITY
Share capital 1,856.10 1,856.10 1,856.10 $0.0 $0.0 $0.0 0% 0% 0%
Treasury shares -326.3 -381.5 -194.7 -$55.2 $186.8 $131.6 17% -49% -40%
Other reserves 10,933.80 11,280.10 11,421.60 $346.3 $141.5 $487.8 3% 1% 4%
Non-controlling interests 466.5 378.2 387.2
Total Owners Equity $12,930.1 $13,132.9 $13,470.2 $202.8 $337.3 $540.1 2% 3% 4%
Total OE & Liabilities $23,921.6 $23,846.6 $24,720.0 -$75.0 $873.4 $798.4 0% 4% 3%
20172015 2016 $ Movement % Movement
8
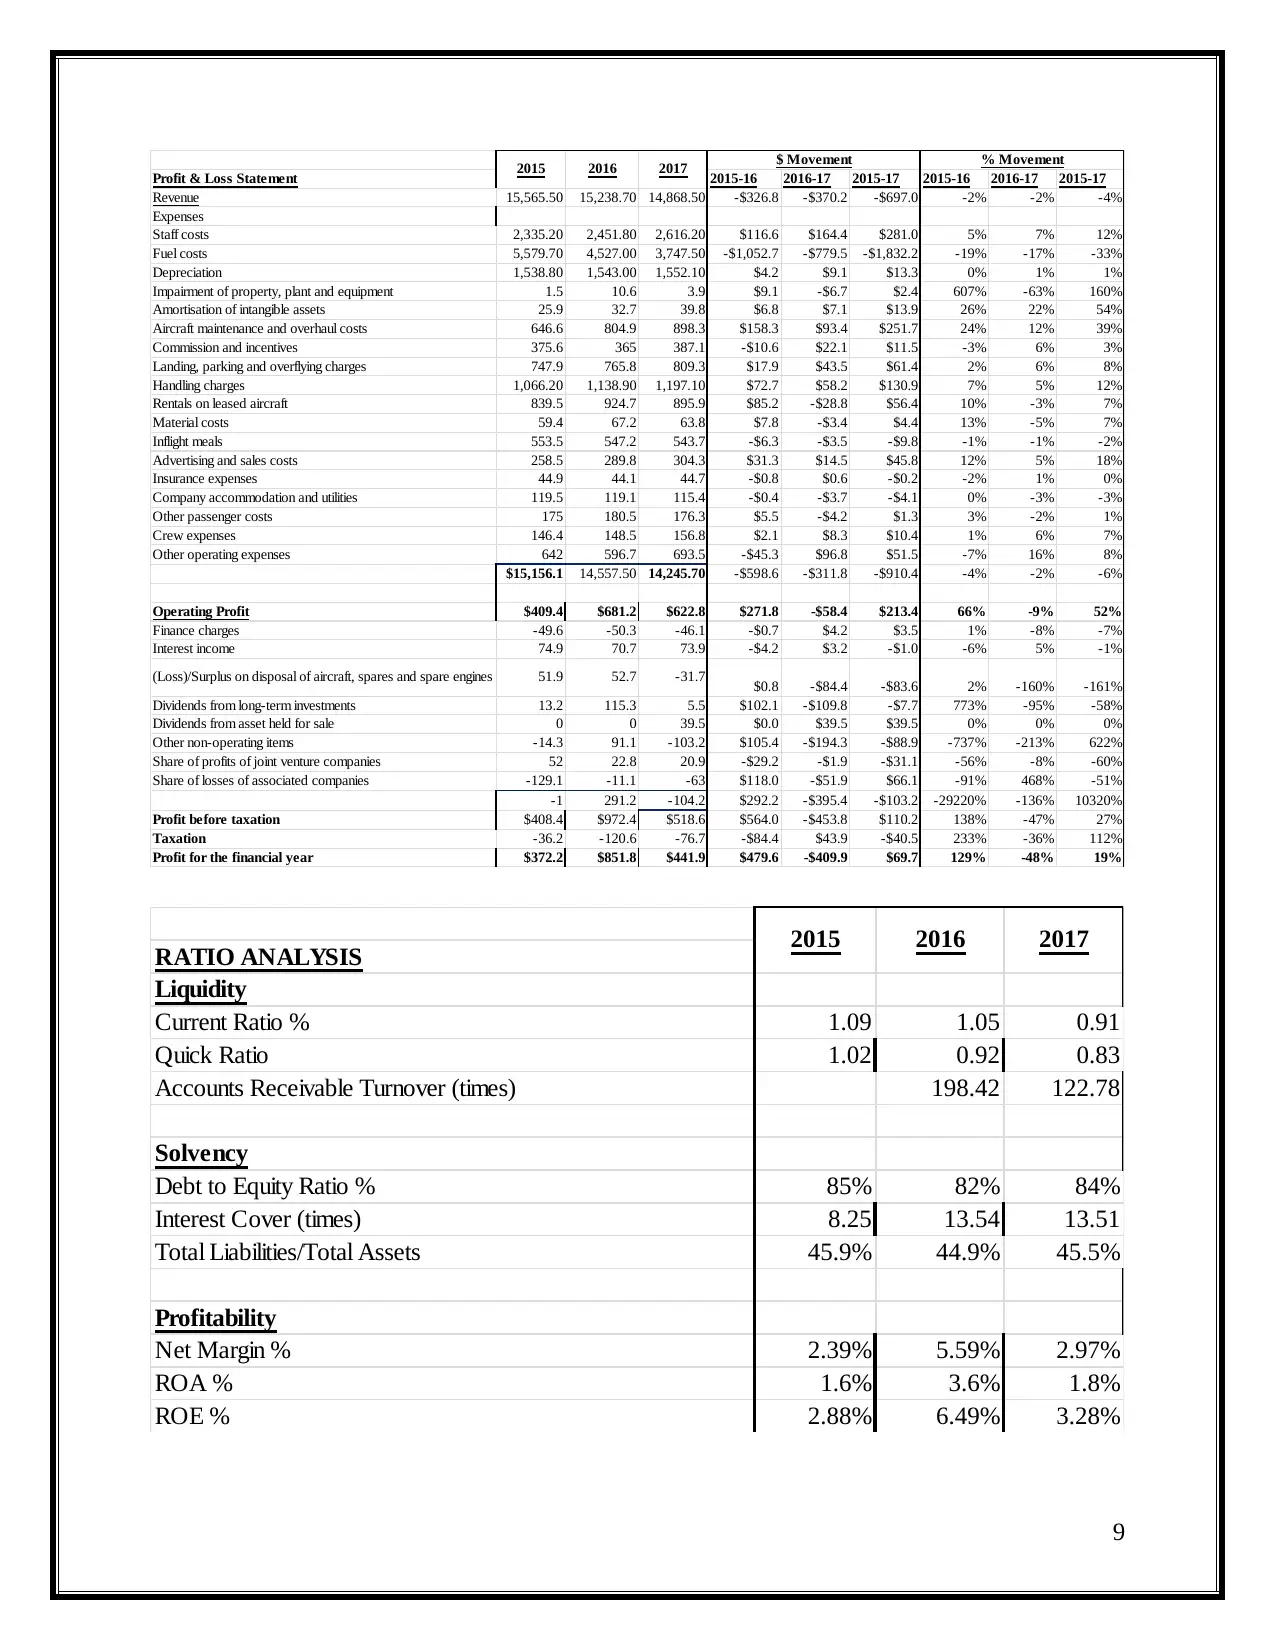
Profit & Loss Statement 2015-16 2016-17 2015-17 2015-16 2016-17 2015-17
Revenue 15,565.50 15,238.70 14,868.50 -$326.8 -$370.2 -$697.0 -2% -2% -4%
Expenses
Staff costs 2,335.20 2,451.80 2,616.20 $116.6 $164.4 $281.0 5% 7% 12%
Fuel costs 5,579.70 4,527.00 3,747.50 -$1,052.7 -$779.5 -$1,832.2 -19% -17% -33%
Depreciation 1,538.80 1,543.00 1,552.10 $4.2 $9.1 $13.3 0% 1% 1%
Impairment of property, plant and equipment 1.5 10.6 3.9 $9.1 -$6.7 $2.4 607% -63% 160%
Amortisation of intangible assets 25.9 32.7 39.8 $6.8 $7.1 $13.9 26% 22% 54%
Aircraft maintenance and overhaul costs 646.6 804.9 898.3 $158.3 $93.4 $251.7 24% 12% 39%
Commission and incentives 375.6 365 387.1 -$10.6 $22.1 $11.5 -3% 6% 3%
Landing, parking and overflying charges 747.9 765.8 809.3 $17.9 $43.5 $61.4 2% 6% 8%
Handling charges 1,066.20 1,138.90 1,197.10 $72.7 $58.2 $130.9 7% 5% 12%
Rentals on leased aircraft 839.5 924.7 895.9 $85.2 -$28.8 $56.4 10% -3% 7%
Material costs 59.4 67.2 63.8 $7.8 -$3.4 $4.4 13% -5% 7%
Inflight meals 553.5 547.2 543.7 -$6.3 -$3.5 -$9.8 -1% -1% -2%
Advertising and sales costs 258.5 289.8 304.3 $31.3 $14.5 $45.8 12% 5% 18%
Insurance expenses 44.9 44.1 44.7 -$0.8 $0.6 -$0.2 -2% 1% 0%
Company accommodation and utilities 119.5 119.1 115.4 -$0.4 -$3.7 -$4.1 0% -3% -3%
Other passenger costs 175 180.5 176.3 $5.5 -$4.2 $1.3 3% -2% 1%
Crew expenses 146.4 148.5 156.8 $2.1 $8.3 $10.4 1% 6% 7%
Other operating expenses 642 596.7 693.5 -$45.3 $96.8 $51.5 -7% 16% 8%
$15,156.1 14,557.50 14,245.70 -$598.6 -$311.8 -$910.4 -4% -2% -6%
Operating Profit $409.4 $681.2 $622.8 $271.8 -$58.4 $213.4 66% -9% 52%
Finance charges -49.6 -50.3 -46.1 -$0.7 $4.2 $3.5 1% -8% -7%
Interest income 74.9 70.7 73.9 -$4.2 $3.2 -$1.0 -6% 5% -1%
(Loss)/Surplus on disposal of aircraft, spares and spare engines 51.9 52.7 -31.7 $0.8 -$84.4 -$83.6 2% -160% -161%
Dividends from long-term investments 13.2 115.3 5.5 $102.1 -$109.8 -$7.7 773% -95% -58%
Dividends from asset held for sale 0 0 39.5 $0.0 $39.5 $39.5 0% 0% 0%
Other non-operating items -14.3 91.1 -103.2 $105.4 -$194.3 -$88.9 -737% -213% 622%
Share of profits of joint venture companies 52 22.8 20.9 -$29.2 -$1.9 -$31.1 -56% -8% -60%
Share of losses of associated companies -129.1 -11.1 -63 $118.0 -$51.9 $66.1 -91% 468% -51%
-1 291.2 -104.2 $292.2 -$395.4 -$103.2 -29220% -136% 10320%
Profit before taxation $408.4 $972.4 $518.6 $564.0 -$453.8 $110.2 138% -47% 27%
Taxation -36.2 -120.6 -76.7 -$84.4 $43.9 -$40.5 233% -36% 112%
Profit for the financial year $372.2 $851.8 $441.9 $479.6 -$409.9 $69.7 129% -48% 19%
$ Movement % Movement
2015 2016 2017
RATIO ANALYSIS
Liquidity
Current Ratio % 1.09 1.05 0.91
Quick Ratio 1.02 0.92 0.83
Accounts Receivable Turnover (times) 198.42 122.78
Solvency
Debt to Equity Ratio % 85% 82% 84%
Interest Cover (times) 8.25 13.54 13.51
Total Liabilities/Total Assets 45.9% 44.9% 45.5%
Profitability
Net Margin % 2.39% 5.59% 2.97%
ROA % 1.6% 3.6% 1.8%
ROE % 2.88% 6.49% 3.28%
2015 2016 2017
9
⊘ This is a preview!⊘
Do you want full access?
Subscribe today to unlock all pages.
Trusted by 1+ million students worldwide
• Current ratio: The company is required that to ensure that proper liquidity is there and for
that this ratio is used in which all the current assets are to be compared with the liabilities to
be met by business in coming period (Abreu, et. al., 2017). In the airlines also this is
calculated and it is found that the ratio is declining in all the years. It was 1.09 in 2015 and
till 2017 it reached to 0.91. This shows that company is not having enough resources and will
be facing difficulties due to this.
• Quick ratio: The assets which are to be used for the payment in case of immediate needs
will be covered under this and they are known as quick assets. In this inventory is not taken
into account as that required time for being able to convert in cash which will be used to meet
the obligation. All of the liquid assets will be divided with the current liabilities. This is also
reducing to 1.02 in 2015 and then to 0.92 in 2016 and in 2017 to 0.83 and so the risk is
involved in relation to it.
• Accounts receivable turnover: The average receivables are taken into account and then
they are to be compared with the sales which are made in the particular period. By the help of
this, it is determined that how many times is the sales to the accounts receivables and is the
company collecting all of them in an appropriate period of time (Bittner, et. al., 2015). The
revenue in the company is around 198.42 times of the debtors in 2016 and in 2017 it is at
122.78. All of this shows that its sales are much higher than the receivables and not much
funds are blocked by debtors.
• A number of days' sales in receivables: The time which is undertaken in the collection
process of the company under which all the debtors are to be recovered is identified by the
help of this (Vogel, 2016). The days which are required are ascertained and it is determined
that company is able to complete the process in a timely manner.
• Inventory turnover: The stock which is maintained by the company in comparison to the
sales will be determined by the help of this ratio. This helps in maintaining the stock at such
level where the company will not have to incur the additional cost and also the risk involved
in this respect will be eliminated.
10
Paraphrase This Document
Need a fresh take? Get an instant paraphrase of this document with our AI Paraphraser
• A number of days' sales in inventory: The business cannot be undertaken if the
appropriate stock is not maintained and for that this ratio is used in which the inventory
available will be ascertained and it will be identified that for what period it will be sufficient
so that further orders can be placed accordingly (Capozzi, et. al., 2015).
• Debt to Assets ratio: The ratio is used so that all the assets which are available in the
company will be compared with the debt which is there. By this, it is determined that whether
the assets of the company are sufficient and will be able to meet the liabilities which will be
arising.
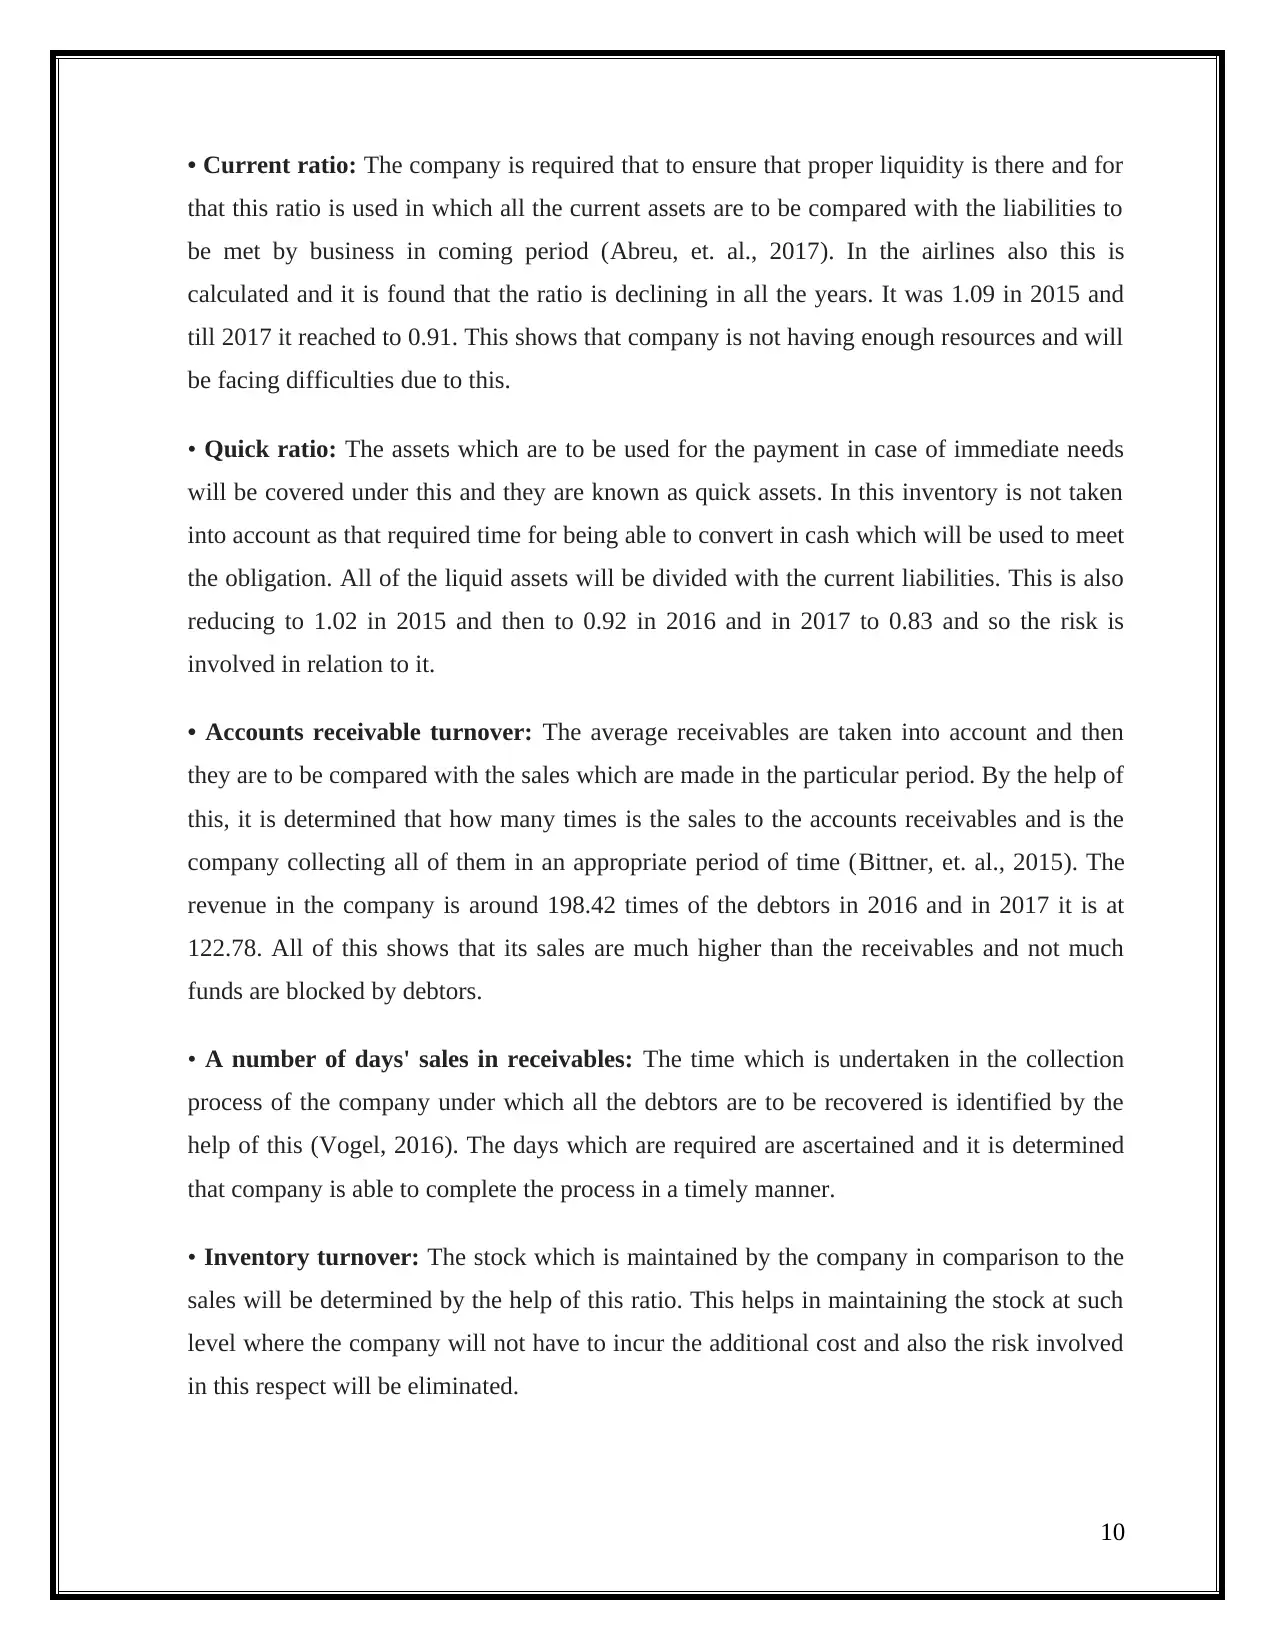
• Debt to Equity ratio: In the business, funds are obtained from two major sources which
are either the capital or the borrowings which are made. There is the need to make the proper
balance among them so that there is no excessive cost which will have to be incurred
(Halpern, et. al., 2016). It is required as if the debt will be more than the company will have
to meet the interest expenses in large amount. The ratio of debt is 85% in 2015 and it
declined to 82% in 2016 and there is 84% in 2017. The debts are much higher and company
needs to decrease them.
1 2 3
79%
80%
81%
82%
83%
84%
85%
86%
85%
82%
84%
Debt to Equity Ratio %
Debt to Equity Ratio %
• A number of times interest charges are earned: in this ratio the interest which is incurred
in the company will be compared with the earnings so that it can be identified that how many
times will the profit cover the interest and will the company able to meet the interest
11
appropriate stock is not maintained and for that this ratio is used in which the inventory
available will be ascertained and it will be identified that for what period it will be sufficient
so that further orders can be placed accordingly (Capozzi, et. al., 2015).
• Debt to Assets ratio: The ratio is used so that all the assets which are available in the
company will be compared with the debt which is there. By this, it is determined that whether
the assets of the company are sufficient and will be able to meet the liabilities which will be
arising.
• Debt to Equity ratio: In the business, funds are obtained from two major sources which
are either the capital or the borrowings which are made. There is the need to make the proper
balance among them so that there is no excessive cost which will have to be incurred
(Halpern, et. al., 2016). It is required as if the debt will be more than the company will have
to meet the interest expenses in large amount. The ratio of debt is 85% in 2015 and it
declined to 82% in 2016 and there is 84% in 2017. The debts are much higher and company
needs to decrease them.
1 2 3
79%
80%
81%
82%
83%
84%
85%
86%
85%
82%
84%
Debt to Equity Ratio %
Debt to Equity Ratio %
• A number of times interest charges are earned: in this ratio the interest which is incurred
in the company will be compared with the earnings so that it can be identified that how many
times will the profit cover the interest and will the company able to meet the interest
11
liabilities on time (Zaitseva, et. al., 2016). This has increased from 8.25% in 2015 to 13.51%
in 2017. This shows that company will be able to properly meet all the expenses and there
will be no issues with a company which will be faced due to this.
• Profit Margin ratio: The company earns the profits in the business and it is required that
all of them shall be compared with sales which are made. By that, it will be determined that
company is making the appropriate level of sales by which it will be possible for them to
earn the required profits (Kanapickienė & Grundienė, 2015). The profit level increased in
2016 but then it again declined to 2.97% in 2017. This is not a good factor and company will
have to take steps in this respect.
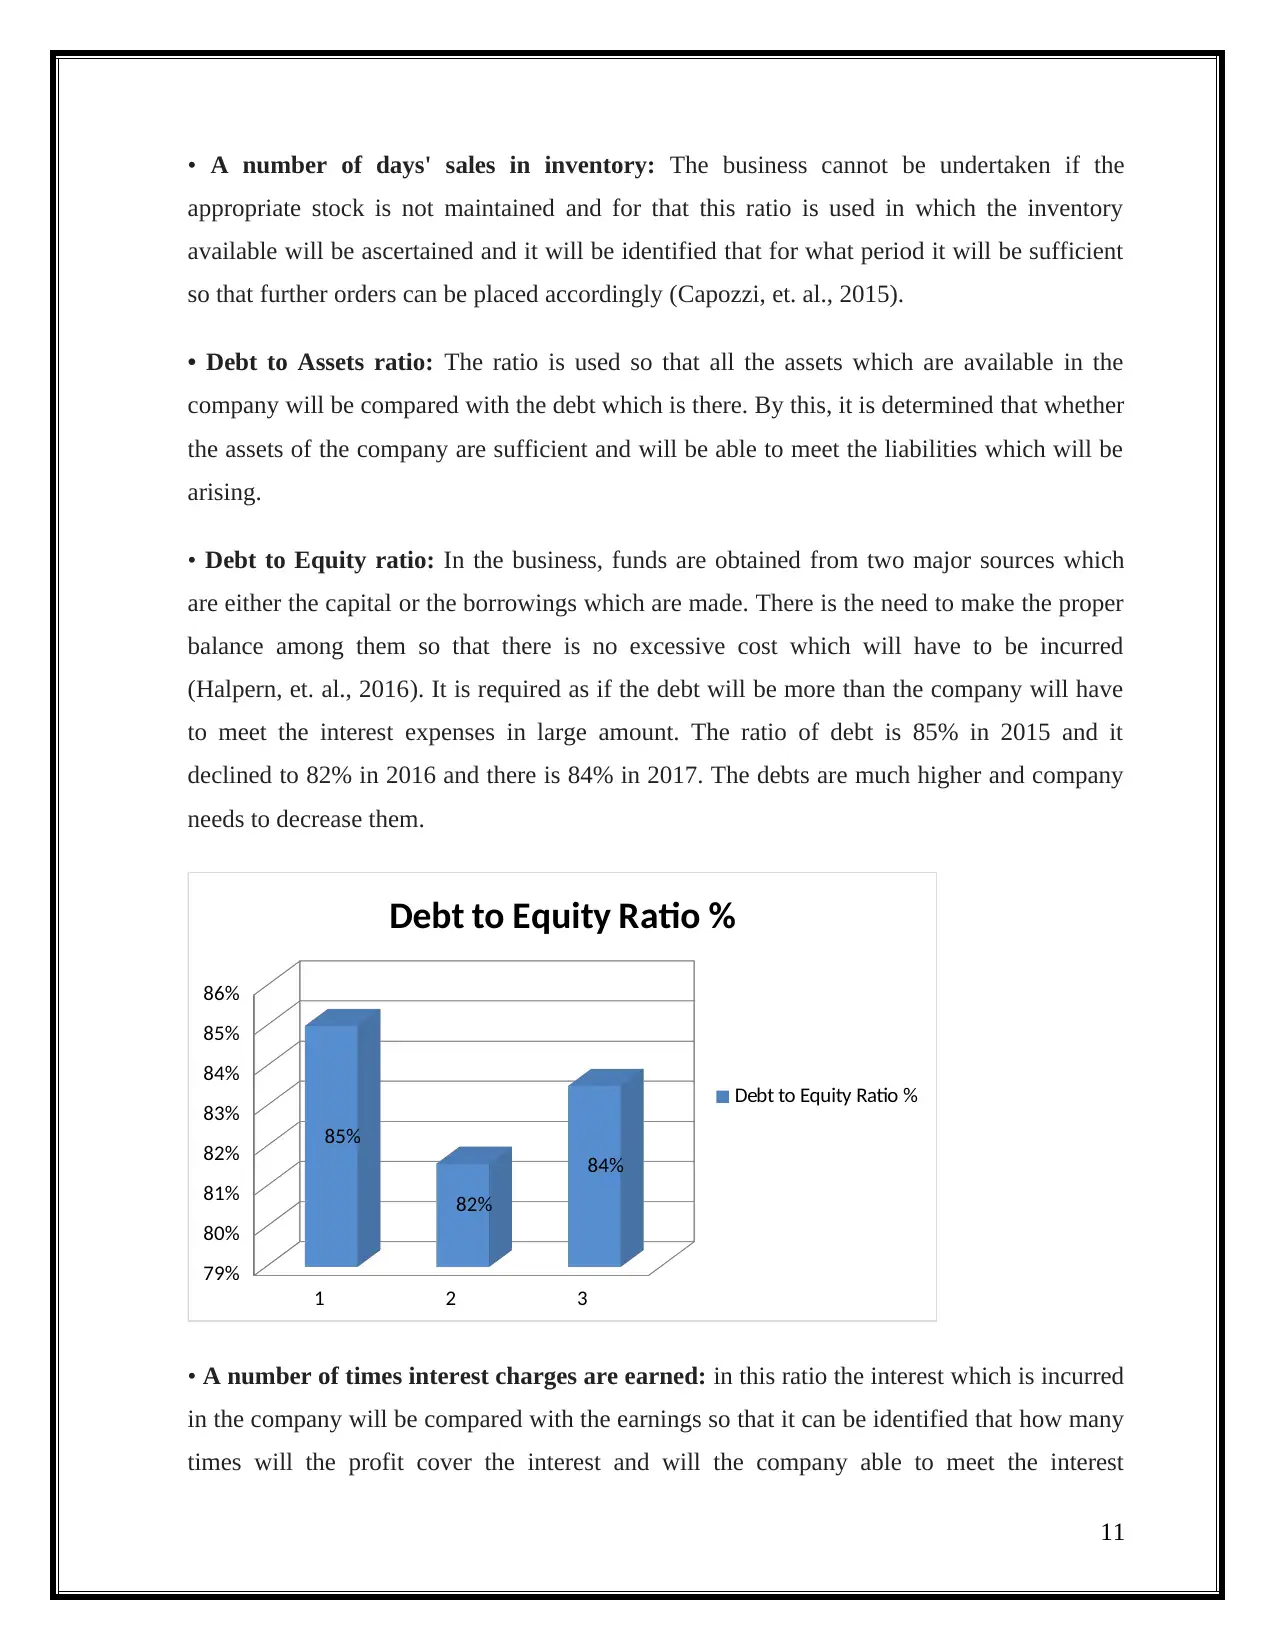
• Return on Assets: The Company is required to make the best use of the assets in such
manner that the overall earnings which are made with the help of them increases. For that,
this ratio is calculated in which the profit which is made with the help of assets is determined
(Salehi, et. al., 2014). The return will be compared with the total assets. The ratio of this was
1.6 in 2015 and then the returns increased and reached to 3.6 in 2016 but the company could
not maintain it and there was a reduction in this which made the percent to be 1.8 in 2017.
1 2 3
0.0%
0.5%
1.0%
1.5%
2.0%
2.5%
3.0%
3.5%
4.0%
1.6%
3.6%
1.8%
ROA %
ROA %
• Return on Equity: The earnings which are made on the equity will be evaluated so that it
can be identified them whether the company is utilizing the funds of capital in a proper
12
in 2017. This shows that company will be able to properly meet all the expenses and there
will be no issues with a company which will be faced due to this.
• Profit Margin ratio: The company earns the profits in the business and it is required that
all of them shall be compared with sales which are made. By that, it will be determined that
company is making the appropriate level of sales by which it will be possible for them to
earn the required profits (Kanapickienė & Grundienė, 2015). The profit level increased in
2016 but then it again declined to 2.97% in 2017. This is not a good factor and company will
have to take steps in this respect.
• Return on Assets: The Company is required to make the best use of the assets in such
manner that the overall earnings which are made with the help of them increases. For that,
this ratio is calculated in which the profit which is made with the help of assets is determined
(Salehi, et. al., 2014). The return will be compared with the total assets. The ratio of this was
1.6 in 2015 and then the returns increased and reached to 3.6 in 2016 but the company could
not maintain it and there was a reduction in this which made the percent to be 1.8 in 2017.
1 2 3
0.0%
0.5%
1.0%
1.5%
2.0%
2.5%
3.0%
3.5%
4.0%
1.6%
3.6%
1.8%
ROA %
ROA %
• Return on Equity: The earnings which are made on the equity will be evaluated so that it
can be identified them whether the company is utilizing the funds of capital in a proper
12
⊘ This is a preview!⊘
Do you want full access?
Subscribe today to unlock all pages.
Trusted by 1+ million students worldwide
1 out of 17
Related Documents


Your All-in-One AI-Powered Toolkit for Academic Success.
+13062052269
info@desklib.com
Available 24*7 on WhatsApp / Email
![[object Object]](/_next/static/media/star-bottom.7253800d.svg)
Unlock your academic potential
Copyright © 2020–2026 A2Z Services. All Rights Reserved. Developed and managed by ZUCOL.