Detailed Financial Analysis and Stock Valuation Report: SK Innovation
VerifiedAdded on 2020/10/22
|18
|7545
|59
Report
AI Summary
This report presents a comprehensive stock valuation analysis of SK Innovation, a company operating in the energy sector. It begins with an introduction to financial management and SK Innovation's business operations, followed by a PEST analysis and Porter's Five Forces framework to assess the external environment. The main body delves into various stock valuation methods, including Net Asset Value (NAV), Dividend Discount Model (DDM), Free Cash Flow to Equity (FCFE), and Free Cash Flow to Firm (FCFF) models. The report applies these models to SK Innovation, incorporating CAPM to determine the expected rate of return. It also calculates the beta of the company's stock. The report also explores the strengths and weaknesses of each model, highlighting their assumptions and limitations. Finally, the report provides recommendations to investors regarding the stock of SK Innovation. The report concludes by summarizing the key findings and implications of the analysis.

Stock Report
Paraphrase This Document
Need a fresh take? Get an instant paraphrase of this document with our AI Paraphraser
Table of Contents
INTRODUCTION...........................................................................................................................1
MAIN BODY...................................................................................................................................1
PEST analysis............................................................................................................................1
Porter's 5 force............................................................................................................................2
CONCLUSION..............................................................................................................................15
REFERENCES..............................................................................................................................17
INTRODUCTION
Financial management is any activity that is concerned with procurement, planning and
controlling of all financial resources of any organisation (Finkler and et.al., 2016). In simple
words it can be said as applying management principles to financial resources in any company.
SK Innovation company that was founded in 1962 limited works through its different
subsidiaries all over the world in energy related business. It mostly operates in Refining and
marketing of petroleum Products, Petrochemicals and Production etc. This company is listed in
S&P Global BMI Index. This current project is a stock report of the SK Innovation Company
Limited in which valuation of stock and value of Equity is calculated as per different methods of
Valuation. The Report also presents the recommendations to investors regarding buy, hold or sell
of the Stock of SK Innovation.
MAIN BODY
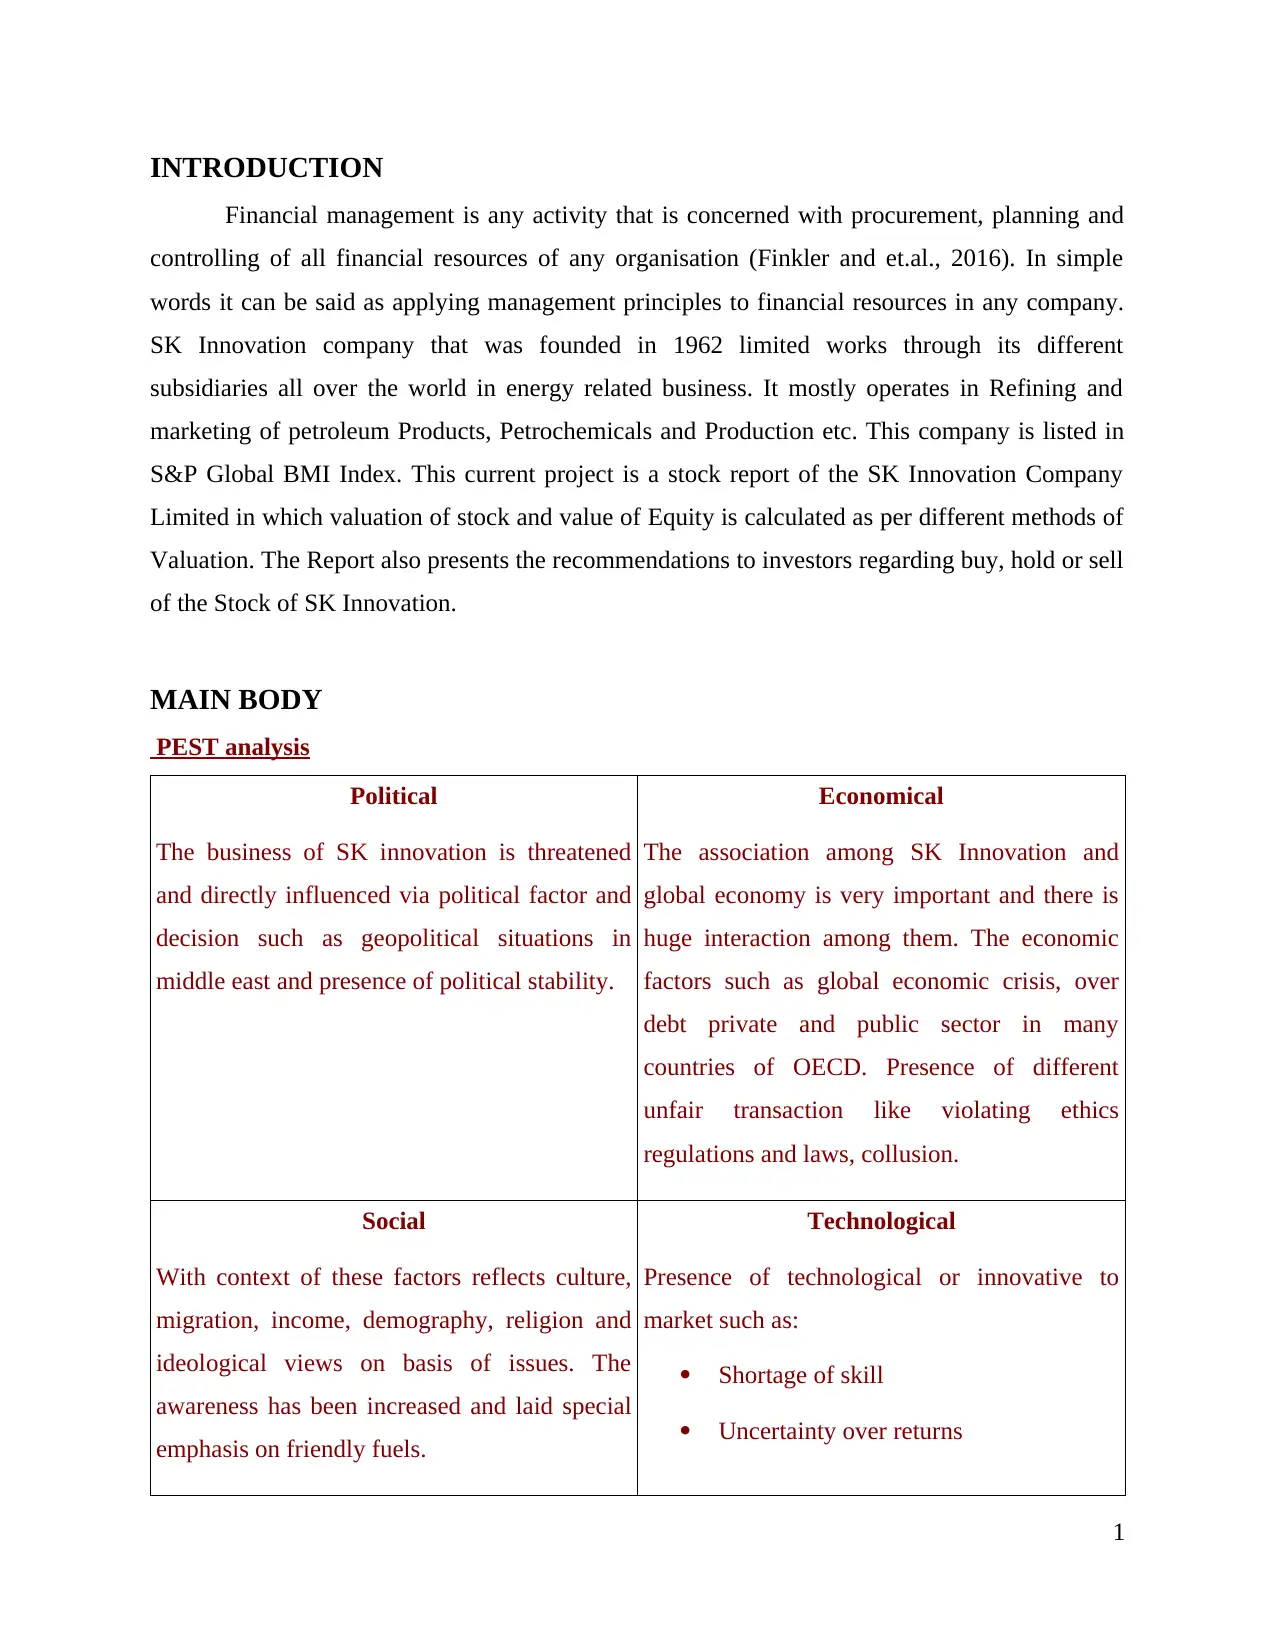
PEST analysis
Political
The business of SK innovation is threatened
and directly influenced via political factor and
decision such as geopolitical situations in
middle east and presence of political stability.
Economical
The association among SK Innovation and
global economy is very important and there is
huge interaction among them. The economic
factors such as global economic crisis, over
debt private and public sector in many
countries of OECD. Presence of different
unfair transaction like violating ethics
regulations and laws, collusion.
Social
With context of these factors reflects culture,
migration, income, demography, religion and
ideological views on basis of issues. The
awareness has been increased and laid special
emphasis on friendly fuels.
Technological
Presence of technological or innovative to
market such as:
Shortage of skill
Uncertainty over returns
1
Financial management is any activity that is concerned with procurement, planning and
controlling of all financial resources of any organisation (Finkler and et.al., 2016). In simple
words it can be said as applying management principles to financial resources in any company.
SK Innovation company that was founded in 1962 limited works through its different
subsidiaries all over the world in energy related business. It mostly operates in Refining and
marketing of petroleum Products, Petrochemicals and Production etc. This company is listed in
S&P Global BMI Index. This current project is a stock report of the SK Innovation Company
Limited in which valuation of stock and value of Equity is calculated as per different methods of
Valuation. The Report also presents the recommendations to investors regarding buy, hold or sell
of the Stock of SK Innovation.
MAIN BODY
PEST analysis
Political
The business of SK innovation is threatened
and directly influenced via political factor and
decision such as geopolitical situations in
middle east and presence of political stability.
Economical
The association among SK Innovation and
global economy is very important and there is
huge interaction among them. The economic
factors such as global economic crisis, over
debt private and public sector in many
countries of OECD. Presence of different
unfair transaction like violating ethics
regulations and laws, collusion.
Social
With context of these factors reflects culture,
migration, income, demography, religion and
ideological views on basis of issues. The
awareness has been increased and laid special
emphasis on friendly fuels.
Technological
Presence of technological or innovative to
market such as:
Shortage of skill
Uncertainty over returns
1
⊘ This is a preview!⊘
Do you want full access?
Subscribe today to unlock all pages.
Trusted by 1+ million students worldwide

Insufficient funding
Stringent regulations
Cost of development
Porter's 5 force
Threat of new entrants
There is requirement of huge capital.
Increment in internal competition within industry
Volatility in prices of oil and gases
Restrictions of international and national law which impacts new entrance of business
Threat of substitutes
There are presence of various alternative sources such as:
Coal
Hydrogen
Nuclear energy
Biofuels and other renewable sources
Bargaining power of suppliers
Its suppliers are highly integrated and active in whole value chain of gas and oil sector.
The features of suppliers are:
Serving national interests
Protection of territorial environment
Supports local economies
Bargaining power of buyers
The bargaining power of its buyers is relatively less because of nature of particular
industry. The main buyers are replicated as:
National oil companies
Distribution organizations
National oil companies
Traders
Internal oil and gas organizations
2
Paraphrase This Document
Need a fresh take? Get an instant paraphrase of this document with our AI Paraphraser
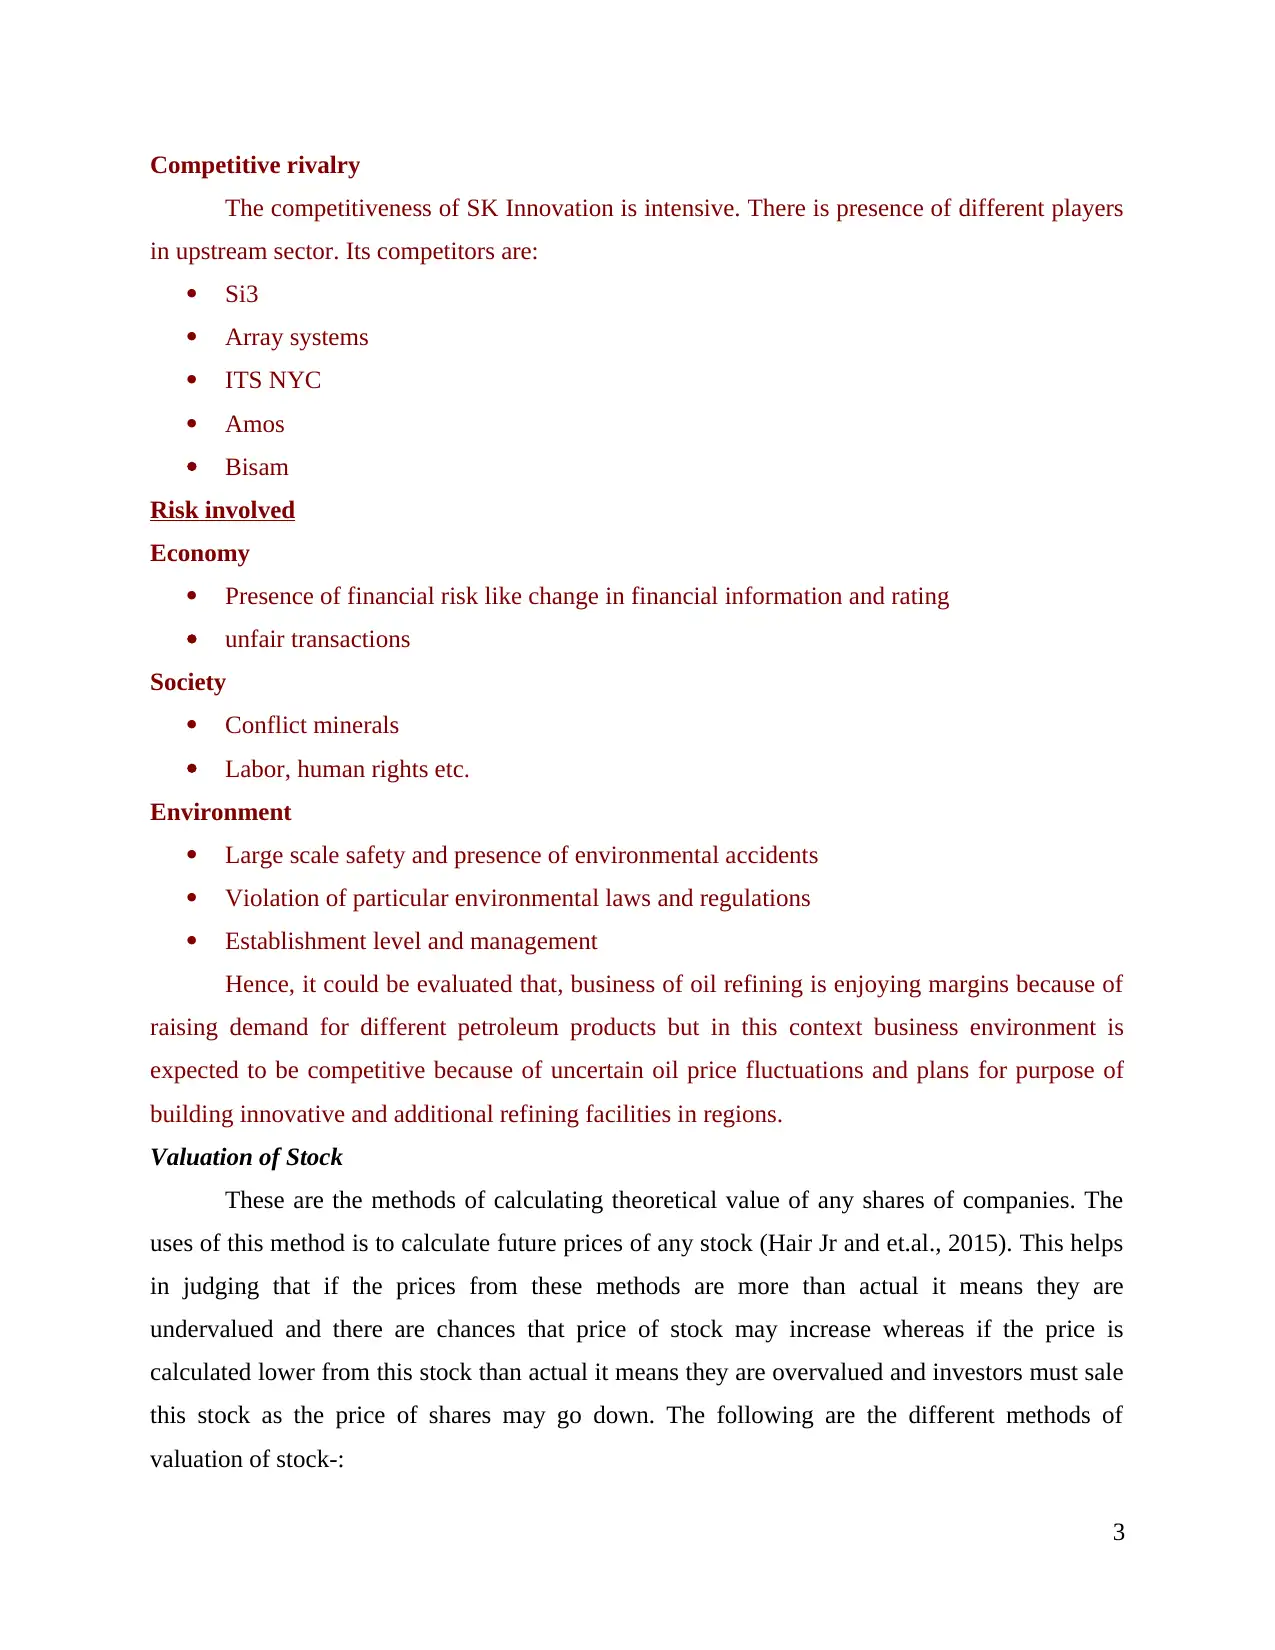
Competitive rivalry
The competitiveness of SK Innovation is intensive. There is presence of different players
in upstream sector. Its competitors are:
Si3
Array systems
ITS NYC
Amos
Bisam
Risk involved
Economy
Presence of financial risk like change in financial information and rating
unfair transactions
Society
Conflict minerals
Labor, human rights etc.
Environment
Large scale safety and presence of environmental accidents
Violation of particular environmental laws and regulations
Establishment level and management
Hence, it could be evaluated that, business of oil refining is enjoying margins because of
raising demand for different petroleum products but in this context business environment is
expected to be competitive because of uncertain oil price fluctuations and plans for purpose of
building innovative and additional refining facilities in regions.
Valuation of Stock
These are the methods of calculating theoretical value of any shares of companies. The
uses of this method is to calculate future prices of any stock (Hair Jr and et.al., 2015). This helps
in judging that if the prices from these methods are more than actual it means they are
undervalued and there are chances that price of stock may increase whereas if the price is
calculated lower from this stock than actual it means they are overvalued and investors must sale
this stock as the price of shares may go down. The following are the different methods of
valuation of stock-:
3

1. Net Asset Value Method (NAV) – It represents the Net worth of any company and is
calculated after reduction of preference share capital form the value of company. The
NAV of any represents per unit share price at an specific date or any time. In the context
of this method NAV of share is calculated as by deducting liabilities from total assets
and the difference is the Net worth of the Company (Brealey, Myers and Marcus, 2016).
The following is formula for calculating NAV for Equity shareholders-:
Net Assets Value = Assets – Liabilities (Total Liabilities – Preference Capital)/ Total No. Of
Equity Shares.
2. Dividend Discounted Model (DDM) – This method also calculated price of any stock by
discounting of dividends that are predicted to there present value. In simple words it
means that it is method of valuation that is based upon the theory that price of share is
sum of all its future dividends that are discounted back to present value(Penman, 2014).
The mostly used method in for Dividend Discount Model is given by Gordon Growth
Model.
The Gordon has taken following assumptions for calculating price of Stock-:
1. That model of company business is stable and there are no important changes in
operations(Penman, 2015).
2. The growth of any company will always be constant.
3. Financial Leverage of organisation is stable.
4. Cash Flow that are free will be paid as dividend.
Two Stages Growth Model under Dividend Discount Models
This model takes two stages of growth where the first one is higher growth rate and
second stage is always assumed as that growth rate is Stable. This model is used to value the
stock of companies where the growth is unstable in the beginning and afterwords growth rates
becomes stable. In the first stages there are chances that growth may be volatile and it can be
positive or negative (Cheung, Hu and Schwiebert, 2018). In this model it is assumed that the
dividend paid by nay company grows with exact growth rates.
4
⊘ This is a preview!⊘
Do you want full access?
Subscribe today to unlock all pages.
Trusted by 1+ million students worldwide
The Interpretation of two stage dividend discount model is that if stock price of any
company is lower via this model it states that price of stock is undervalued and there are chance
that company may grow and vice versa in another situation.
Criticisms of Dividend Discount Model-:
1. The measurement for defining the first stage is major and difficult task a shorter is the 1 st
stage, price of stock may be undervalued and vice versa.
2. Assuming that there will be higher growth in first stage and afterwords growth is stable,
that may not be correct in real world (Kumar, 2015).
Free Cash Flow to Equity (FCFE) Model
This one is also and Discounted Cash Flow Method of valuation for calculating Fair
Value of Stock. This measures that how much cash is available for equity shareholders after
deducting all expenses, debt, reinvestment are paid (Barr and McClellan, 2018).
The Calculation of FCFE starts with calculation of Free cash flow of Equity that is
calculated by following formula-:
FCFE = Net Income + Depreciation and Amortization + Changes in Working Capital + Net
Borrowings – Capital Expenditures . Where
1. Net Income - After payment of all interest expenses.
2. Depreciation and Amortization – All the non cash expenses are added back are added
back
3. Changes in Working Capital – this can be either outflow or inflow so it can be added
back or also can be deducted.
4. Net Borrowings – This can be also outflow or inflow as these can be borrowed new and
also repaid so it can also be added or subtracted as per the nature (Free Cash Flow
Model, 2018.).
The Value of Equity Through this Model is calculated as
Value of Equity = Free Flow cash of Equity (that had been calculated from above
formula) / (r-g)
Where,
r = Cost of Equity
g = growth rate
5
Paraphrase This Document
Need a fresh take? Get an instant paraphrase of this document with our AI Paraphraser
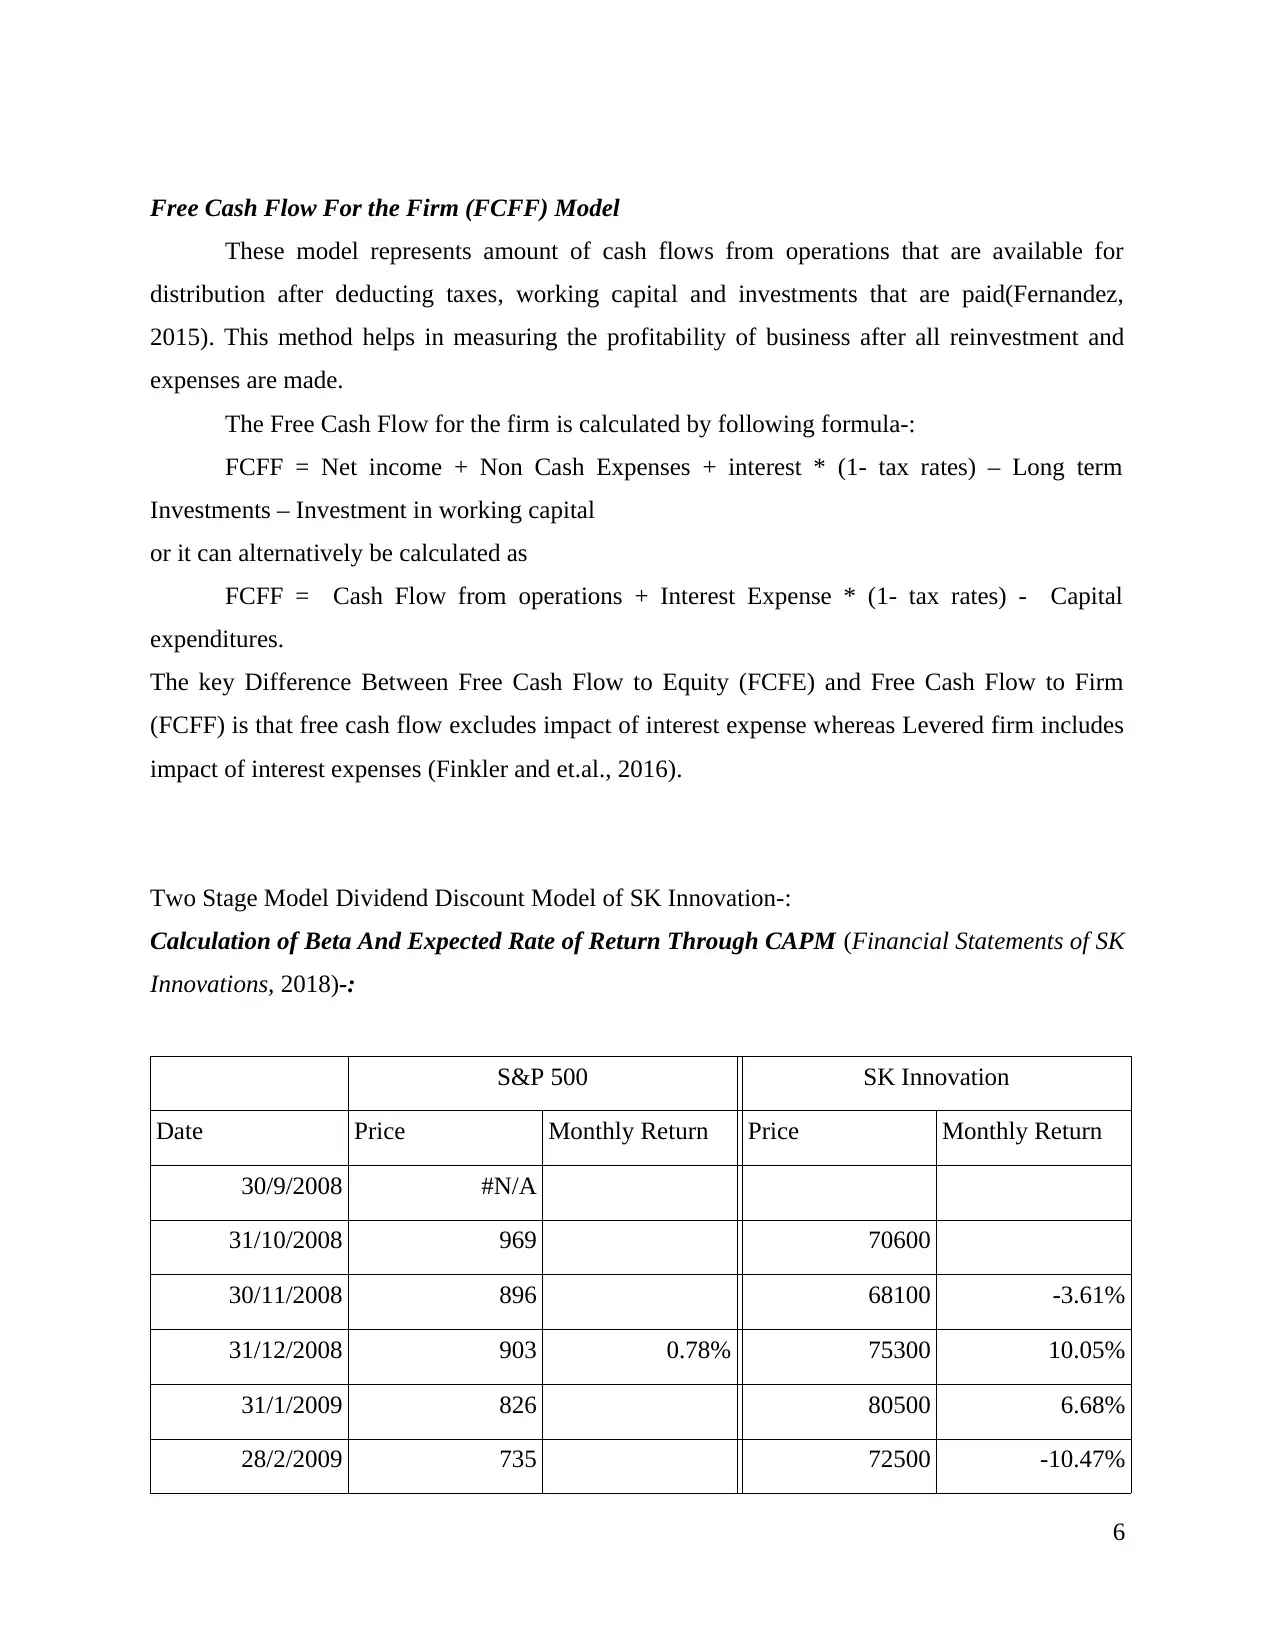
Free Cash Flow For the Firm (FCFF) Model
These model represents amount of cash flows from operations that are available for
distribution after deducting taxes, working capital and investments that are paid(Fernandez,
2015). This method helps in measuring the profitability of business after all reinvestment and
expenses are made.
The Free Cash Flow for the firm is calculated by following formula-:
FCFF = Net income + Non Cash Expenses + interest * (1- tax rates) – Long term
Investments – Investment in working capital
or it can alternatively be calculated as
FCFF = Cash Flow from operations + Interest Expense * (1- tax rates) - Capital
expenditures.
The key Difference Between Free Cash Flow to Equity (FCFE) and Free Cash Flow to Firm
(FCFF) is that free cash flow excludes impact of interest expense whereas Levered firm includes
impact of interest expenses (Finkler and et.al., 2016).
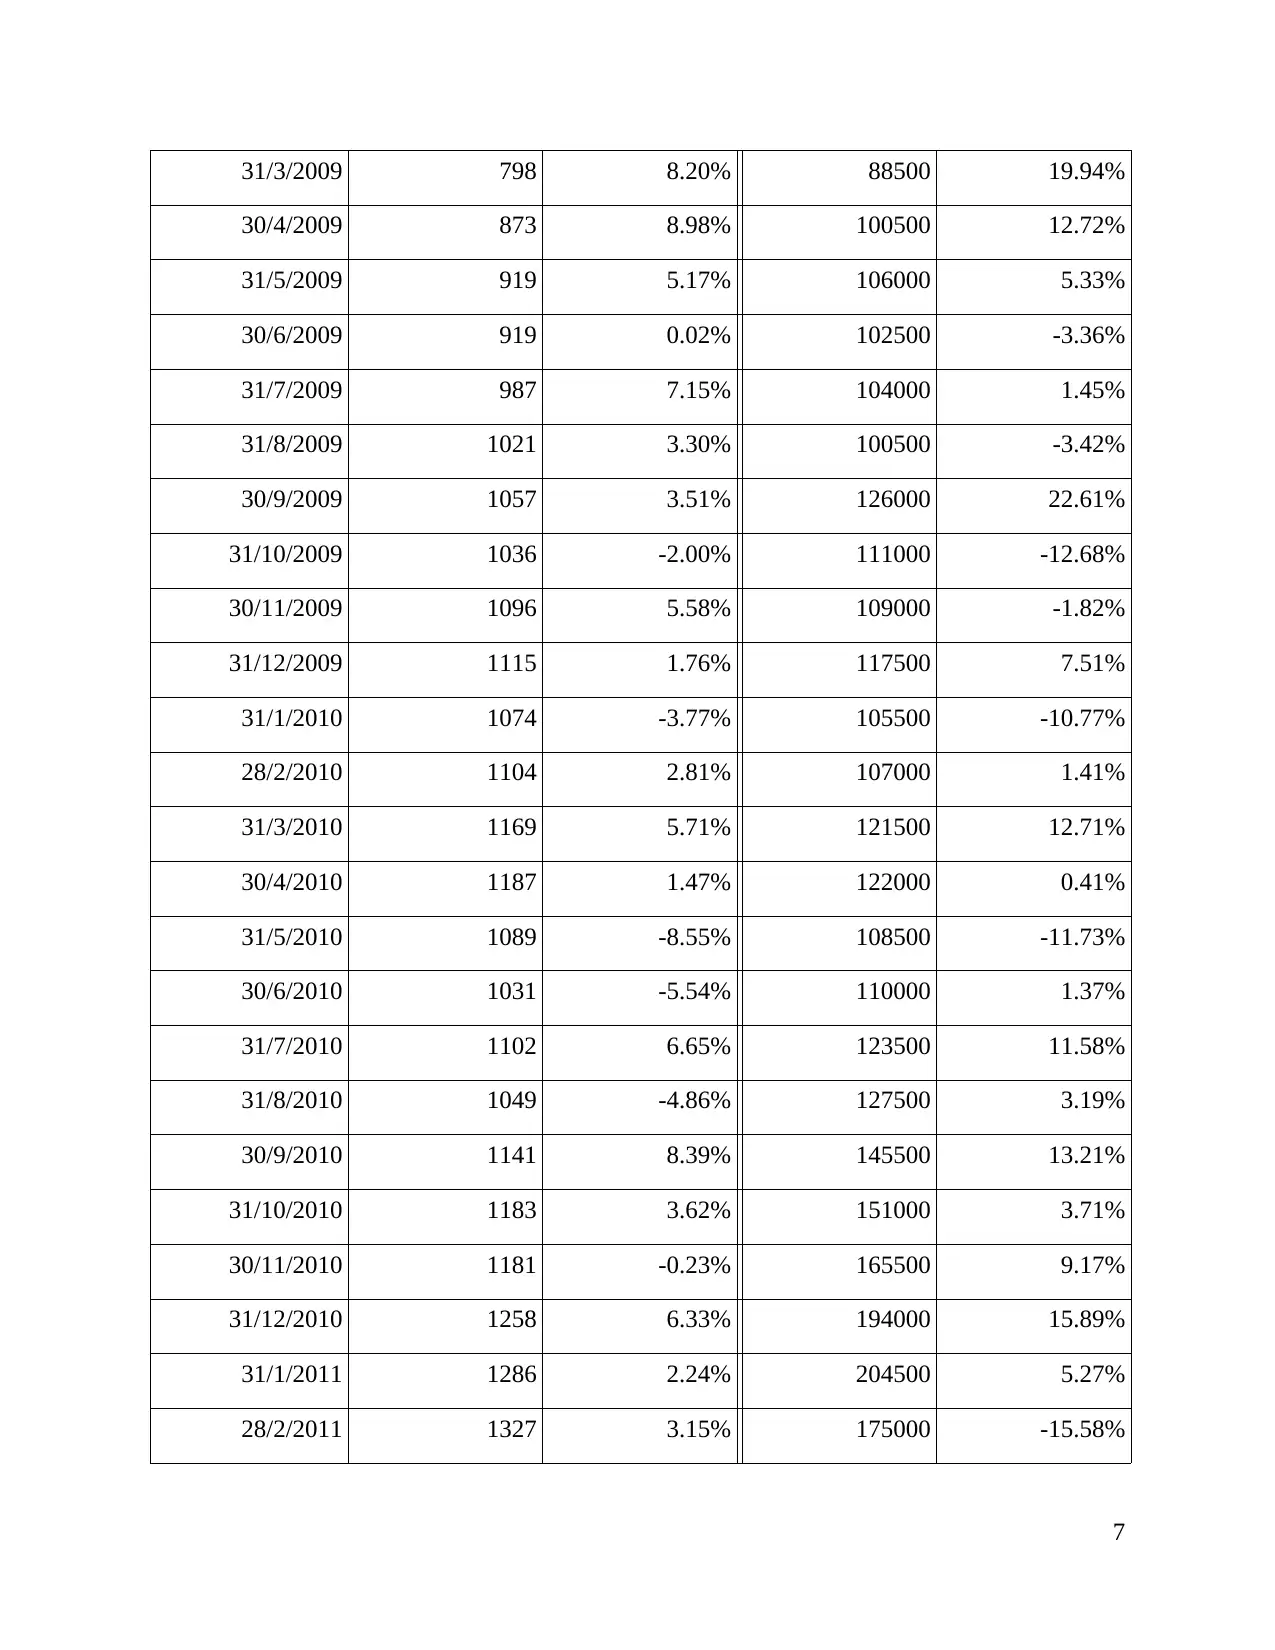
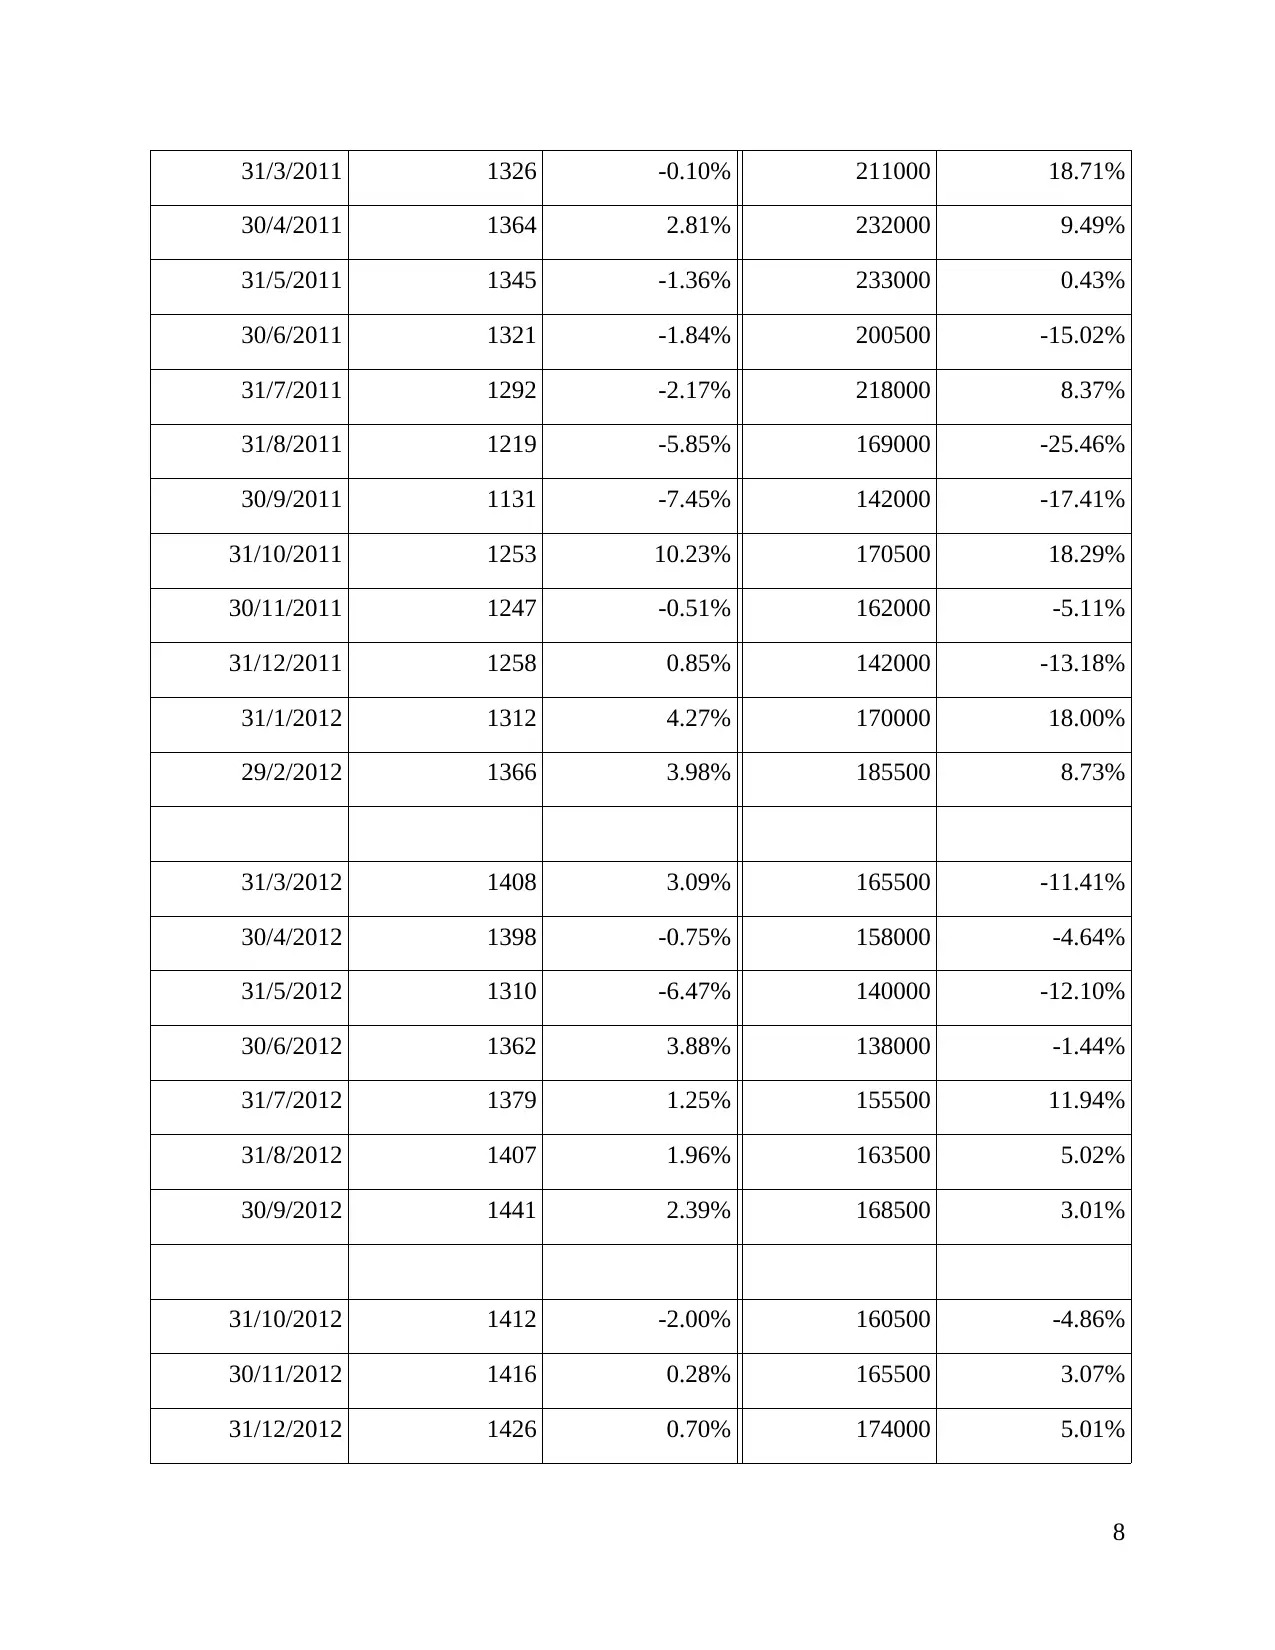
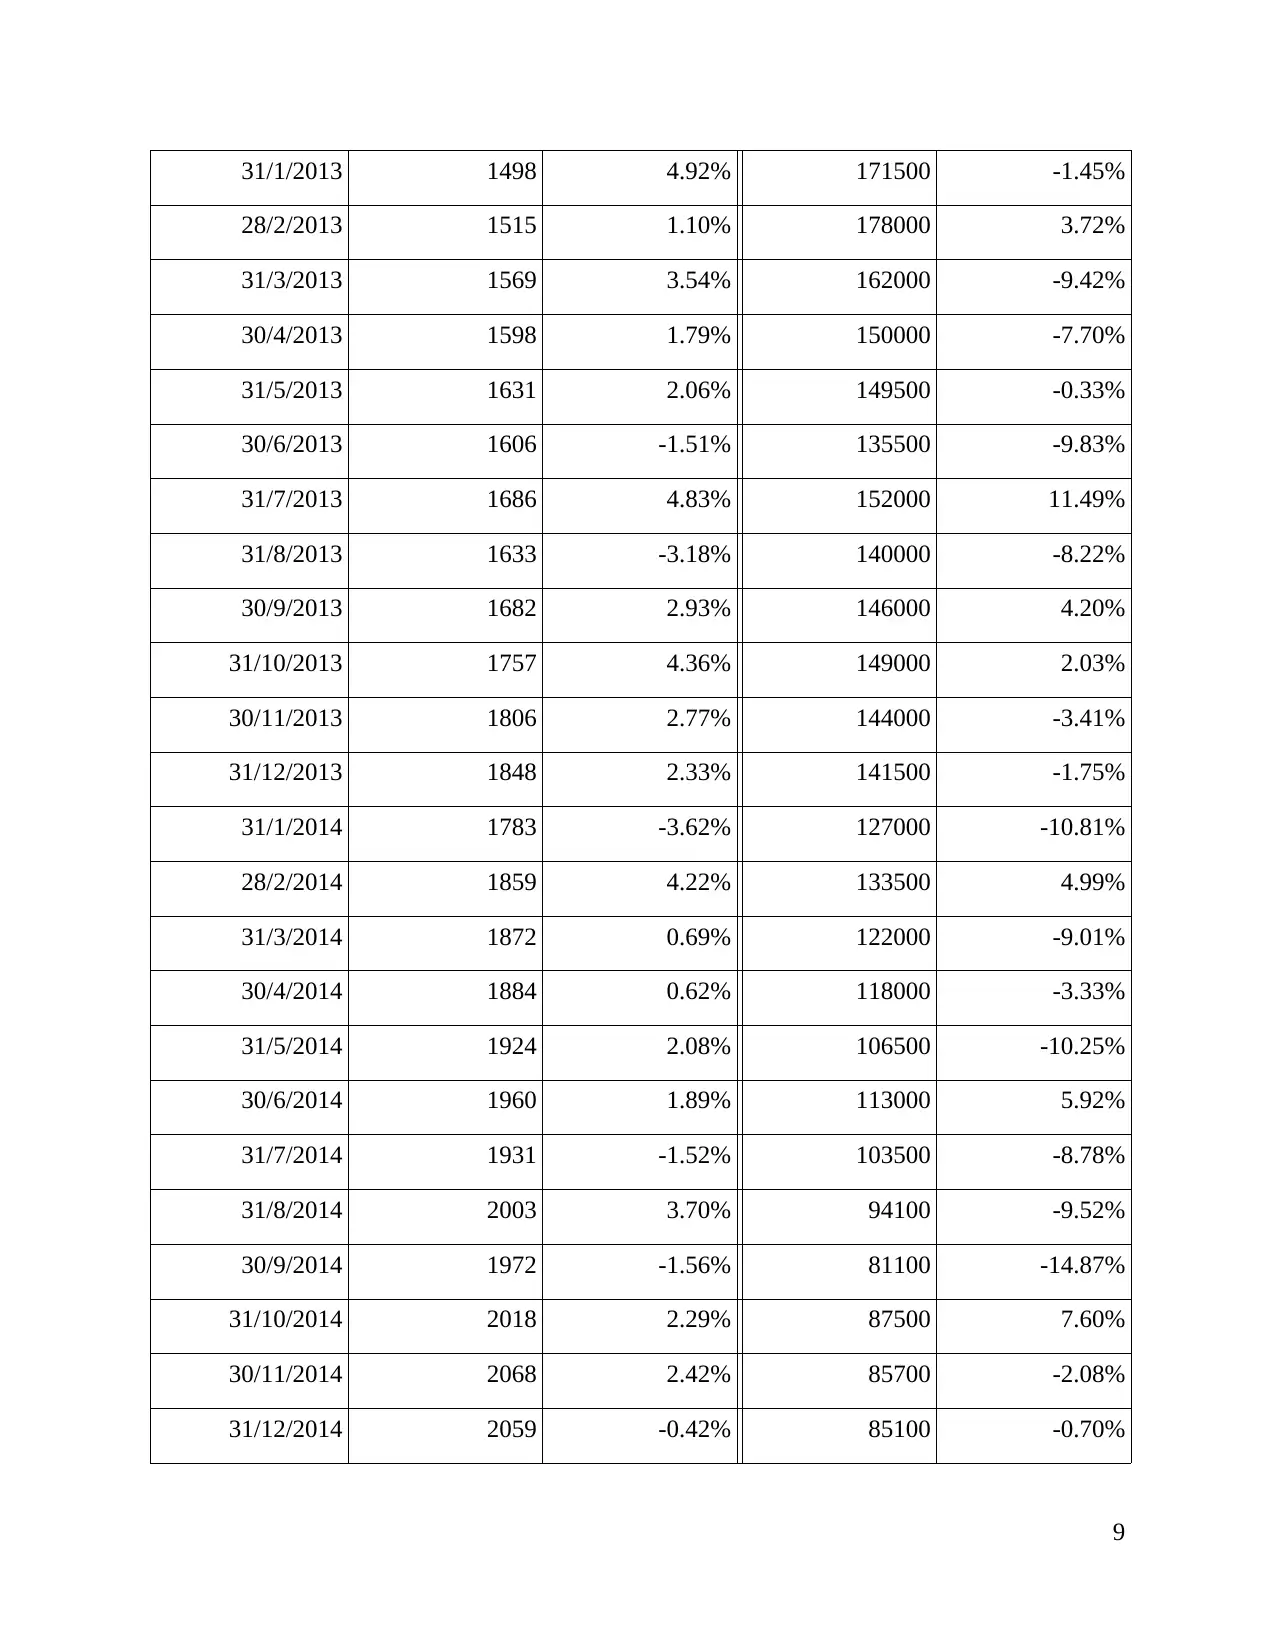
Two Stage Model Dividend Discount Model of SK Innovation-:
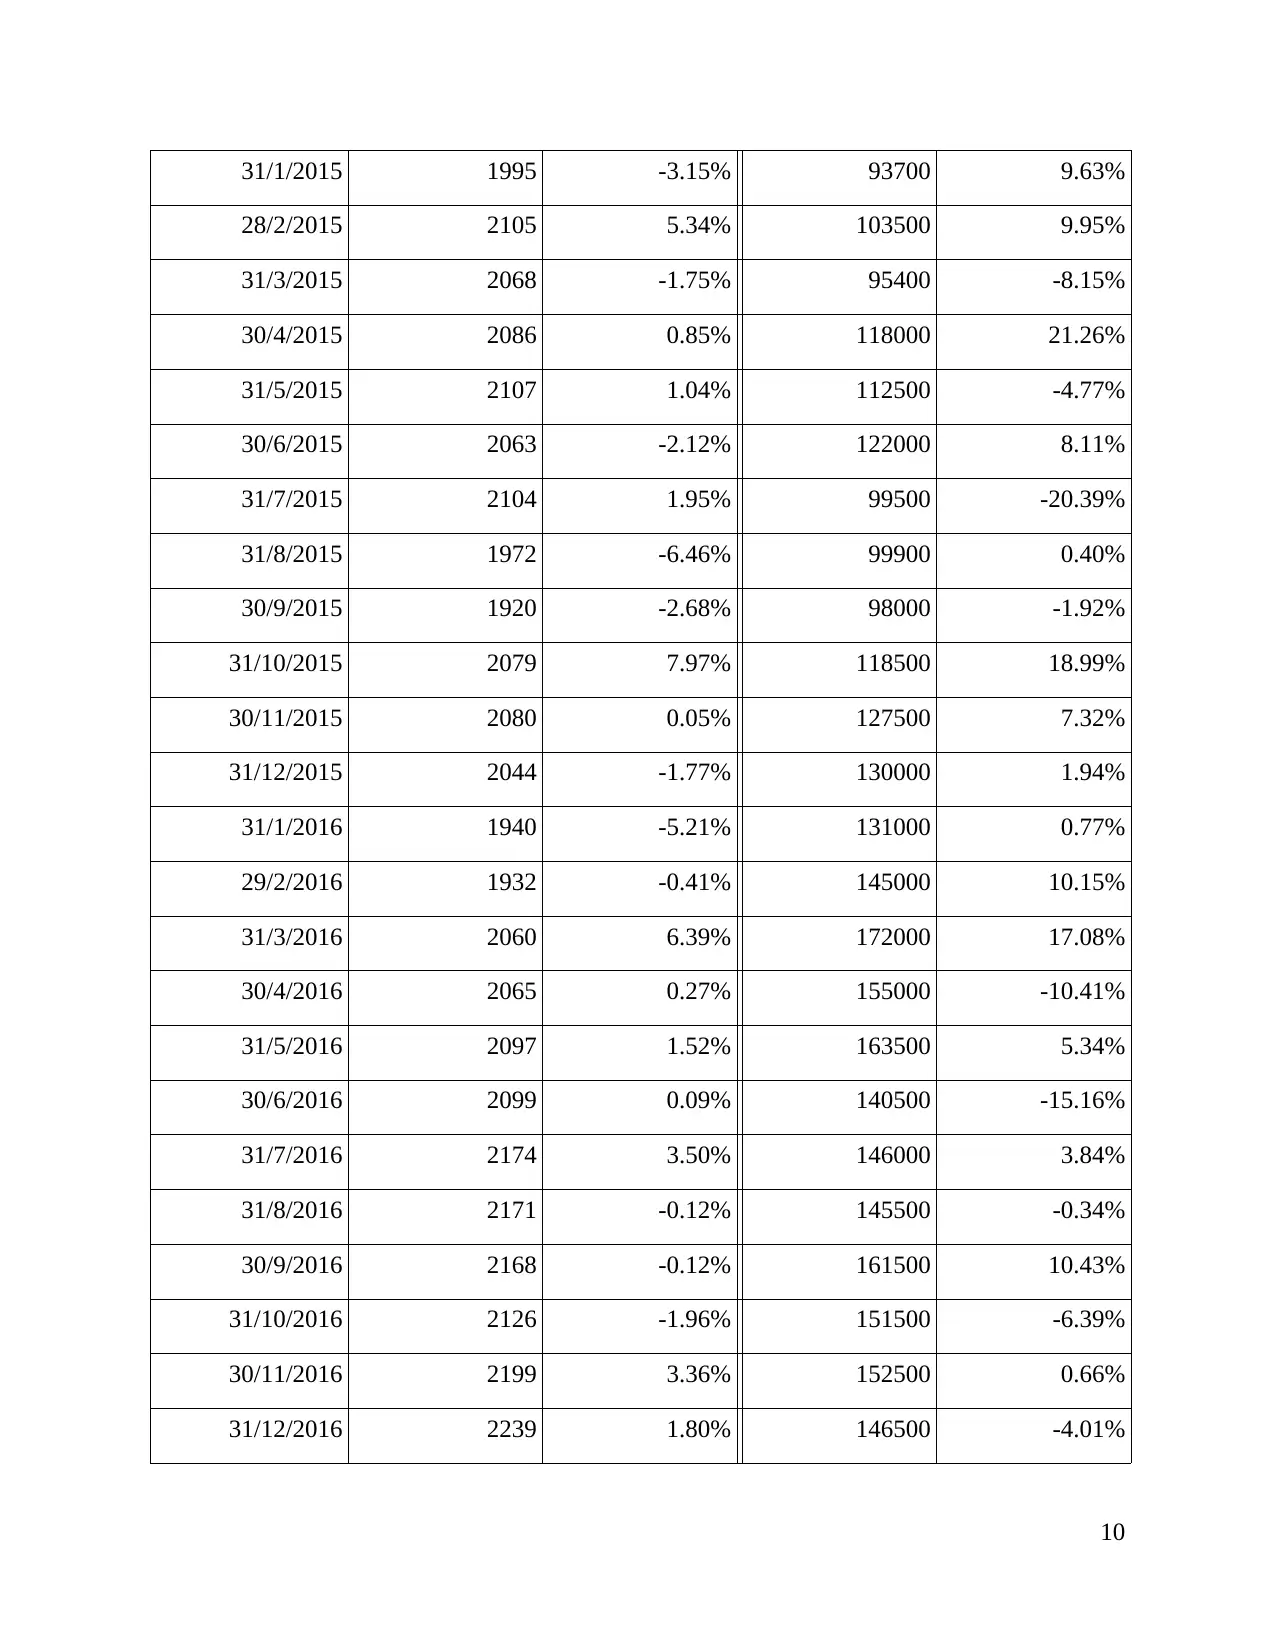
Calculation of Beta And Expected Rate of Return Through CAPM (Financial Statements of SK
Innovations, 2018)-:
S&P 500 SK Innovation
Date Price Monthly Return Price Monthly Return
30/9/2008 #N/A
31/10/2008 969 70600
30/11/2008 896 68100 -3.61%
31/12/2008 903 0.78% 75300 10.05%
31/1/2009 826 80500 6.68%
28/2/2009 735 72500 -10.47%
6
These model represents amount of cash flows from operations that are available for
distribution after deducting taxes, working capital and investments that are paid(Fernandez,
2015). This method helps in measuring the profitability of business after all reinvestment and
expenses are made.
The Free Cash Flow for the firm is calculated by following formula-:
FCFF = Net income + Non Cash Expenses + interest * (1- tax rates) – Long term
Investments – Investment in working capital
or it can alternatively be calculated as
FCFF = Cash Flow from operations + Interest Expense * (1- tax rates) - Capital
expenditures.
The key Difference Between Free Cash Flow to Equity (FCFE) and Free Cash Flow to Firm
(FCFF) is that free cash flow excludes impact of interest expense whereas Levered firm includes
impact of interest expenses (Finkler and et.al., 2016).
Two Stage Model Dividend Discount Model of SK Innovation-:
Calculation of Beta And Expected Rate of Return Through CAPM (Financial Statements of SK
Innovations, 2018)-:
S&P 500 SK Innovation
Date Price Monthly Return Price Monthly Return
30/9/2008 #N/A
31/10/2008 969 70600
30/11/2008 896 68100 -3.61%
31/12/2008 903 0.78% 75300 10.05%
31/1/2009 826 80500 6.68%
28/2/2009 735 72500 -10.47%
6
31/3/2009 798 8.20% 88500 19.94%
30/4/2009 873 8.98% 100500 12.72%
31/5/2009 919 5.17% 106000 5.33%
30/6/2009 919 0.02% 102500 -3.36%
31/7/2009 987 7.15% 104000 1.45%
31/8/2009 1021 3.30% 100500 -3.42%
30/9/2009 1057 3.51% 126000 22.61%
31/10/2009 1036 -2.00% 111000 -12.68%
30/11/2009 1096 5.58% 109000 -1.82%
31/12/2009 1115 1.76% 117500 7.51%
31/1/2010 1074 -3.77% 105500 -10.77%
28/2/2010 1104 2.81% 107000 1.41%
31/3/2010 1169 5.71% 121500 12.71%
30/4/2010 1187 1.47% 122000 0.41%
31/5/2010 1089 -8.55% 108500 -11.73%
30/6/2010 1031 -5.54% 110000 1.37%
31/7/2010 1102 6.65% 123500 11.58%
31/8/2010 1049 -4.86% 127500 3.19%
30/9/2010 1141 8.39% 145500 13.21%
31/10/2010 1183 3.62% 151000 3.71%
30/11/2010 1181 -0.23% 165500 9.17%
31/12/2010 1258 6.33% 194000 15.89%
31/1/2011 1286 2.24% 204500 5.27%
28/2/2011 1327 3.15% 175000 -15.58%
7
⊘ This is a preview!⊘
Do you want full access?
Subscribe today to unlock all pages.
Trusted by 1+ million students worldwide
31/3/2011 1326 -0.10% 211000 18.71%
30/4/2011 1364 2.81% 232000 9.49%
31/5/2011 1345 -1.36% 233000 0.43%
30/6/2011 1321 -1.84% 200500 -15.02%
31/7/2011 1292 -2.17% 218000 8.37%
31/8/2011 1219 -5.85% 169000 -25.46%
30/9/2011 1131 -7.45% 142000 -17.41%
31/10/2011 1253 10.23% 170500 18.29%
30/11/2011 1247 -0.51% 162000 -5.11%
31/12/2011 1258 0.85% 142000 -13.18%
31/1/2012 1312 4.27% 170000 18.00%
29/2/2012 1366 3.98% 185500 8.73%
31/3/2012 1408 3.09% 165500 -11.41%
30/4/2012 1398 -0.75% 158000 -4.64%
31/5/2012 1310 -6.47% 140000 -12.10%
30/6/2012 1362 3.88% 138000 -1.44%
31/7/2012 1379 1.25% 155500 11.94%
31/8/2012 1407 1.96% 163500 5.02%
30/9/2012 1441 2.39% 168500 3.01%
31/10/2012 1412 -2.00% 160500 -4.86%
30/11/2012 1416 0.28% 165500 3.07%
31/12/2012 1426 0.70% 174000 5.01%
8
Paraphrase This Document
Need a fresh take? Get an instant paraphrase of this document with our AI Paraphraser
31/1/2013 1498 4.92% 171500 -1.45%
28/2/2013 1515 1.10% 178000 3.72%
31/3/2013 1569 3.54% 162000 -9.42%
30/4/2013 1598 1.79% 150000 -7.70%
31/5/2013 1631 2.06% 149500 -0.33%
30/6/2013 1606 -1.51% 135500 -9.83%
31/7/2013 1686 4.83% 152000 11.49%
31/8/2013 1633 -3.18% 140000 -8.22%
30/9/2013 1682 2.93% 146000 4.20%
31/10/2013 1757 4.36% 149000 2.03%
30/11/2013 1806 2.77% 144000 -3.41%
31/12/2013 1848 2.33% 141500 -1.75%
31/1/2014 1783 -3.62% 127000 -10.81%
28/2/2014 1859 4.22% 133500 4.99%
31/3/2014 1872 0.69% 122000 -9.01%
30/4/2014 1884 0.62% 118000 -3.33%
31/5/2014 1924 2.08% 106500 -10.25%
30/6/2014 1960 1.89% 113000 5.92%
31/7/2014 1931 -1.52% 103500 -8.78%
31/8/2014 2003 3.70% 94100 -9.52%
30/9/2014 1972 -1.56% 81100 -14.87%
31/10/2014 2018 2.29% 87500 7.60%
30/11/2014 2068 2.42% 85700 -2.08%
31/12/2014 2059 -0.42% 85100 -0.70%
9
31/1/2015 1995 -3.15% 93700 9.63%
28/2/2015 2105 5.34% 103500 9.95%
31/3/2015 2068 -1.75% 95400 -8.15%
30/4/2015 2086 0.85% 118000 21.26%
31/5/2015 2107 1.04% 112500 -4.77%
30/6/2015 2063 -2.12% 122000 8.11%
31/7/2015 2104 1.95% 99500 -20.39%
31/8/2015 1972 -6.46% 99900 0.40%
30/9/2015 1920 -2.68% 98000 -1.92%
31/10/2015 2079 7.97% 118500 18.99%
30/11/2015 2080 0.05% 127500 7.32%
31/12/2015 2044 -1.77% 130000 1.94%
31/1/2016 1940 -5.21% 131000 0.77%
29/2/2016 1932 -0.41% 145000 10.15%
31/3/2016 2060 6.39% 172000 17.08%
30/4/2016 2065 0.27% 155000 -10.41%
31/5/2016 2097 1.52% 163500 5.34%
30/6/2016 2099 0.09% 140500 -15.16%
31/7/2016 2174 3.50% 146000 3.84%
31/8/2016 2171 -0.12% 145500 -0.34%
30/9/2016 2168 -0.12% 161500 10.43%
31/10/2016 2126 -1.96% 151500 -6.39%
30/11/2016 2199 3.36% 152500 0.66%
31/12/2016 2239 1.80% 146500 -4.01%
10
⊘ This is a preview!⊘
Do you want full access?
Subscribe today to unlock all pages.
Trusted by 1+ million students worldwide
1 out of 18
Related Documents


Your All-in-One AI-Powered Toolkit for Academic Success.
+13062052269
info@desklib.com
Available 24*7 on WhatsApp / Email
![[object Object]](/_next/static/media/star-bottom.7253800d.svg)
Unlock your academic potential
Copyright © 2020–2026 A2Z Services. All Rights Reserved. Developed and managed by ZUCOL.