Skin Elements Limited Financial Analysis Report: BUS106, Semester 2
VerifiedAdded on 2022/12/12
|10
|2186
|220
Report
AI Summary
This report provides a comprehensive analysis of Skin Elements Limited's financial performance over a three-year period, focusing on profitability, liquidity, efficiency, and solvency. The analysis includes trend analysis of key financial metrics such as revenue, gross profit, and expenses. Ratio analysis is conducted, including return on assets, return on equity, debt to equity ratio, current ratio, and asset turnover ratio, to assess the company's financial health. The report identifies a trend of increasing sales but decreasing profitability due to rising expenses. The analysis reveals negative returns on assets and equity, a concerning debt-to-equity ratio, and fluctuations in liquidity and efficiency. Based on these findings, the report concludes with recommendations for improving the company's financial performance, emphasizing the need to reduce expenses and consider raising funds through equity rather than debt.
Running head: ACCOUNTING FOR BUSINESS
Accounting for business
Name of the student
Name of the university
Student ID
Author note
Accounting for business
Name of the student
Name of the university
Student ID
Author note
Paraphrase This Document
Need a fresh take? Get an instant paraphrase of this document with our AI Paraphraser
1ACCOUNTING FOR BUSINESS
Executive summary
Aim of the task is to analyse the performance of ASX listed entity Skin Elements Limited.
The task will consider the company’s financial performance over the last 3 years in context of
its profitability, liquidity, efficiency and solvency position. For analysing its financial
performance, the same will be measured though conducting various ratios analyses those will
be able to focus on the entity’s profitability, liquidity, efficiency and solvency position. Based
on the performance suggestion will be provided regarding how its financial performances can
be improved.
2ACCOUNTING FOR BUSINESS
Table of Contents
1.0 Introduction..........................................................................................................................3
1.1 Purpose.............................................................................................................................3
1.2 Scope................................................................................................................................3
1.3 Imitations..........................................................................................................................3
2.0 Company overview..............................................................................................................3
3.0 Trend analysis......................................................................................................................4
4.0 Ratio analysis.......................................................................................................................5
4.1 return on assets.................................................................................................................5
a) Ratio calculation............................................................................................................5
b) Analysis.........................................................................................................................5
4.2 Return on equity...............................................................................................................5
a) Ratio calculation............................................................................................................5
b) Analysis.........................................................................................................................5
4.3 Debt to equity ratio...........................................................................................................6
a) Ratio calculation............................................................................................................6
b) Analysis.........................................................................................................................6
4.4 Current ratio / working capital.........................................................................................6
a) Ratio calculation............................................................................................................6
b) Analysis.........................................................................................................................6
4.5 Asset turnover ratio..........................................................................................................7
a) Ratio calculation............................................................................................................7
b) Analysis.........................................................................................................................7
5.0 Conclusions..........................................................................................................................7
6.0 Recommendations................................................................................................................7
References..................................................................................................................................8
⊘ This is a preview!⊘
Do you want full access?
Subscribe today to unlock all pages.
Trusted by 1+ million students worldwide
3ACCOUNTING FOR BUSINESS
Paraphrase This Document
Need a fresh take? Get an instant paraphrase of this document with our AI Paraphraser
4ACCOUNTING FOR BUSINESS
1.0 Introduction
1.1 Purpose
Main purpose of the task is to focussing on the performance of Skin Elements Limited
that is listed under ASX. The task will consider the company’s financial performance over
the last 3 years in context of its profitability, liquidity, efficiency and solvency position.
Based on the performance suggestion will be provided regarding how its financial
performances can be improved.
1.2 Scope
For analysing its financial performance, the same will be measured though conducting
various ratios analyses those will be able to focus on the entity’s profitability, liquidity,
efficiency and solvency position. In addition to that its sales, gross profit, major expenses and
net profit or loss trends will be analysed to get better insight regarding its performances.
1.3 Imitations
However, ratio analyses only consider the past performances and hence fail to provide
any solid insight regarding its future performance. Further it does not consider the economic
condition, industry position; competitors and market demand those have great impact on the
performance of the company.
2.0 Company overview
Skin Elements Limited is the skin care entity that is engaged in developing as well as
commercializing the organic as well as natural products associated to skin care. It was
founded in the year 2015 and belongs to the category of cosmetics, health care industry. The
entity is primarily focussed on developing, selling and producing the skin care products. It
aims in providing the consumers with the quality products related to skin care through using
the organic as well as natural ingredients as against the synthetic products based on chemicals
(Skinelementslimited.com 2019)
5ACCOUNTING FOR BUSINESS
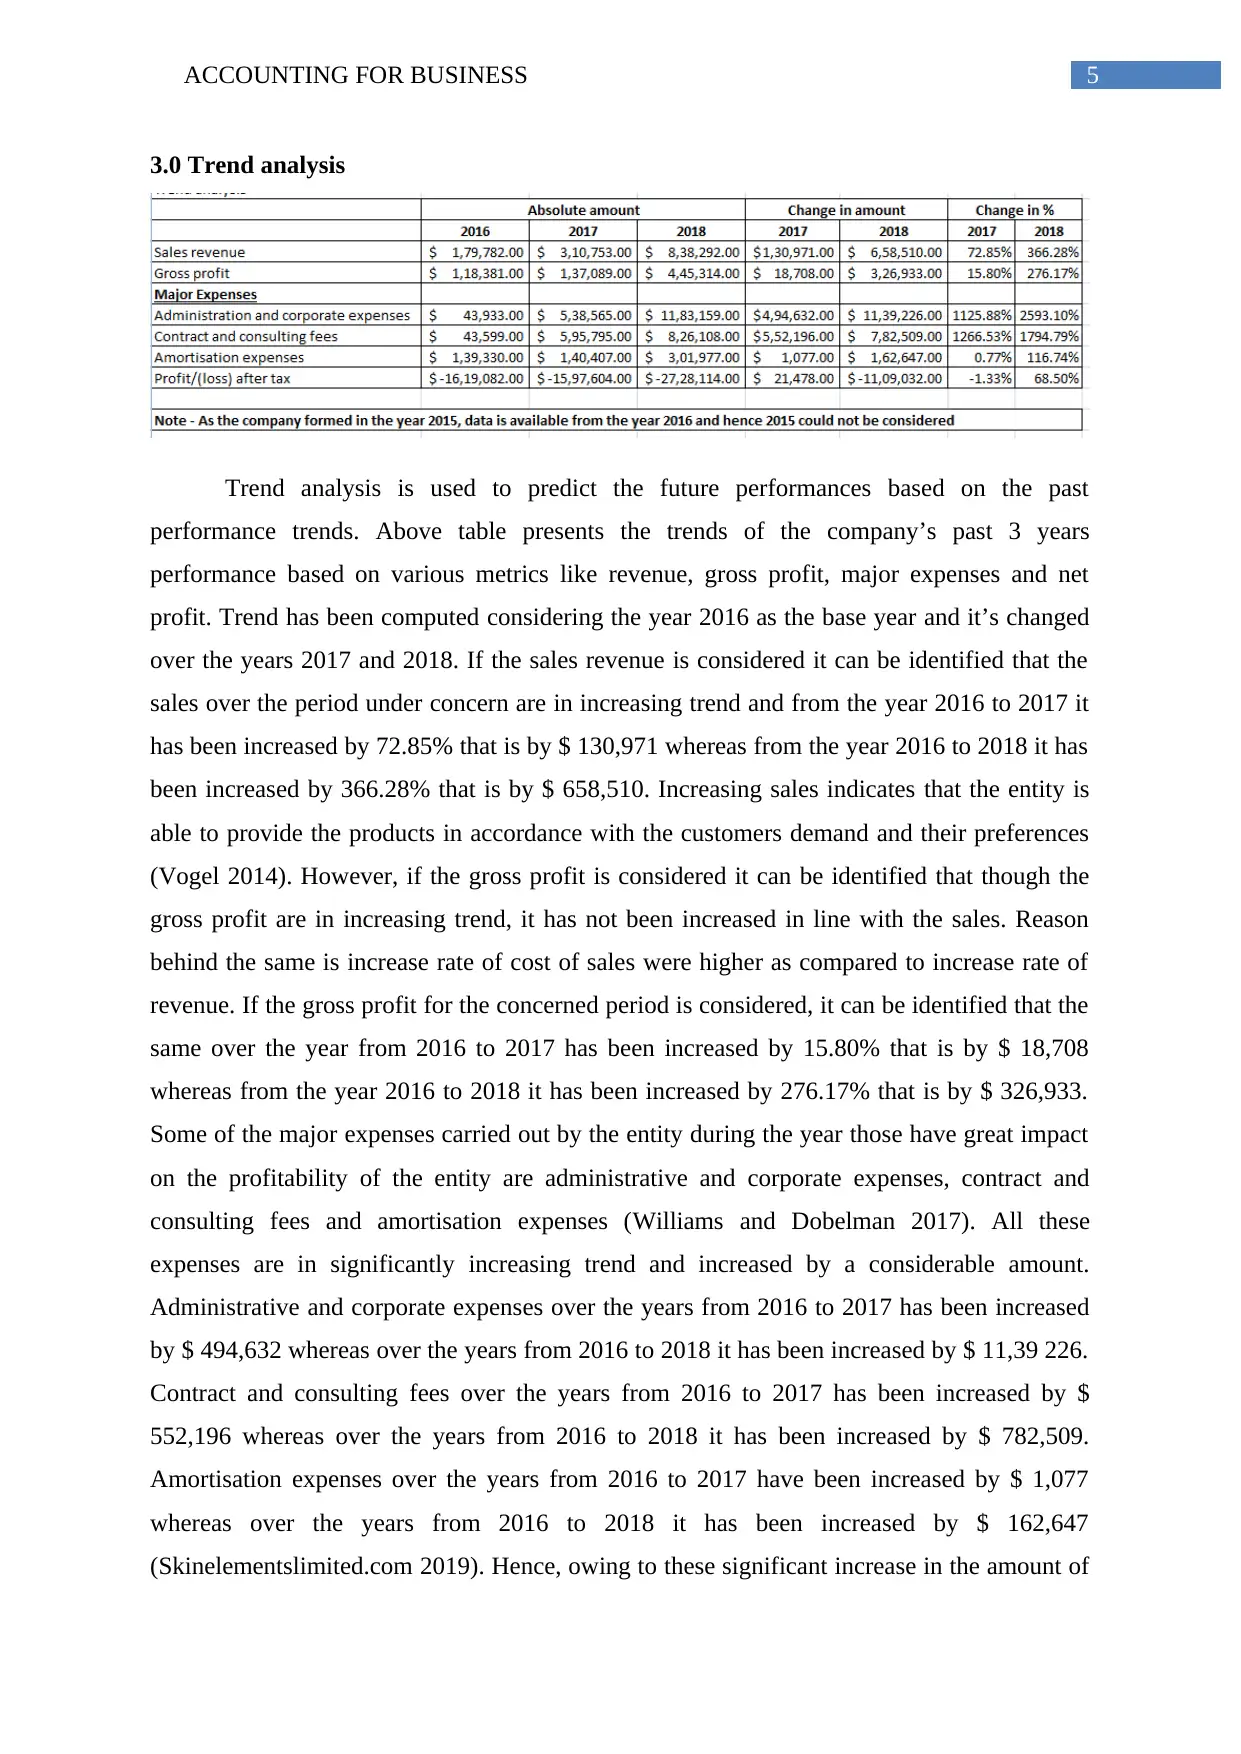
3.0 Trend analysis
Trend analysis is used to predict the future performances based on the past
performance trends. Above table presents the trends of the company’s past 3 years
performance based on various metrics like revenue, gross profit, major expenses and net
profit. Trend has been computed considering the year 2016 as the base year and it’s changed
over the years 2017 and 2018. If the sales revenue is considered it can be identified that the
sales over the period under concern are in increasing trend and from the year 2016 to 2017 it
has been increased by 72.85% that is by $ 130,971 whereas from the year 2016 to 2018 it has
been increased by 366.28% that is by $ 658,510. Increasing sales indicates that the entity is
able to provide the products in accordance with the customers demand and their preferences
(Vogel 2014). However, if the gross profit is considered it can be identified that though the
gross profit are in increasing trend, it has not been increased in line with the sales. Reason
behind the same is increase rate of cost of sales were higher as compared to increase rate of
revenue. If the gross profit for the concerned period is considered, it can be identified that the
same over the year from 2016 to 2017 has been increased by 15.80% that is by $ 18,708
whereas from the year 2016 to 2018 it has been increased by 276.17% that is by $ 326,933.
Some of the major expenses carried out by the entity during the year those have great impact
on the profitability of the entity are administrative and corporate expenses, contract and
consulting fees and amortisation expenses (Williams and Dobelman 2017). All these
expenses are in significantly increasing trend and increased by a considerable amount.
Administrative and corporate expenses over the years from 2016 to 2017 has been increased
by $ 494,632 whereas over the years from 2016 to 2018 it has been increased by $ 11,39 226.
Contract and consulting fees over the years from 2016 to 2017 has been increased by $
552,196 whereas over the years from 2016 to 2018 it has been increased by $ 782,509.
Amortisation expenses over the years from 2016 to 2017 have been increased by $ 1,077
whereas over the years from 2016 to 2018 it has been increased by $ 162,647
(Skinelementslimited.com 2019). Hence, owing to these significant increase in the amount of
⊘ This is a preview!⊘
Do you want full access?
Subscribe today to unlock all pages.
Trusted by 1+ million students worldwide
6ACCOUNTING FOR BUSINESS
expenses, irrespective of increasing trend of gross profit, the entity for all the 3 years under
concern could not generate any profit after tax and the loss over 2016 to 2018 has been
increased by $ 11, 09,032 that is by 68.50% (Robinson et al. 2015).
4.0 Ratio analysis
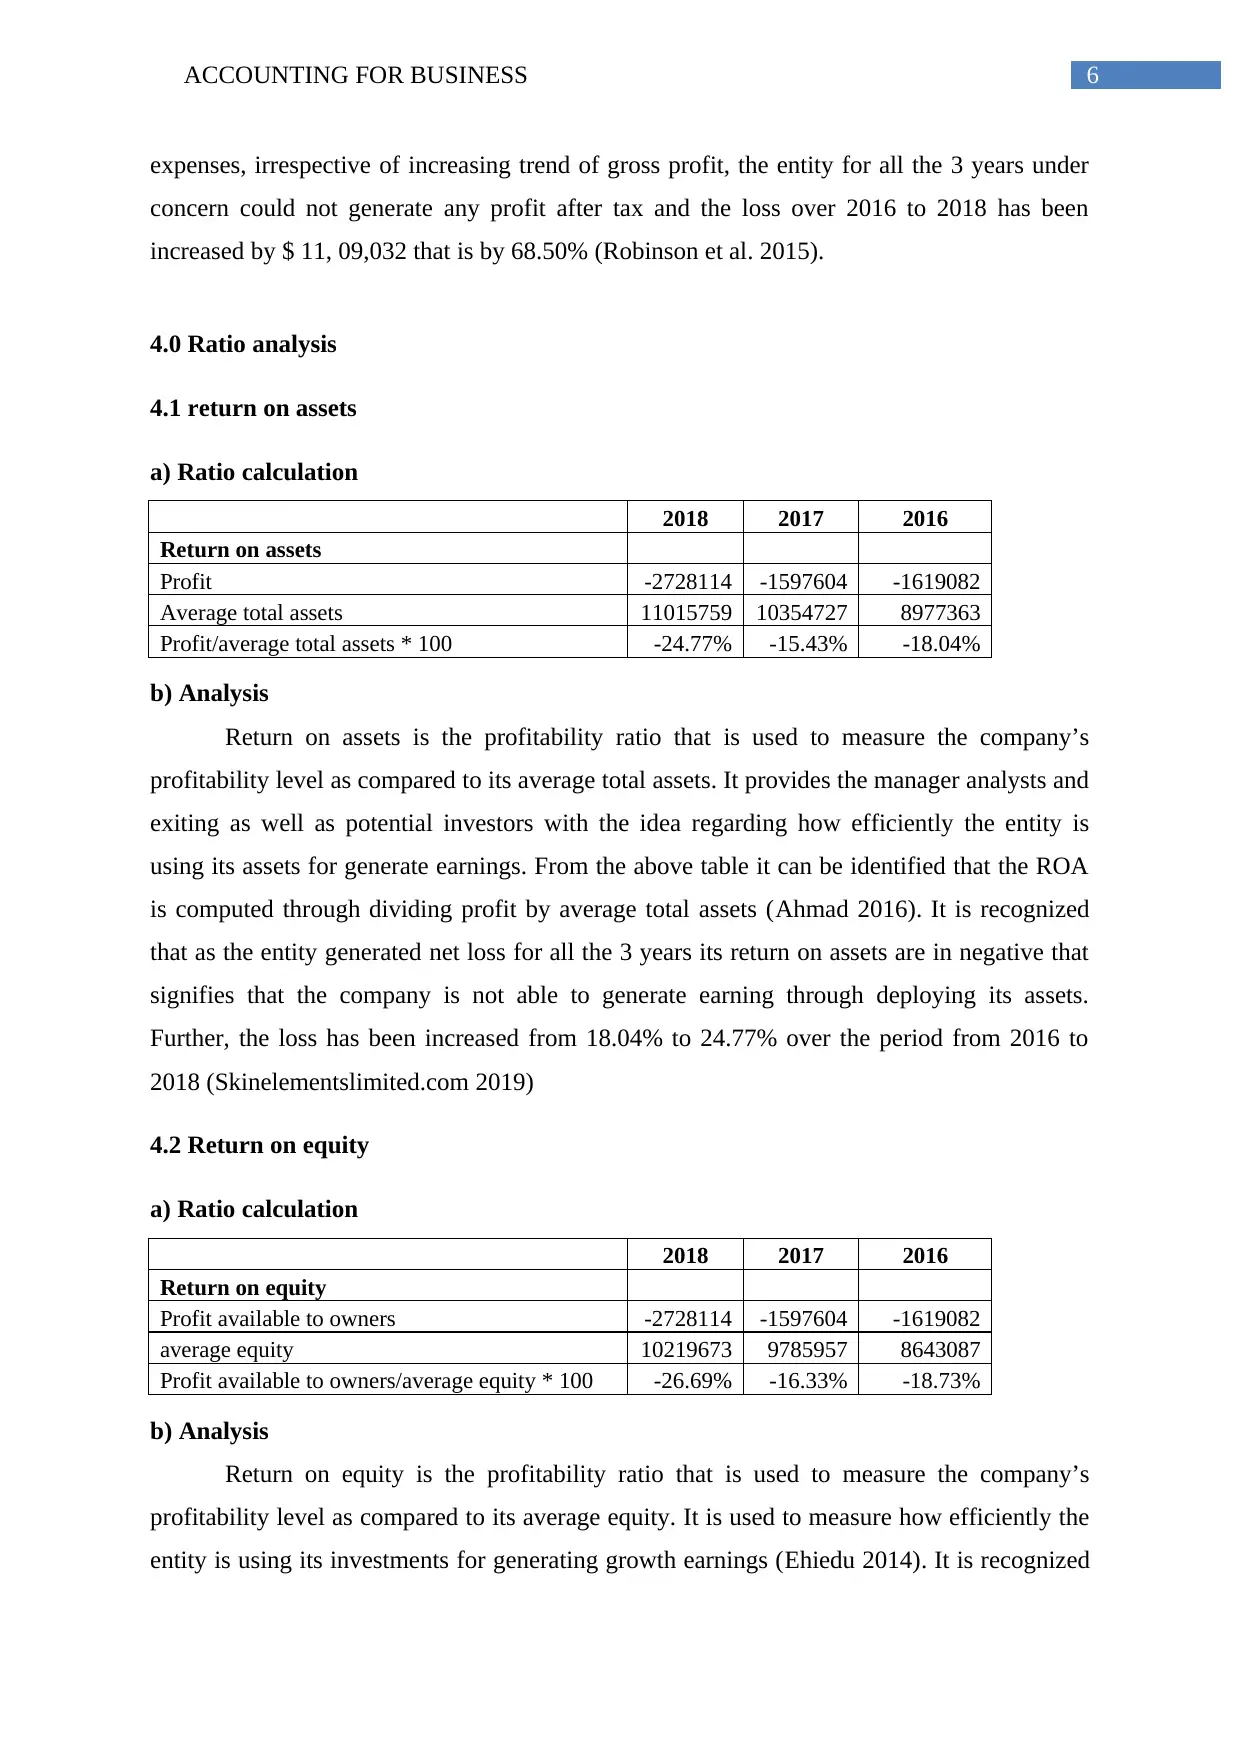
4.1 return on assets
a) Ratio calculation
2018 2017 2016
Return on assets
Profit -2728114 -1597604 -1619082
Average total assets 11015759 10354727 8977363
Profit/average total assets * 100 -24.77% -15.43% -18.04%
b) Analysis
Return on assets is the profitability ratio that is used to measure the company’s
profitability level as compared to its average total assets. It provides the manager analysts and
exiting as well as potential investors with the idea regarding how efficiently the entity is
using its assets for generate earnings. From the above table it can be identified that the ROA
is computed through dividing profit by average total assets (Ahmad 2016). It is recognized
that as the entity generated net loss for all the 3 years its return on assets are in negative that
signifies that the company is not able to generate earning through deploying its assets.
Further, the loss has been increased from 18.04% to 24.77% over the period from 2016 to
2018 (Skinelementslimited.com 2019)
4.2 Return on equity
a) Ratio calculation
2018 2017 2016
Return on equity
Profit available to owners -2728114 -1597604 -1619082
average equity 10219673 9785957 8643087
Profit available to owners/average equity * 100 -26.69% -16.33% -18.73%
b) Analysis
Return on equity is the profitability ratio that is used to measure the company’s
profitability level as compared to its average equity. It is used to measure how efficiently the
entity is using its investments for generating growth earnings (Ehiedu 2014). It is recognized
expenses, irrespective of increasing trend of gross profit, the entity for all the 3 years under
concern could not generate any profit after tax and the loss over 2016 to 2018 has been
increased by $ 11, 09,032 that is by 68.50% (Robinson et al. 2015).
4.0 Ratio analysis
4.1 return on assets
a) Ratio calculation
2018 2017 2016
Return on assets
Profit -2728114 -1597604 -1619082
Average total assets 11015759 10354727 8977363
Profit/average total assets * 100 -24.77% -15.43% -18.04%
b) Analysis
Return on assets is the profitability ratio that is used to measure the company’s
profitability level as compared to its average total assets. It provides the manager analysts and
exiting as well as potential investors with the idea regarding how efficiently the entity is
using its assets for generate earnings. From the above table it can be identified that the ROA
is computed through dividing profit by average total assets (Ahmad 2016). It is recognized
that as the entity generated net loss for all the 3 years its return on assets are in negative that
signifies that the company is not able to generate earning through deploying its assets.
Further, the loss has been increased from 18.04% to 24.77% over the period from 2016 to
2018 (Skinelementslimited.com 2019)
4.2 Return on equity
a) Ratio calculation
2018 2017 2016
Return on equity
Profit available to owners -2728114 -1597604 -1619082
average equity 10219673 9785957 8643087
Profit available to owners/average equity * 100 -26.69% -16.33% -18.73%
b) Analysis
Return on equity is the profitability ratio that is used to measure the company’s
profitability level as compared to its average equity. It is used to measure how efficiently the
entity is using its investments for generating growth earnings (Ehiedu 2014). It is recognized
Paraphrase This Document
Need a fresh take? Get an instant paraphrase of this document with our AI Paraphraser
7ACCOUNTING FOR BUSINESS
that as the entity generated net loss for all the 3 years its return on equity are in negative that
signifies that the company is not able to generate earning through deploying its investments.
Further, the loss has been increased from 18.73% to 26.69% over the period from 2016 to
2018 (Skinelementslimited.com 2019).
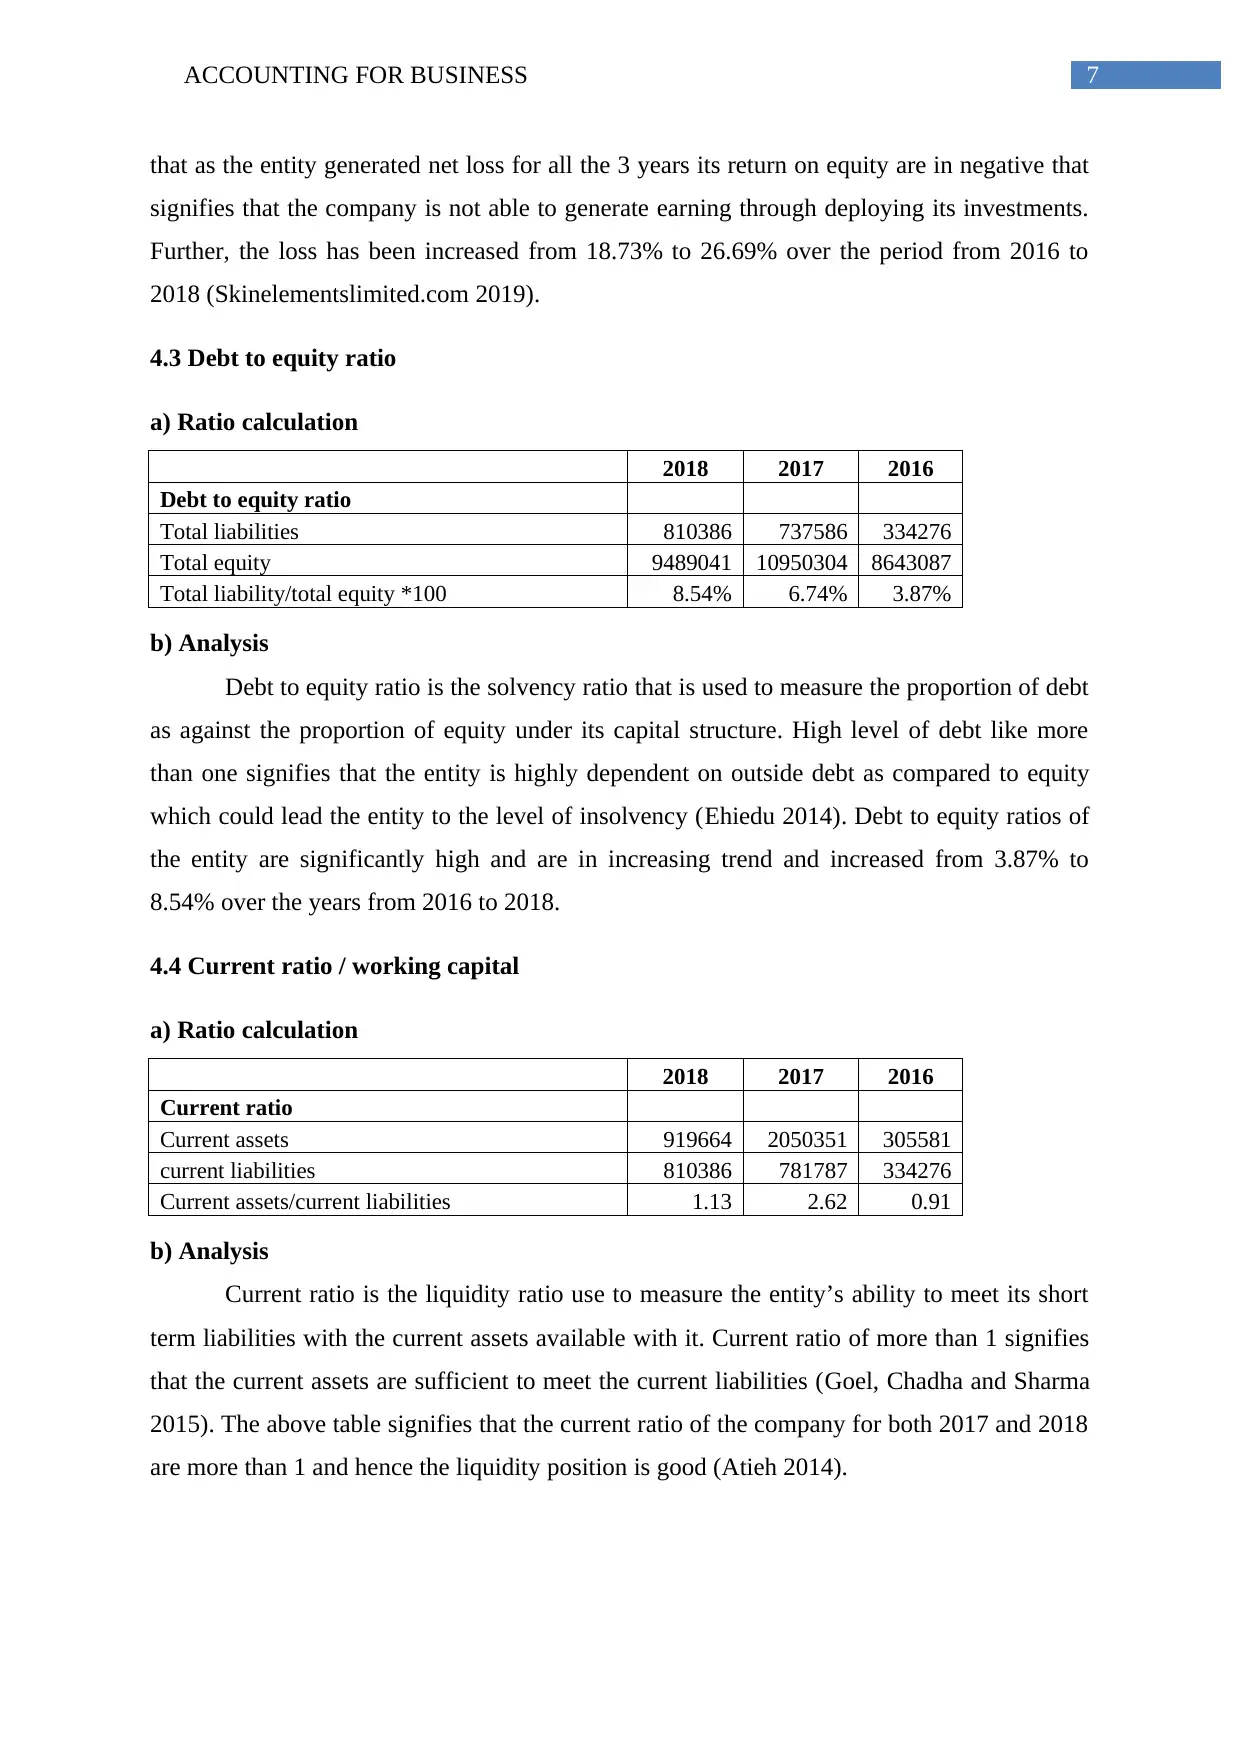
4.3 Debt to equity ratio
a) Ratio calculation
2018 2017 2016
Debt to equity ratio
Total liabilities 810386 737586 334276
Total equity 9489041 10950304 8643087
Total liability/total equity *100 8.54% 6.74% 3.87%
b) Analysis
Debt to equity ratio is the solvency ratio that is used to measure the proportion of debt
as against the proportion of equity under its capital structure. High level of debt like more
than one signifies that the entity is highly dependent on outside debt as compared to equity
which could lead the entity to the level of insolvency (Ehiedu 2014). Debt to equity ratios of
the entity are significantly high and are in increasing trend and increased from 3.87% to
8.54% over the years from 2016 to 2018.
4.4 Current ratio / working capital
a) Ratio calculation
2018 2017 2016
Current ratio
Current assets 919664 2050351 305581
current liabilities 810386 781787 334276
Current assets/current liabilities 1.13 2.62 0.91
b) Analysis
Current ratio is the liquidity ratio use to measure the entity’s ability to meet its short
term liabilities with the current assets available with it. Current ratio of more than 1 signifies
that the current assets are sufficient to meet the current liabilities (Goel, Chadha and Sharma
2015). The above table signifies that the current ratio of the company for both 2017 and 2018
are more than 1 and hence the liquidity position is good (Atieh 2014).
that as the entity generated net loss for all the 3 years its return on equity are in negative that
signifies that the company is not able to generate earning through deploying its investments.
Further, the loss has been increased from 18.73% to 26.69% over the period from 2016 to
2018 (Skinelementslimited.com 2019).
4.3 Debt to equity ratio
a) Ratio calculation
2018 2017 2016
Debt to equity ratio
Total liabilities 810386 737586 334276
Total equity 9489041 10950304 8643087
Total liability/total equity *100 8.54% 6.74% 3.87%
b) Analysis
Debt to equity ratio is the solvency ratio that is used to measure the proportion of debt
as against the proportion of equity under its capital structure. High level of debt like more
than one signifies that the entity is highly dependent on outside debt as compared to equity
which could lead the entity to the level of insolvency (Ehiedu 2014). Debt to equity ratios of
the entity are significantly high and are in increasing trend and increased from 3.87% to
8.54% over the years from 2016 to 2018.
4.4 Current ratio / working capital
a) Ratio calculation
2018 2017 2016
Current ratio
Current assets 919664 2050351 305581
current liabilities 810386 781787 334276
Current assets/current liabilities 1.13 2.62 0.91
b) Analysis
Current ratio is the liquidity ratio use to measure the entity’s ability to meet its short
term liabilities with the current assets available with it. Current ratio of more than 1 signifies
that the current assets are sufficient to meet the current liabilities (Goel, Chadha and Sharma
2015). The above table signifies that the current ratio of the company for both 2017 and 2018
are more than 1 and hence the liquidity position is good (Atieh 2014).
8ACCOUNTING FOR BUSINESS
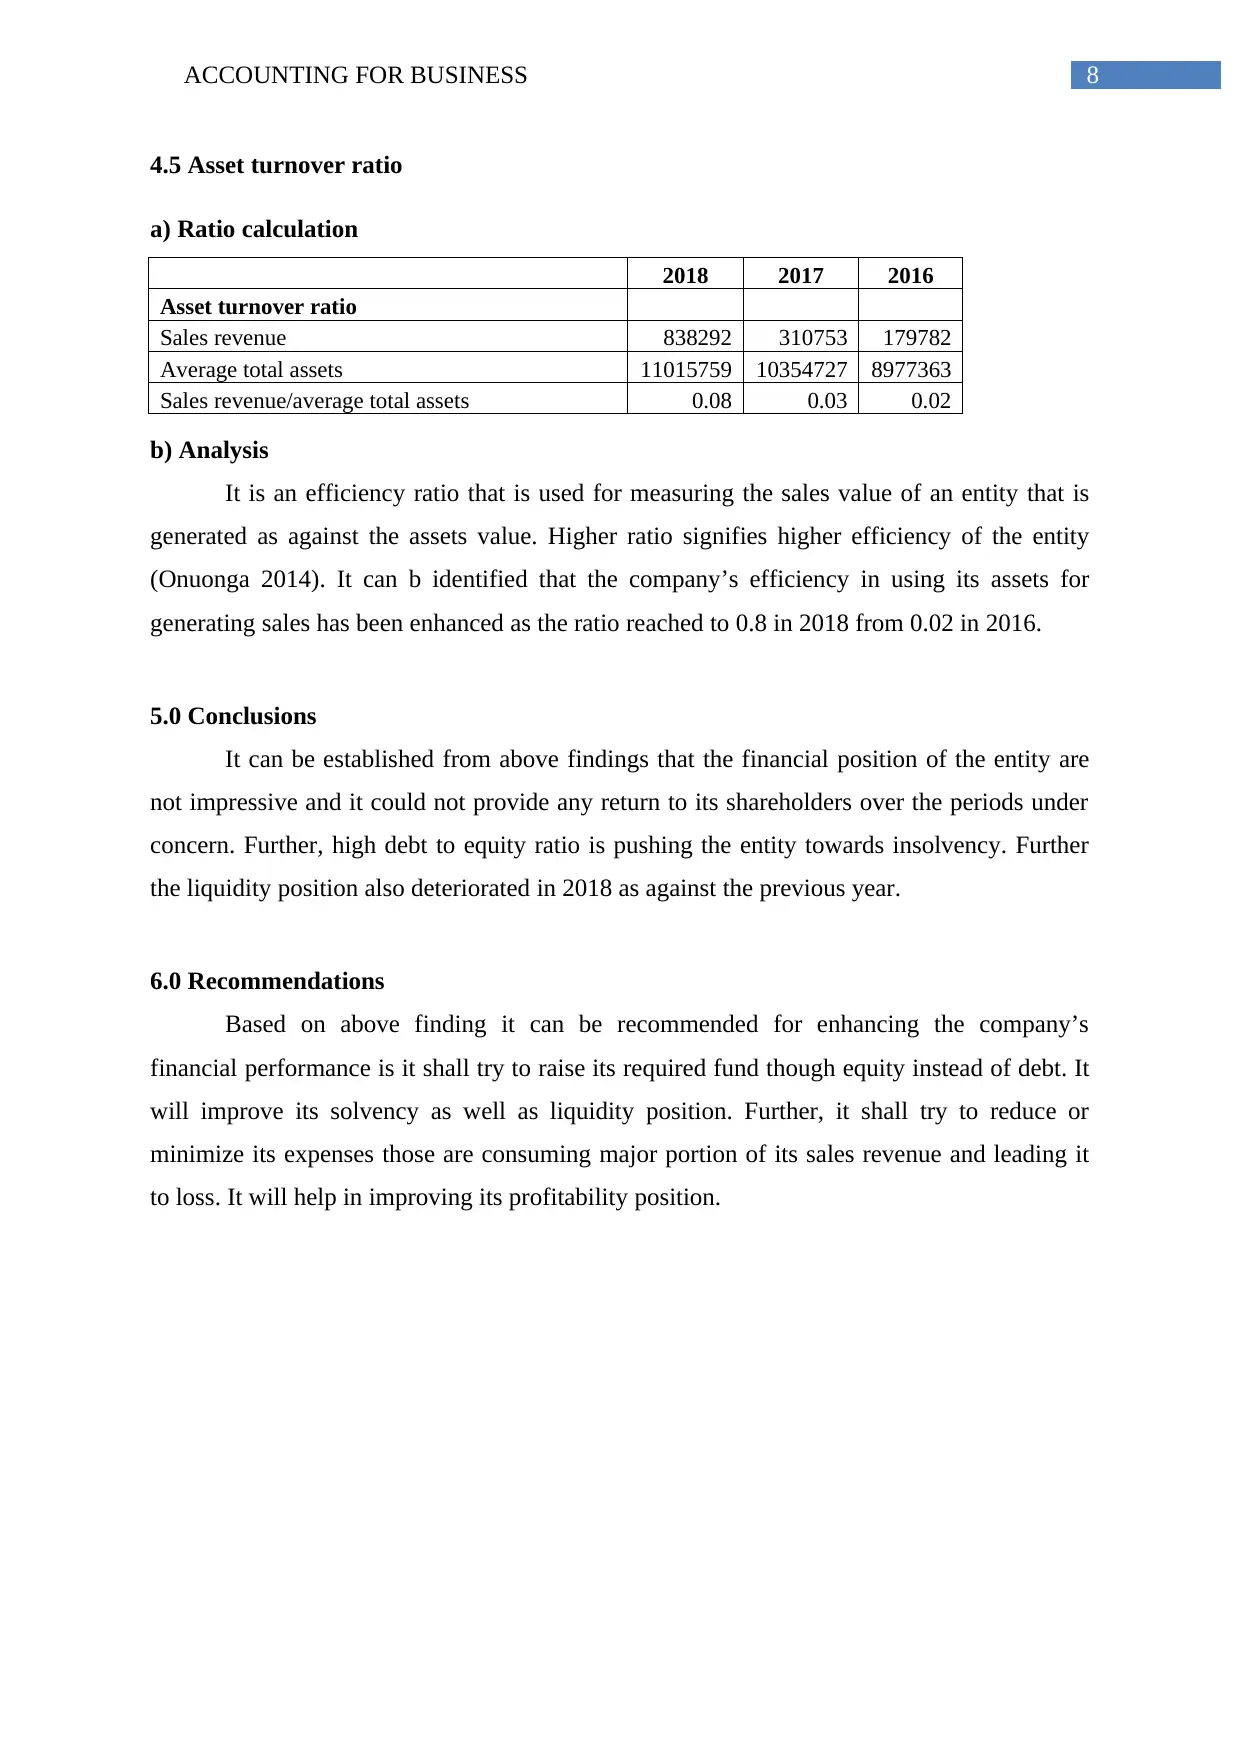
4.5 Asset turnover ratio
a) Ratio calculation
2018 2017 2016
Asset turnover ratio
Sales revenue 838292 310753 179782
Average total assets 11015759 10354727 8977363
Sales revenue/average total assets 0.08 0.03 0.02
b) Analysis
It is an efficiency ratio that is used for measuring the sales value of an entity that is
generated as against the assets value. Higher ratio signifies higher efficiency of the entity
(Onuonga 2014). It can b identified that the company’s efficiency in using its assets for
generating sales has been enhanced as the ratio reached to 0.8 in 2018 from 0.02 in 2016.
5.0 Conclusions
It can be established from above findings that the financial position of the entity are
not impressive and it could not provide any return to its shareholders over the periods under
concern. Further, high debt to equity ratio is pushing the entity towards insolvency. Further
the liquidity position also deteriorated in 2018 as against the previous year.
6.0 Recommendations
Based on above finding it can be recommended for enhancing the company’s
financial performance is it shall try to raise its required fund though equity instead of debt. It
will improve its solvency as well as liquidity position. Further, it shall try to reduce or
minimize its expenses those are consuming major portion of its sales revenue and leading it
to loss. It will help in improving its profitability position.
⊘ This is a preview!⊘
Do you want full access?
Subscribe today to unlock all pages.
Trusted by 1+ million students worldwide
9ACCOUNTING FOR BUSINESS
References
Ahmad, R., 2016. A study of relationship between liquidity and profitability of standard
charterd bank Pakistan: Analysis of financial statement approach. Global Journal of
Management and Business Research.
Atieh, S.H., 2014. Liquidity analysis using cash flow ratios as compared to traditional ratios
in the pharmaceutical sector in Jordan. International journal of Financial research, 5(3),
pp.146-158.
Ehiedu, V.C., 2014. The impact of liquidity on profitability of some selected companies: The
financial statement analysis (FSA) approach. Research Journal of Finance and
Accounting, 5(5), pp.81-90.
Goel, U., Chadha, S. and Sharma, A.K., 2015. Operating liquidity and financial leverage:
Evidences from Indian machinery industry. Procedia-Social and Behavioral Sciences, 189,
pp.344-350.
Onuonga, S.M., 2014. The Analysis of Profitability of Kenyas Top Six Commercial Banks:
Internal Factor Analysis. American International Journal of Social Science, 3(5), pp.94-103.
Robinson, T.R., Henry, E., Pirie, W.L. and Broihahn, M.A., 2015. International financial
statement analysis. John Wiley & Sons.
Skinelementslimited.com. 2019. [online] Available at:
http://skinelementslimited.com/pdf/annual-report-2018.pdf [Accessed 4 Sep. 2019].
Vogel, H.L., 2014. Entertainment industry economics: A guide for financial analysis.
Cambridge University Press.
Williams, E.E. and Dobelman, J.A., 2017. Financial statement analysis. World Scientific
Book Chapters, pp.109-169.
1 out of 10
Related Documents


Your All-in-One AI-Powered Toolkit for Academic Success.
+13062052269
info@desklib.com
Available 24*7 on WhatsApp / Email
![[object Object]](/_next/static/media/star-bottom.7253800d.svg)
Unlock your academic potential
Copyright © 2020–2026 A2Z Services. All Rights Reserved. Developed and managed by ZUCOL.