Financial Analysis and Performance Review of SMART IT: Case Study

Verified

Added on  2021/05/31

|14
|2176
|83
Case Study
AI Summary
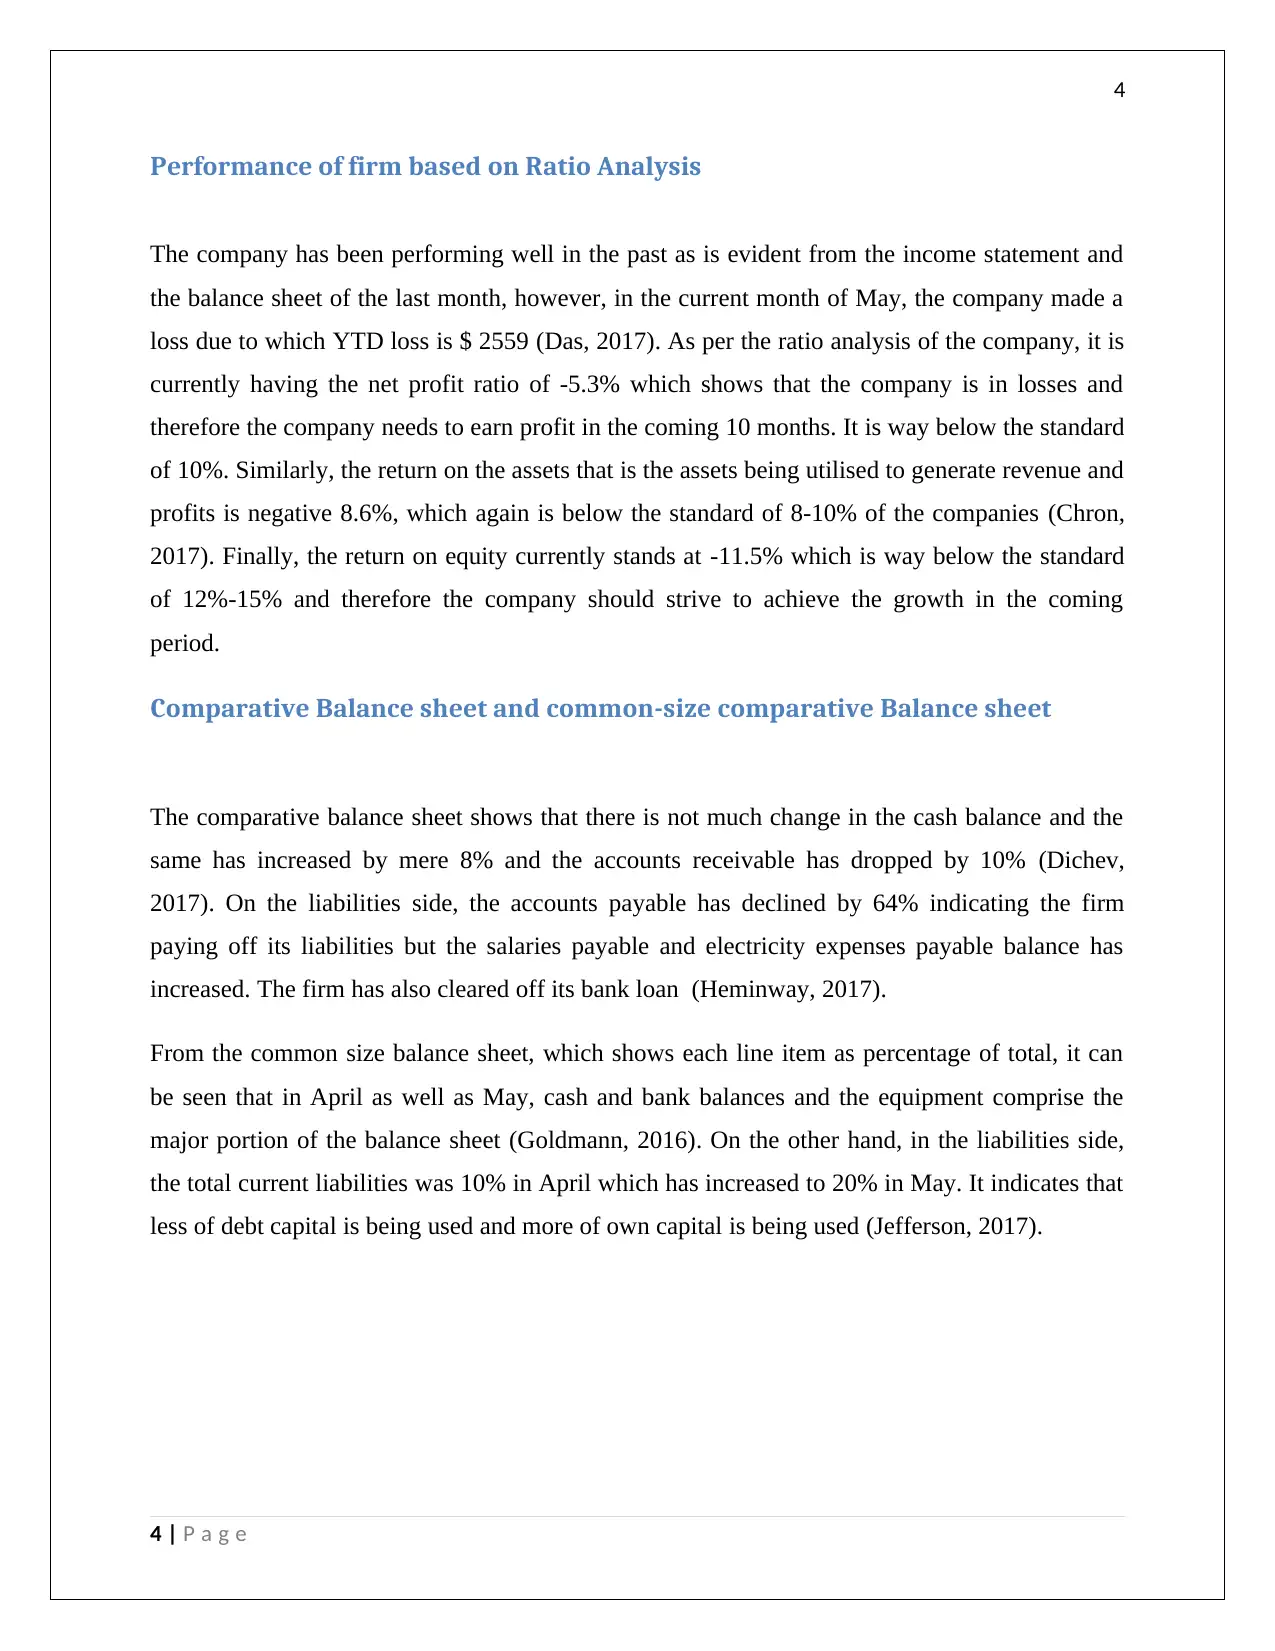
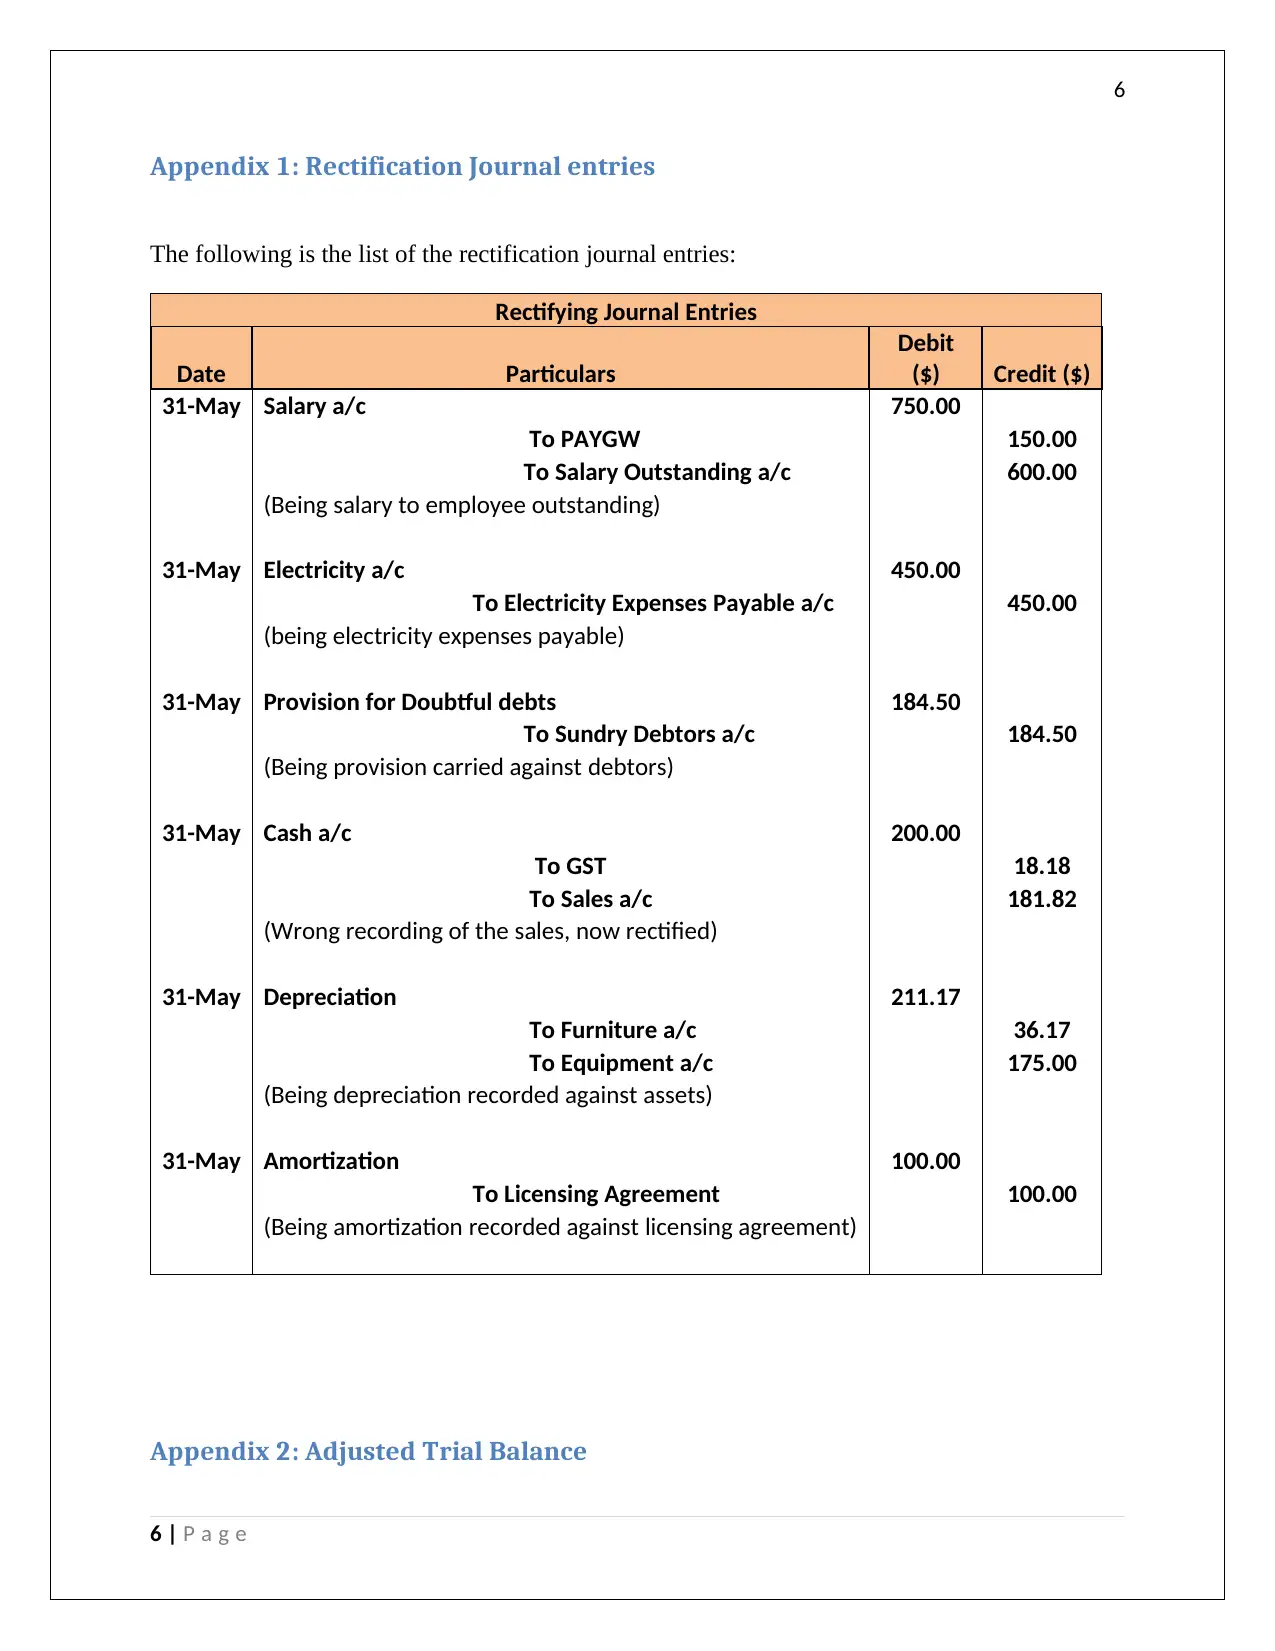
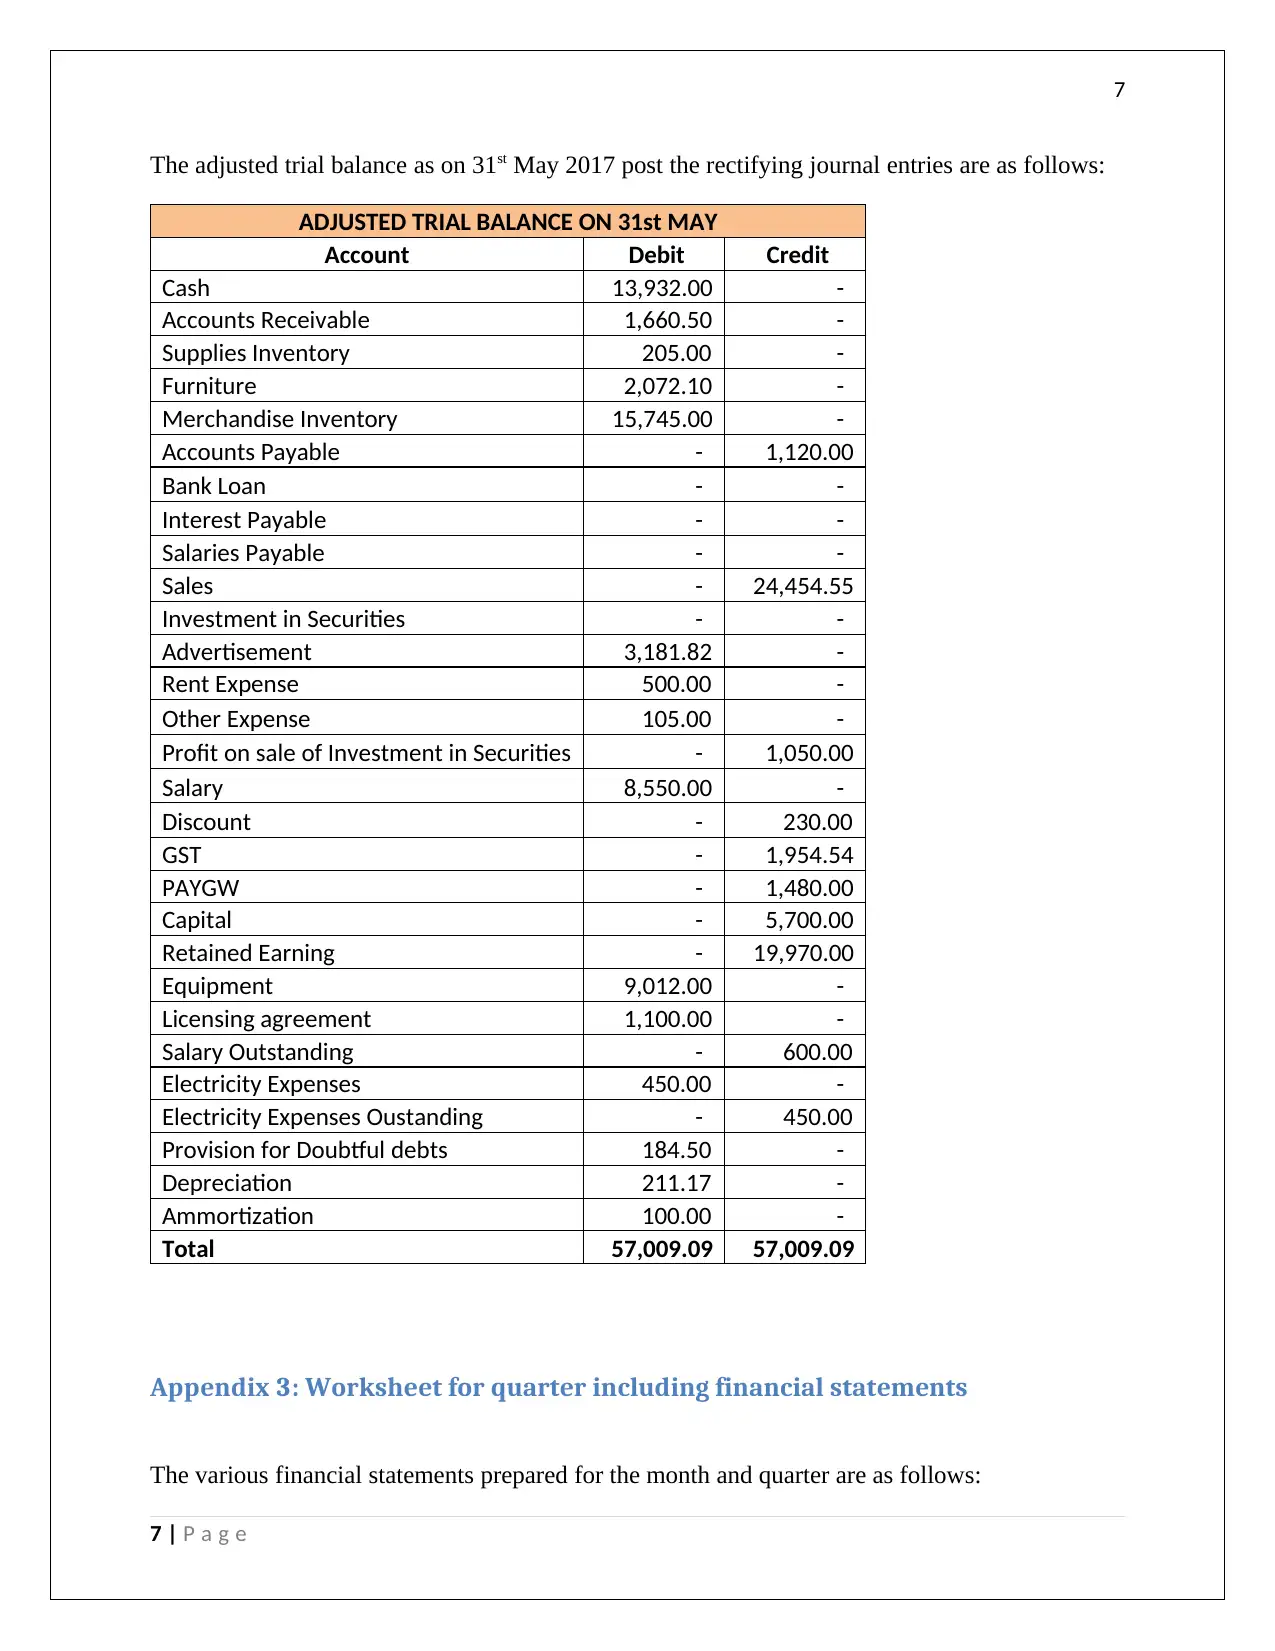
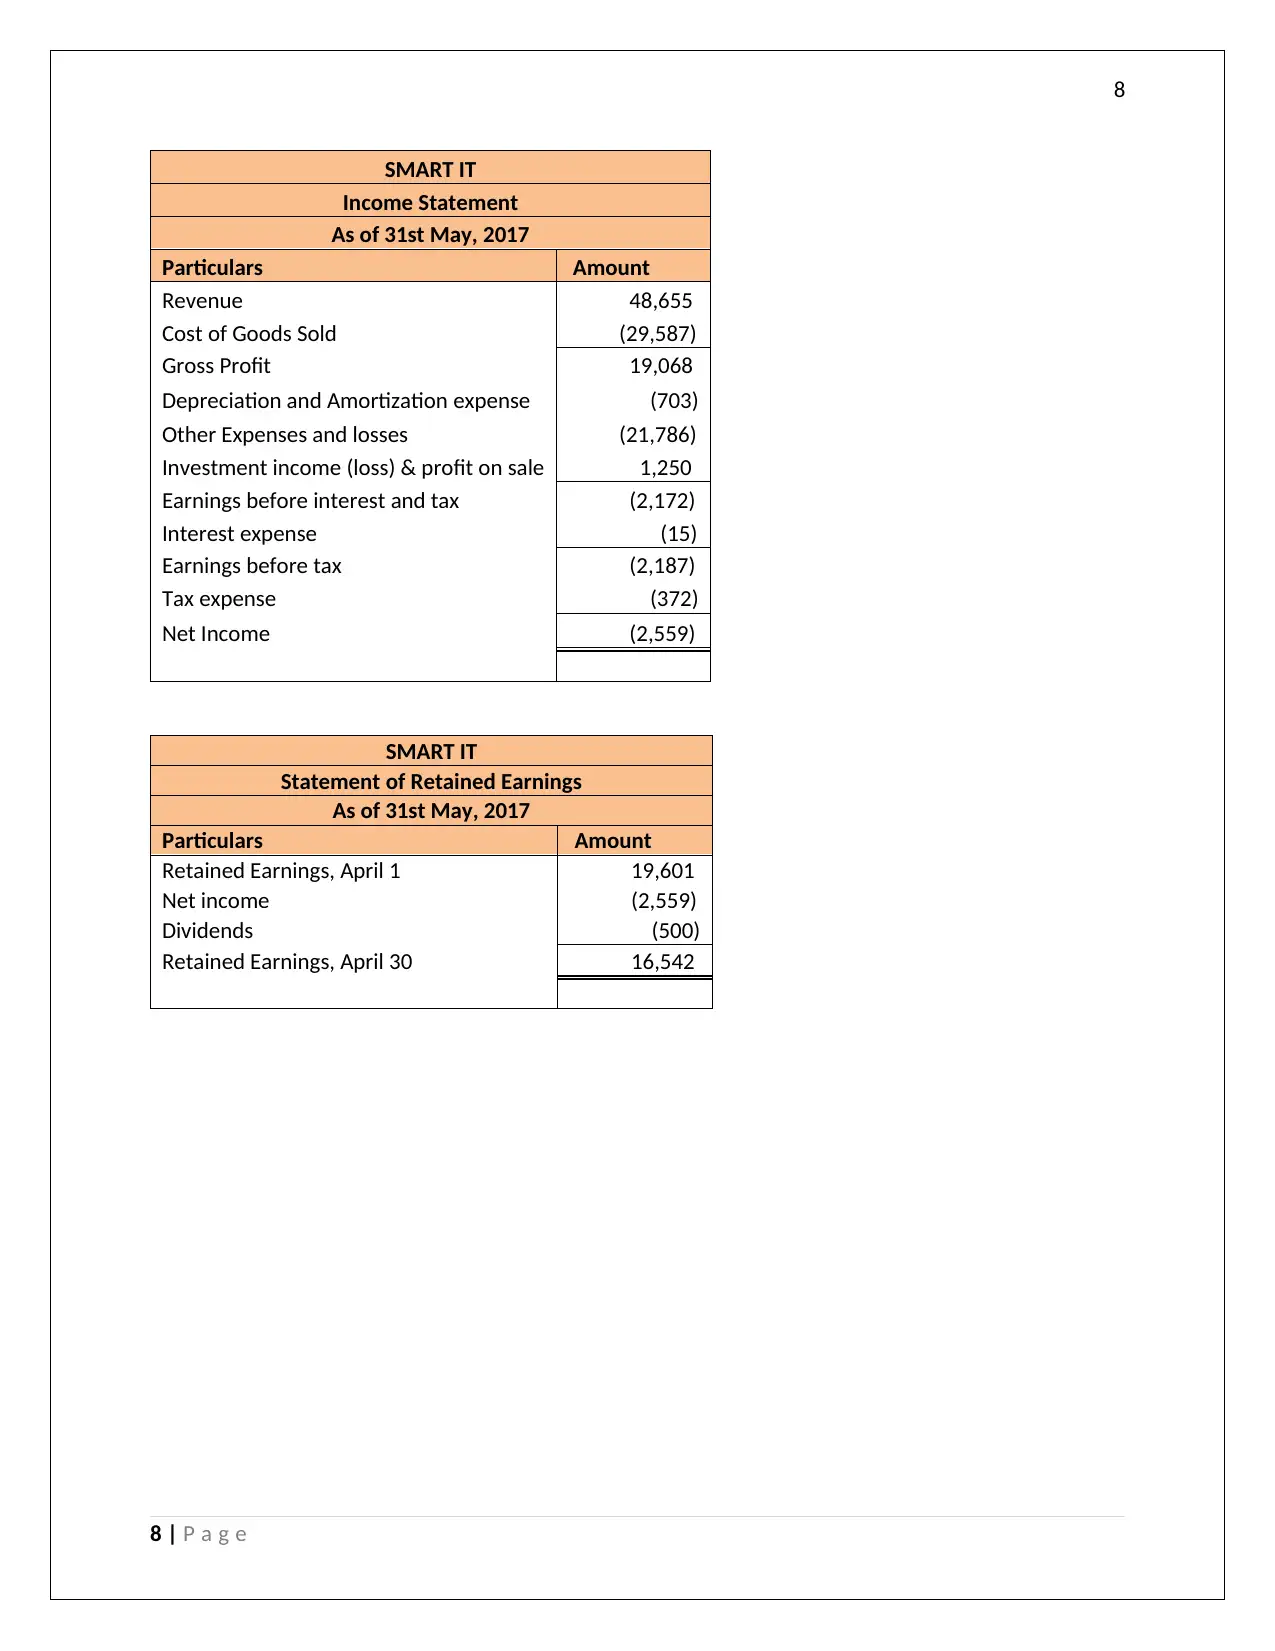
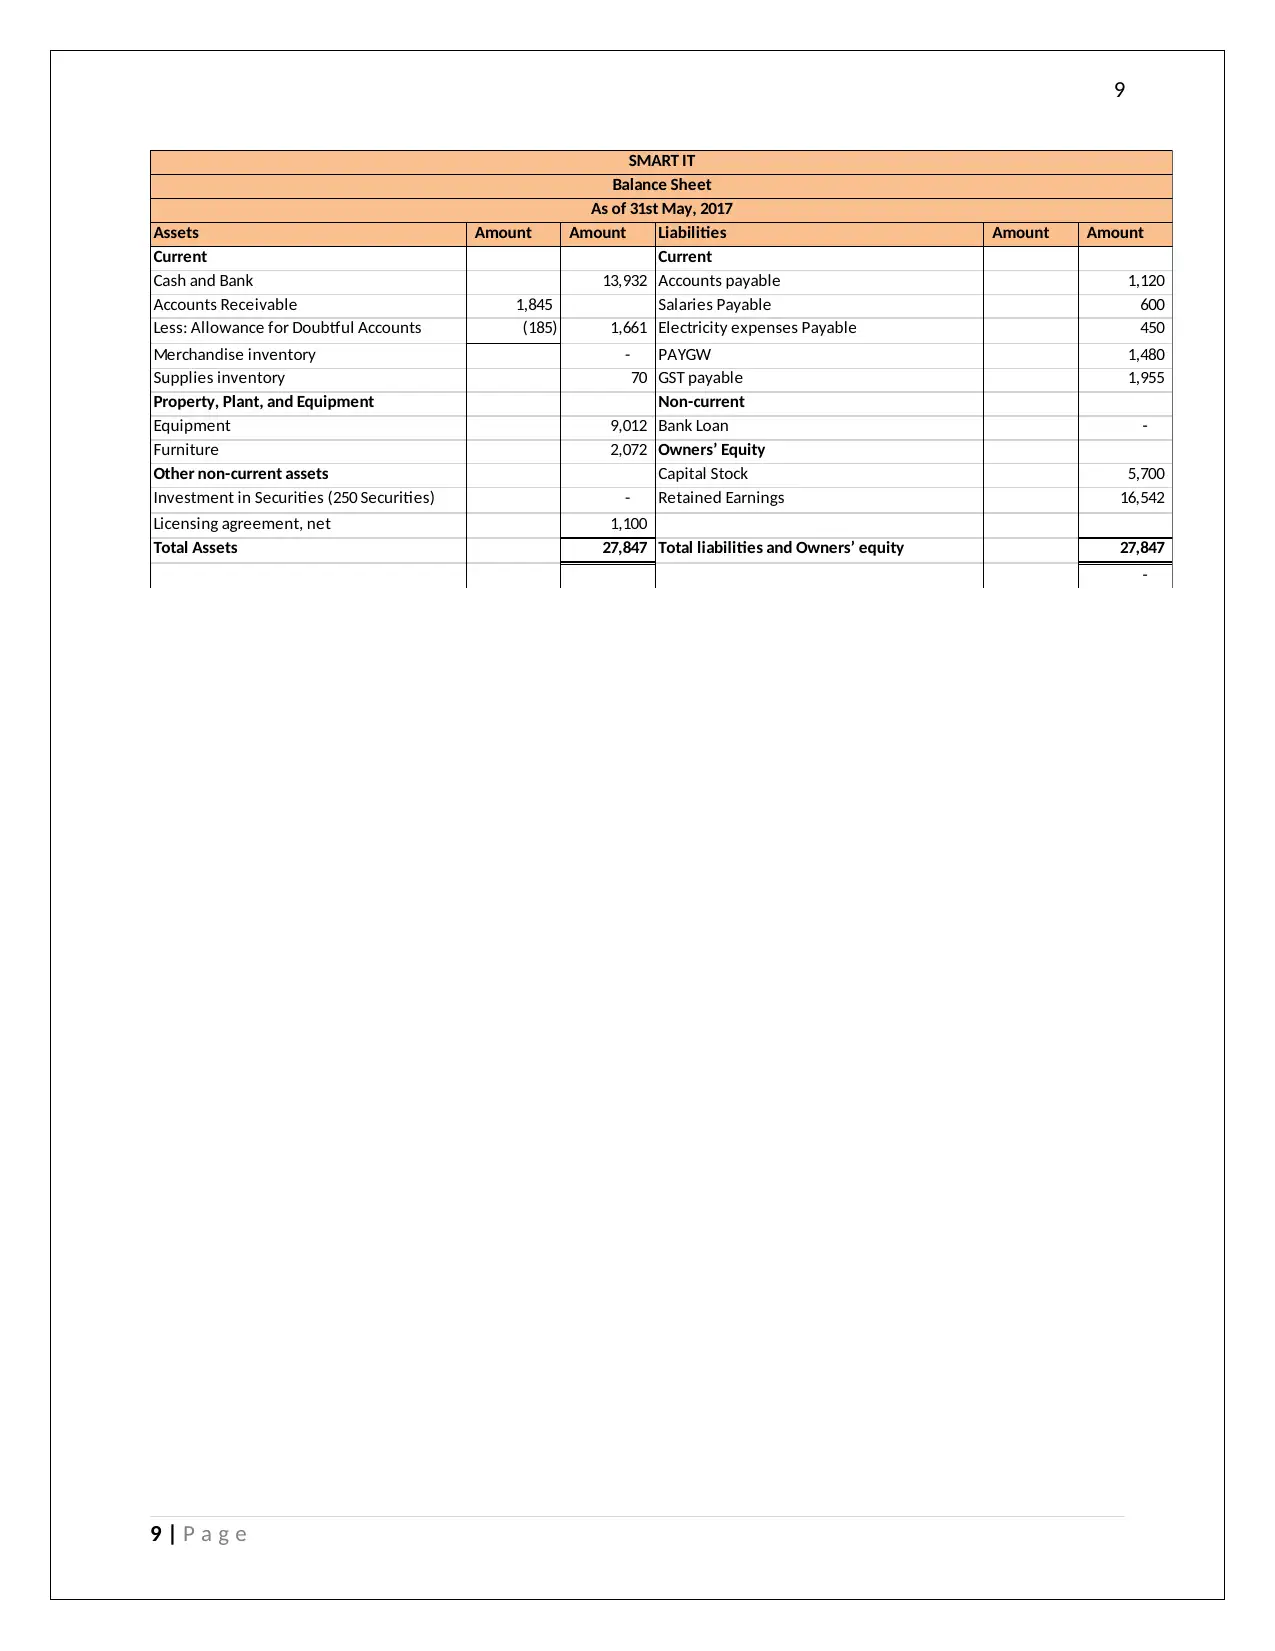
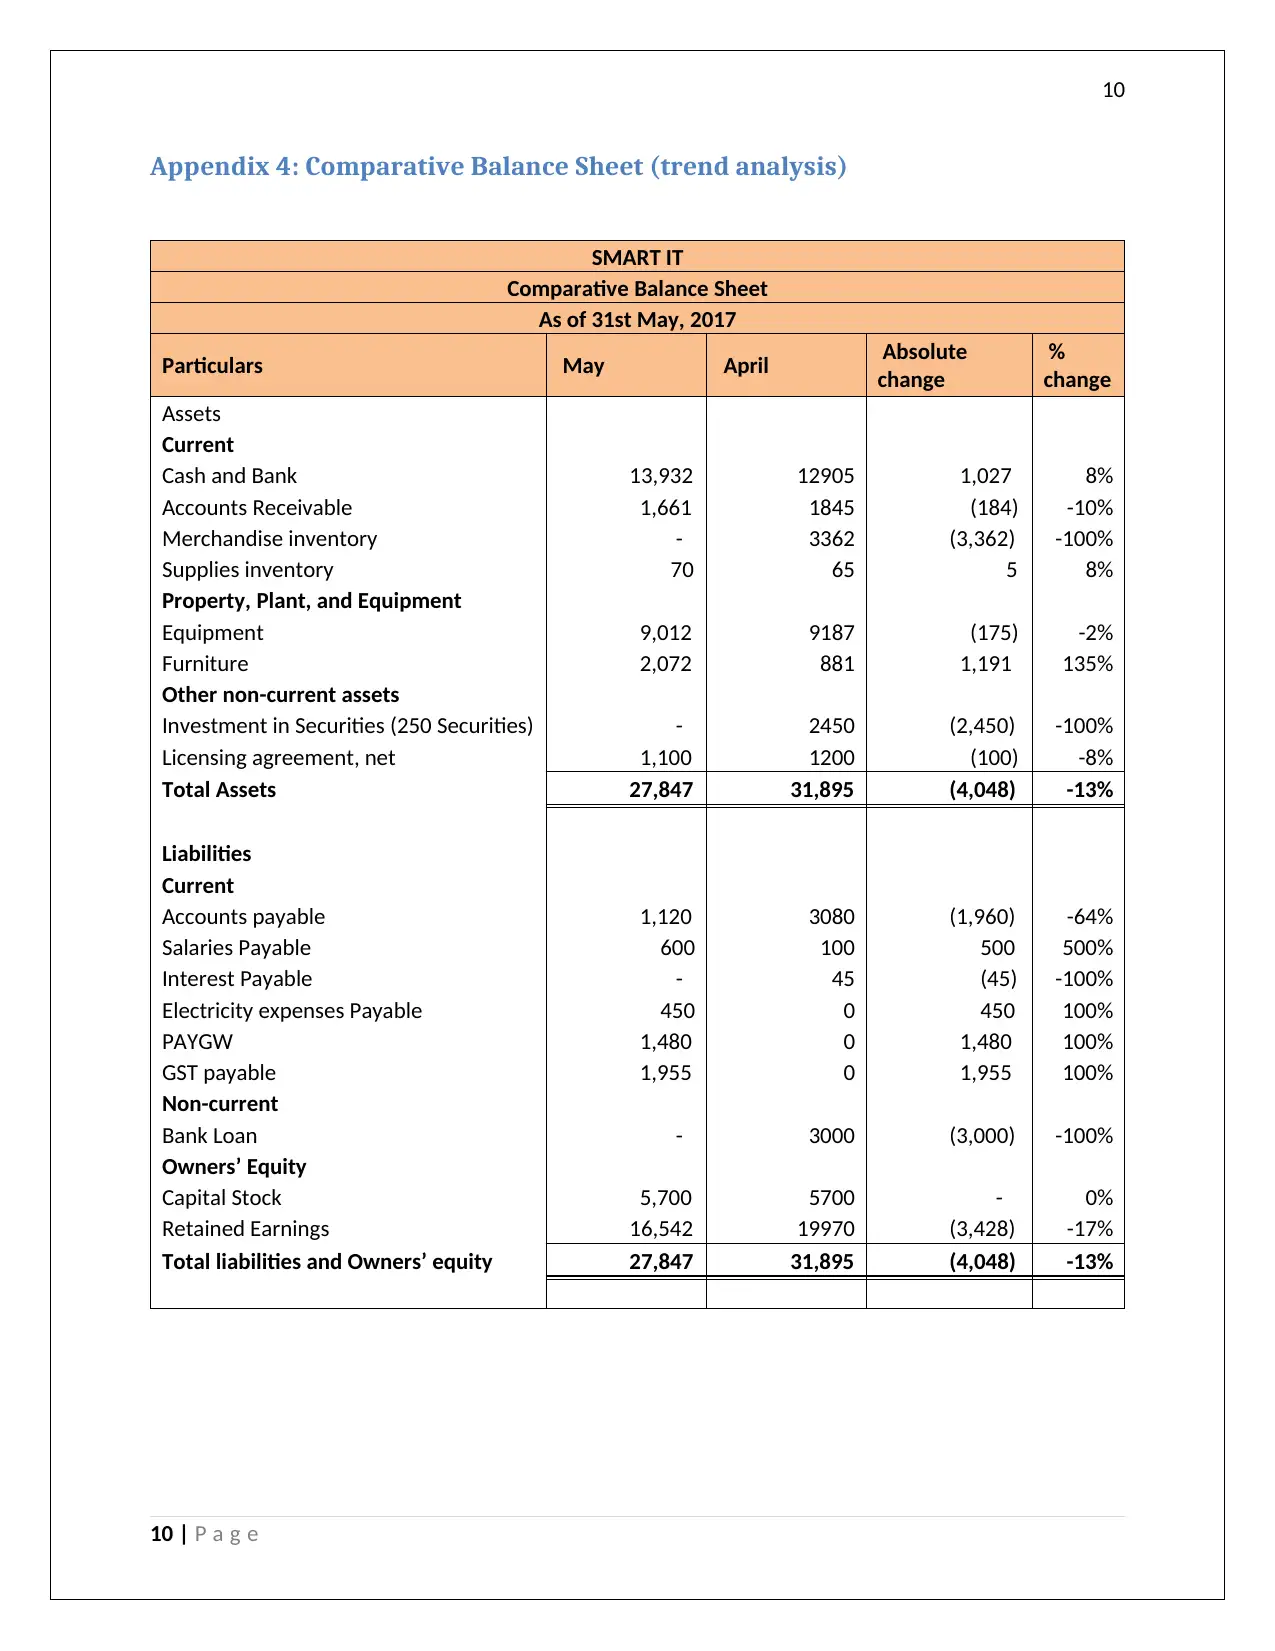
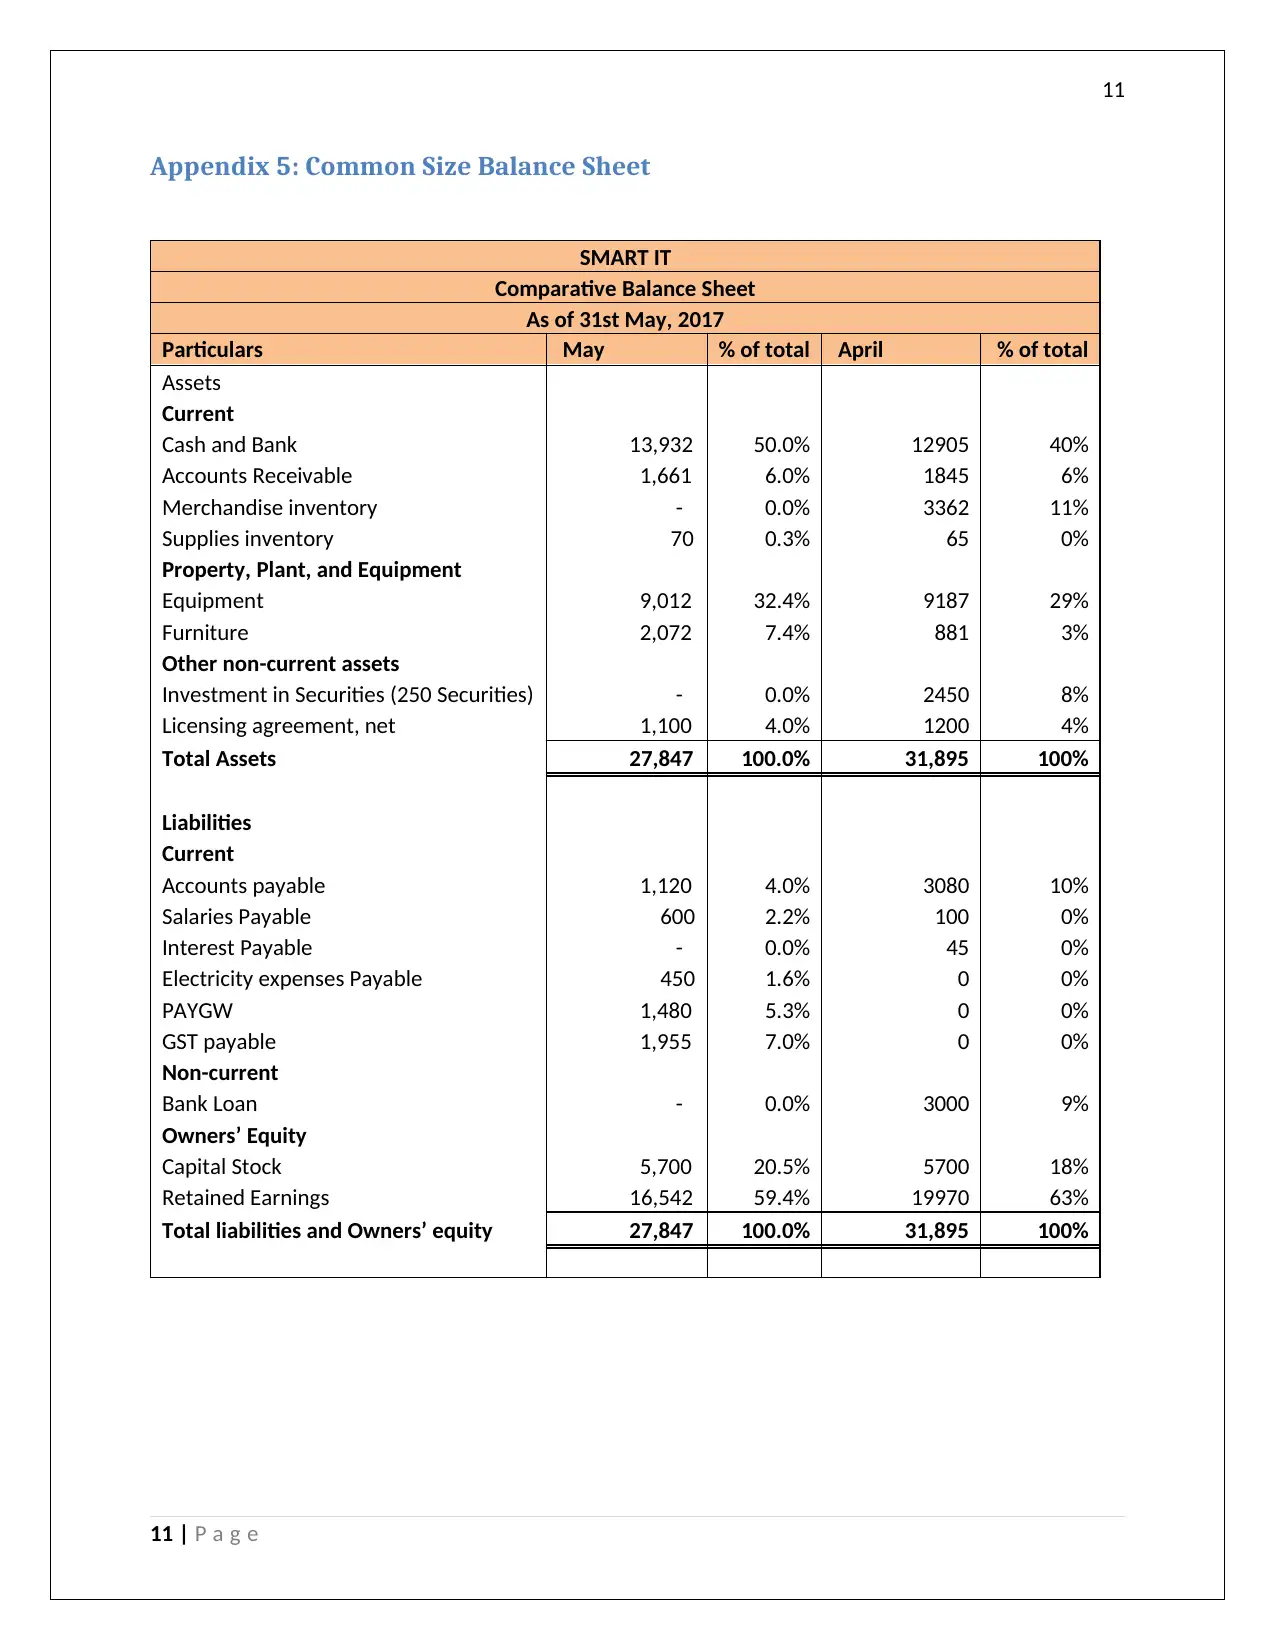
This case study analyzes the financial performance of SMART IT, focusing on the preparation of financial statements. It examines various aspects, including alternative accounting approaches, such as the written down value method for depreciation and perpetual inventory systems, and also explores strategies to address uncollectible debts. The report delves into ratio analysis, revealing a net profit ratio of -5.3%, a return on assets of -8.6%, and a return on equity of -11.5%, indicating financial losses. Comparative and common-size balance sheets are presented, highlighting changes in cash, accounts receivable, and liabilities. The study also includes rectification journal entries, an adjusted trial balance, and financial statements like the income statement and statement of retained earnings. Furthermore, the case study provides a comparative balance sheet for trend analysis and ratio analysis, along with a conclusion and recommendations for improving the company's financial position. References are included at the end.
tabler-icon-diamond-filled.svg

Contribute Materials

Your contribution can guide someone’s learning journey. Share your documents today.
Document Page
ACCOUNTS
ASSIGNMENT
tabler-icon-diamond-filled.svg

Secure Best Marks with AI Grader

Need help grading? Try our AI Grader for instant feedback on your assignments.
Document Page
1
By student name
Professor
University
Date: 25 April 2018.
1 | P a g e
Document Page
2
Contents
Case Study – Part 2B....................................................................................................................................3
Introduction.................................................................................................................................................3
Report on the financials..............................................................................................................................4
Alternative accounting approaches.........................................................................................................4
Performance of firm based on Ratio Analysis..........................................................................................4
Comparative Balance sheet and common-size comparative Balance sheet............................................4
Conclusion and Recommendation...............................................................................................................6
Other issues.............................................................................................................................................6
Appendices..................................................................................................................................................7
Appendix 1: Rectification Journal entries................................................................................................7
Appendix 2: Adjusted Trial Balance.........................................................................................................8
Appendix 3: Worksheet for quarter including financial statements........................................................9
Appendix 4: Comparative Balance Sheet (trend analysis).....................................................................11
Appendix 5: Common Size Balance Sheet..............................................................................................12
Appendix 6: Ratio Analysis.....................................................................................................................13
References.................................................................................................................................................14
2 | P a g e
Document Page
3
Case Study – Part 2B
Introduction
In the given case, SMART IT is one of the businesses for which financial statements needs to be
prepared. (Alexander, 2016). The manager of the company is concerned about the performance
of the company and therefore he has proposed a no. of changes in the policy ranging from the
depreciation method, the inventory costing and recognising the uncollectible amounts from the
debtors. Different ratios have also been analysed to see whether the company is on the growth
path or not, some of which include net profit ratio, return on assets, return on equity/ capital
(Belton, 2017). Besides this, the comparative balance sheet for both the months and the common
size balance sheet has also been prepared to ensure that the comparison and analysis can be done.
Report on the financials
Alternative accounting approaches
For improving the financial position of the company, it can use best accounting approaches that
are being used worldwide and which has been prescribed by the International Financial
Reporting Standards and Generally Accepted Accounting Principles (Bromwich & Scapens,
2016). Some of these include using the written down value method of depreciation which is more
practical as compared to the straight line method of depreciation as the use and efficiency of
machinery, furniture and equipment is more in the earlier years than in the later years.
Furthermore, the company can use perpetual accounting system where the inventory valuation
will be done on the weighted average method and the inventory would be ordered by the use of
“Just in time” approach to avoid the damage and spillage of the inventory (Choy, 2018). The
uncollectible from debtors or the bad debt situation can be improved by offering them discount
on cash payment and incentivising them for payment within a given credit limit. The same can
also be improved by factoring of the receivables.
3 | P a g e
tabler-icon-diamond-filled.svg

Secure Best Marks with AI Grader

Need help grading? Try our AI Grader for instant feedback on your assignments.
Document Page
4
Performance of firm based on Ratio Analysis
The company has been performing well in the past as is evident from the income statement and
the balance sheet of the last month, however, in the current month of May, the company made a
loss due to which YTD loss is $ 2559 (Das, 2017). As per the ratio analysis of the company, it is
currently having the net profit ratio of -5.3% which shows that the company is in losses and
therefore the company needs to earn profit in the coming 10 months. It is way below the standard
of 10%. Similarly, the return on the assets that is the assets being utilised to generate revenue and
profits is negative 8.6%, which again is below the standard of 8-10% of the companies (Chron,
2017). Finally, the return on equity currently stands at -11.5% which is way below the standard
of 12%-15% and therefore the company should strive to achieve the growth in the coming
period.
Comparative Balance sheet and common-size comparative Balance sheet
The comparative balance sheet shows that there is not much change in the cash balance and the
same has increased by mere 8% and the accounts receivable has dropped by 10% (Dichev,
2017). On the liabilities side, the accounts payable has declined by 64% indicating the firm
paying off its liabilities but the salaries payable and electricity expenses payable balance has
increased. The firm has also cleared off its bank loan (Heminway, 2017).
From the common size balance sheet, which shows each line item as percentage of total, it can
be seen that in April as well as May, cash and bank balances and the equipment comprise the
major portion of the balance sheet (Goldmann, 2016). On the other hand, in the liabilities side,
the total current liabilities was 10% in April which has increased to 20% in May. It indicates that
less of debt capital is being used and more of own capital is being used (Jefferson, 2017).
4 | P a g e
Document Page
5
Conclusion and Recommendation
Other issues
There might be several other issues which may contribute cumulatively to the growth of the
organization like the social factors, the political situation of the company or the firm in which it
is operating, economic conditions, etc (Kuhn & Morris, 2016). but these are few factors which
are not in control of the firm and are equally impacting the industry or the market. In case the
same is done effectively and efficiently, the business performance can be improved and
transparency in the operations can be ensured (Linden & Freeman, 2017).
Appendices
5 | P a g e
Document Page
6
Appendix 1: Rectification Journal entries
The following is the list of the rectification journal entries:
Rectifying Journal Entries
Date Particulars
Debit
($) Credit ($)
31-May Salary a/c 750.00
To PAYGW 150.00
To Salary Outstanding a/c 600.00
(Being salary to employee outstanding)
31-May Electricity a/c 450.00
To Electricity Expenses Payable a/c 450.00
(being electricity expenses payable)
31-May Provision for Doubtful debts 184.50
To Sundry Debtors a/c 184.50
(Being provision carried against debtors)
31-May Cash a/c 200.00
To GST 18.18
To Sales a/c 181.82
(Wrong recording of the sales, now rectified)
31-May Depreciation 211.17
To Furniture a/c 36.17
To Equipment a/c 175.00
(Being depreciation recorded against assets)
31-May Amortization 100.00
To Licensing Agreement 100.00
(Being amortization recorded against licensing agreement)
Appendix 2: Adjusted Trial Balance
6 | P a g e
tabler-icon-diamond-filled.svg

Paraphrase This Document

Need a fresh take? Get an instant paraphrase of this document with our AI Paraphraser
Document Page
7
The adjusted trial balance as on 31st May 2017 post the rectifying journal entries are as follows:
ADJUSTED TRIAL BALANCE ON 31st MAY
Account Debit Credit
Cash 13,932.00 -
Accounts Receivable 1,660.50 -
Supplies Inventory 205.00 -
Furniture 2,072.10 -
Merchandise Inventory 15,745.00 -
Accounts Payable - 1,120.00
Bank Loan - -
Interest Payable - -
Salaries Payable - -
Sales - 24,454.55
Investment in Securities - -
Advertisement 3,181.82 -
Rent Expense 500.00 -
Other Expense 105.00 -
Profit on sale of Investment in Securities - 1,050.00
Salary 8,550.00 -
Discount - 230.00
GST - 1,954.54
PAYGW - 1,480.00
Capital - 5,700.00
Retained Earning - 19,970.00
Equipment 9,012.00 -
Licensing agreement 1,100.00 -
Salary Outstanding - 600.00
Electricity Expenses 450.00 -
Electricity Expenses Oustanding - 450.00
Provision for Doubtful debts 184.50 -
Depreciation 211.17 -
Ammortization 100.00 -
Total 57,009.09 57,009.09
Appendix 3: Worksheet for quarter including financial statements
The various financial statements prepared for the month and quarter are as follows:
7 | P a g e
Document Page
8
SMART IT
Income Statement
As of 31st May, 2017
Particulars Amount
Revenue 48,655
Cost of Goods Sold (29,587)
Gross Profit 19,068
Depreciation and Amortization expense (703)
Other Expenses and losses (21,786)
Investment income (loss) & profit on sale 1,250
Earnings before interest and tax (2,172)
Interest expense (15)
Earnings before tax (2,187)
Tax expense (372)
Net Income (2,559)
SMART IT
Statement of Retained Earnings
As of 31st May, 2017
Particulars Amount
Retained Earnings, April 1 19,601
Net income (2,559)
Dividends (500)
Retained Earnings, April 30 16,542
8 | P a g e
Document Page
9
Assets Amount Amount Liabilities Amount Amount
Current Current
Cash and Bank 13,932 Accounts payable 1,120
Accounts Receivable 1,845 Salaries Payable 600
Less: Allowance for Doubtful Accounts (185) 1,661 Electricity expenses Payable 450
Merchandise inventory - PAYGW 1,480
Supplies inventory 70 GST payable 1,955
Property, Plant, and Equipment Non-current
Equipment 9,012 Bank Loan -
Furniture 2,072 Owners’ Equity
Other non-current assets Capital Stock 5,700
Investment in Securities (250 Securities) - Retained Earnings 16,542
Licensing agreement, net 1,100
Total Assets 27,847 Total liabilities and Owners’ equity 27,847
-
As of 31st May, 2017
SMART IT
Balance Sheet
9 | P a g e
tabler-icon-diamond-filled.svg

Secure Best Marks with AI Grader

Need help grading? Try our AI Grader for instant feedback on your assignments.
Document Page
10
Appendix 4: Comparative Balance Sheet (trend analysis)
SMART IT
Comparative Balance Sheet
As of 31st May, 2017
Particulars May April Absolute
change
%
change
Assets
Current
Cash and Bank 13,932 12905 1,027 8%
Accounts Receivable 1,661 1845 (184) -10%
Merchandise inventory - 3362 (3,362) -100%
Supplies inventory 70 65 5 8%
Property, Plant, and Equipment
Equipment 9,012 9187 (175) -2%
Furniture 2,072 881 1,191 135%
Other non-current assets
Investment in Securities (250 Securities) - 2450 (2,450) -100%
Licensing agreement, net 1,100 1200 (100) -8%
Total Assets 27,847 31,895 (4,048) -13%
Liabilities
Current
Accounts payable 1,120 3080 (1,960) -64%
Salaries Payable 600 100 500 500%
Interest Payable - 45 (45) -100%
Electricity expenses Payable 450 0 450 100%
PAYGW 1,480 0 1,480 100%
GST payable 1,955 0 1,955 100%
Non-current
Bank Loan - 3000 (3,000) -100%
Owners’ Equity
Capital Stock 5,700 5700 - 0%
Retained Earnings 16,542 19970 (3,428) -17%
Total liabilities and Owners’ equity 27,847 31,895 (4,048) -13%
10 | P a g e
Document Page
11
Appendix 5: Common Size Balance Sheet
SMART IT
Comparative Balance Sheet
As of 31st May, 2017
Particulars May % of total April % of total
Assets
Current
Cash and Bank 13,932 50.0% 12905 40%
Accounts Receivable 1,661 6.0% 1845 6%
Merchandise inventory - 0.0% 3362 11%
Supplies inventory 70 0.3% 65 0%
Property, Plant, and Equipment
Equipment 9,012 32.4% 9187 29%
Furniture 2,072 7.4% 881 3%
Other non-current assets
Investment in Securities (250 Securities) - 0.0% 2450 8%
Licensing agreement, net 1,100 4.0% 1200 4%
Total Assets 27,847 100.0% 31,895 100%
Liabilities
Current
Accounts payable 1,120 4.0% 3080 10%
Salaries Payable 600 2.2% 100 0%
Interest Payable - 0.0% 45 0%
Electricity expenses Payable 450 1.6% 0 0%
PAYGW 1,480 5.3% 0 0%
GST payable 1,955 7.0% 0 0%
Non-current
Bank Loan - 0.0% 3000 9%
Owners’ Equity
Capital Stock 5,700 20.5% 5700 18%
Retained Earnings 16,542 59.4% 19970 63%
Total liabilities and Owners’ equity 27,847 100.0% 31,895 100%
11 | P a g e
Document Page
12
Appendix 6: Ratio Analysis
The ratio analysis for the company is shown below:
SMART IT
Ratio Analysis
Ratio Formula
Result
s
Net Profit Ratio Net Profit/Sales -5.3%
Return on Assets Net Income/Average Assets -8.6%
Return on equity/capital Net Income/Shareholder's equity -11.5%
12 | P a g e
tabler-icon-diamond-filled.svg

Paraphrase This Document

Need a fresh take? Get an instant paraphrase of this document with our AI Paraphraser
Document Page
13
References
Alexander, F., 2016. The Changing Face of Accountability. The Journal of Higher Education, 71(4), pp.
411-431.
Belton, P., 2017. Competitive Strategy: Creating and Sustaining Superior Performance. London: Macat
International ltd.
Bromwich, M. & Scapens, R., 2016. Management Accounting Research: 25 years on. Management
Accounting Research, Volume 31, pp. 1-9.
Choy, Y. K., 2018. Cost-benefit Analysis, Values, Wellbeing and Ethics: An Indigenous Worldview Analysis.
Ecological Economics, p. 145.
Chron, 2017. five-common-features-internal-control-system-business. [Online]
Available at: http://smallbusiness.chron.com/five-common-features-internal-control-system-business-
430.html
[Accessed 07 december 2017].
Das, P., 2017. Financing Pattern and Utilization of Fixed Assets - A Study. Asian Journal of Social Science
Studies, 2(2), pp. 10-17.
Dichev, I., 2017. On the conceptual foundations of financial reporting. Accounting and Business
Research, 47(6), pp. 617-632.
Goldmann, K., 2016. Financial Liquidity and Profitability Management in Practice of Polish Business.
Financial Environment and Business Development, Volume 4, pp. 103-112.
Heminway, J., 2017. Shareholder Wealth Maximization as a Function of Statutes, Decisional Law, and
Organic Documents. SSRN, pp. 1-35.
Jefferson, M., 2017. Energy, Complexity and Wealth Maximization, R. Ayres. Springer, Switzerland.
Technological Forecasting and Social Change, pp. 353-354.
Kuhn, J. & Morris, B., 2016. IT internal control weaknesses and the market value of firms. Journal of
Enterprise Information Management, 30(6).
Linden, B. & Freeman, R., 2017. Profit and Other Values: Thick Evaluation in Decision Making. Business
Ethics Quarterly, 27(3), pp. 353-379.
13 | P a g e
chevron_up_icon
1 out of 14
circle_padding
hide_on_mobile
zoom_out_icon
logo.png

Your All-in-One AI-Powered Toolkit for Academic Success.

Available 24*7 on WhatsApp / Email

[object Object]