Cost Accounting and Budgeting Analysis for Smart Looks Company
VerifiedAdded on 2020/02/14
|15
|3452
|96
Report
AI Summary
This report provides a comprehensive analysis of the cost accounting and budgeting practices of Smart Looks, a cloth manufacturing company. The report begins by classifying various costs (fixed, variable, and semi-variable) and presents unit cost calculations for different production levels. Graphical representations are used to analyze cost data, highlighting the impact of variable costs on profitability. The report then delves into inventory valuation, demonstrating the application of FIFO, LIFO, and average cost methods. Furthermore, the report explores critical success factors (CSFs) for Smart Looks, including customer experience, product quality, operational efficiency, and cost reduction, providing key performance indicators (KPIs) for each. The report also defines the purpose and methods of budgeting, including zero-based, fixed, and flexible budgeting, and recommends zero-based budgeting for Smart Looks. Overall, the report offers a detailed examination of financial management techniques relevant to the company's operations, with the goal of improving financial performance and decision-making.
Management Accounting: Costing and
Budgeting
Budgeting
Paraphrase This Document
Need a fresh take? Get an instant paraphrase of this document with our AI Paraphraser
Table of Contents
Introduction.....................................................................................................................................3
Task 1...............................................................................................................................................3
Q1.................................................................................................................................................3
Q2.................................................................................................................................................4
Q3.................................................................................................................................................6
Q4 ................................................................................................................................................7
Q5.................................................................................................................................................8
Task 2.............................................................................................................................................10
Q6...............................................................................................................................................10
Q7...............................................................................................................................................11
Q8...............................................................................................................................................12
Task 3.............................................................................................................................................12
Q9...............................................................................................................................................12
Q10.............................................................................................................................................14
Conclusion.....................................................................................................................................14
References......................................................................................................................................15
2
INTRODUCTION
Management accounting can be defined as form of accounting which enable organization
in conducting their operation with more efficiency. It gives statistical information to the
managers so that they can take effective decisions for the growth of the companies. That is the
great tool that assists in planning, budgeting, controlling and measuring the overall performance
of the entity to great extent (Lobo and Zhao, 2013). For the present report Smart Looks is being
taken into account which is a cloth making organization and supply its products to various
retailers. Current assignment will classify the various type of costs of the cited firm. It will
calculate the unit cost and these costs will be analyzed in graphical way. Furthermore, FIFO,
LIFO and average cost methods will be used in order to compute the inventory. Sales,
production, labour, total overhead budget will be prepared in this study.
TASK 1
Q1
A) Classification of costs Fixed cost: It is the type of cost which remain constant in each situation. These are
operating expenditures which are necessary for the entities for running the business
smoothly. These are unavoidable spending which help the management of Smart Looks
in analyzing the break even point (Schreinemachers, Ebert and Wu, 2014). Variable costs: This is another type of expenditures that are directly depended upon the
quantity of output. If production volume get changed then it affects the variable costs as
well. Semi variable costs: It is the type of costing which is nature of both fixed and variable
costs. It is fixed when amount of spending is within specific level but when it gets
surpassed then it turns into variable thus, called as semi-variable costs (Tsai P. and et.al,
2015).
Classifications of costs are as following:
Fixed cost Variable cost Semi-veritable cost
Material for cloths
3
⊘ This is a preview!⊘
Do you want full access?
Subscribe today to unlock all pages.
Trusted by 1+ million students worldwide
Factory rent
Power for sewing machines
in factory
Factory supervisors wages
Packaging material
Telephone
Office rates
Delivery drivers pay
Factory heating
b) Other ways of classifying the costs
There are many other ways of classifying the costs, which are described as below”
Controllable and Uncontrollable costs
Controllable cost can be defined as such expenditures which can be influenced by the
management decision. Direct material, direct labour are such decision for that managers of Smart
Looks are responsible and individual can take decision on these matters. For example sales
manage can make control over salaries of employees, individual can give commission to them
rather than fixed wages. On other hand uncontrollable costs are such spending over which
managers have no control. For example rent, corporate overhead allocation etc (Vasin,
Kartunova and Weber, 2013).
Normal and abnormal costs
Normal costs are those expenditures which takes always place in the normal conditions.
For instance maintenance, salaries paid etc. On other hand abnormal costs are such spending
which are irregular such as destruction due to fire, lock outs etc.
Historical and pre-determined costs
Pre-determined costs are which expenditures which are computed before the
starting of production process in process. Historical expenditures are such cost which are
available when production gets completed (Robbins and Simonsen, 2012).
4
Paraphrase This Document
Need a fresh take? Get an instant paraphrase of this document with our AI Paraphraser
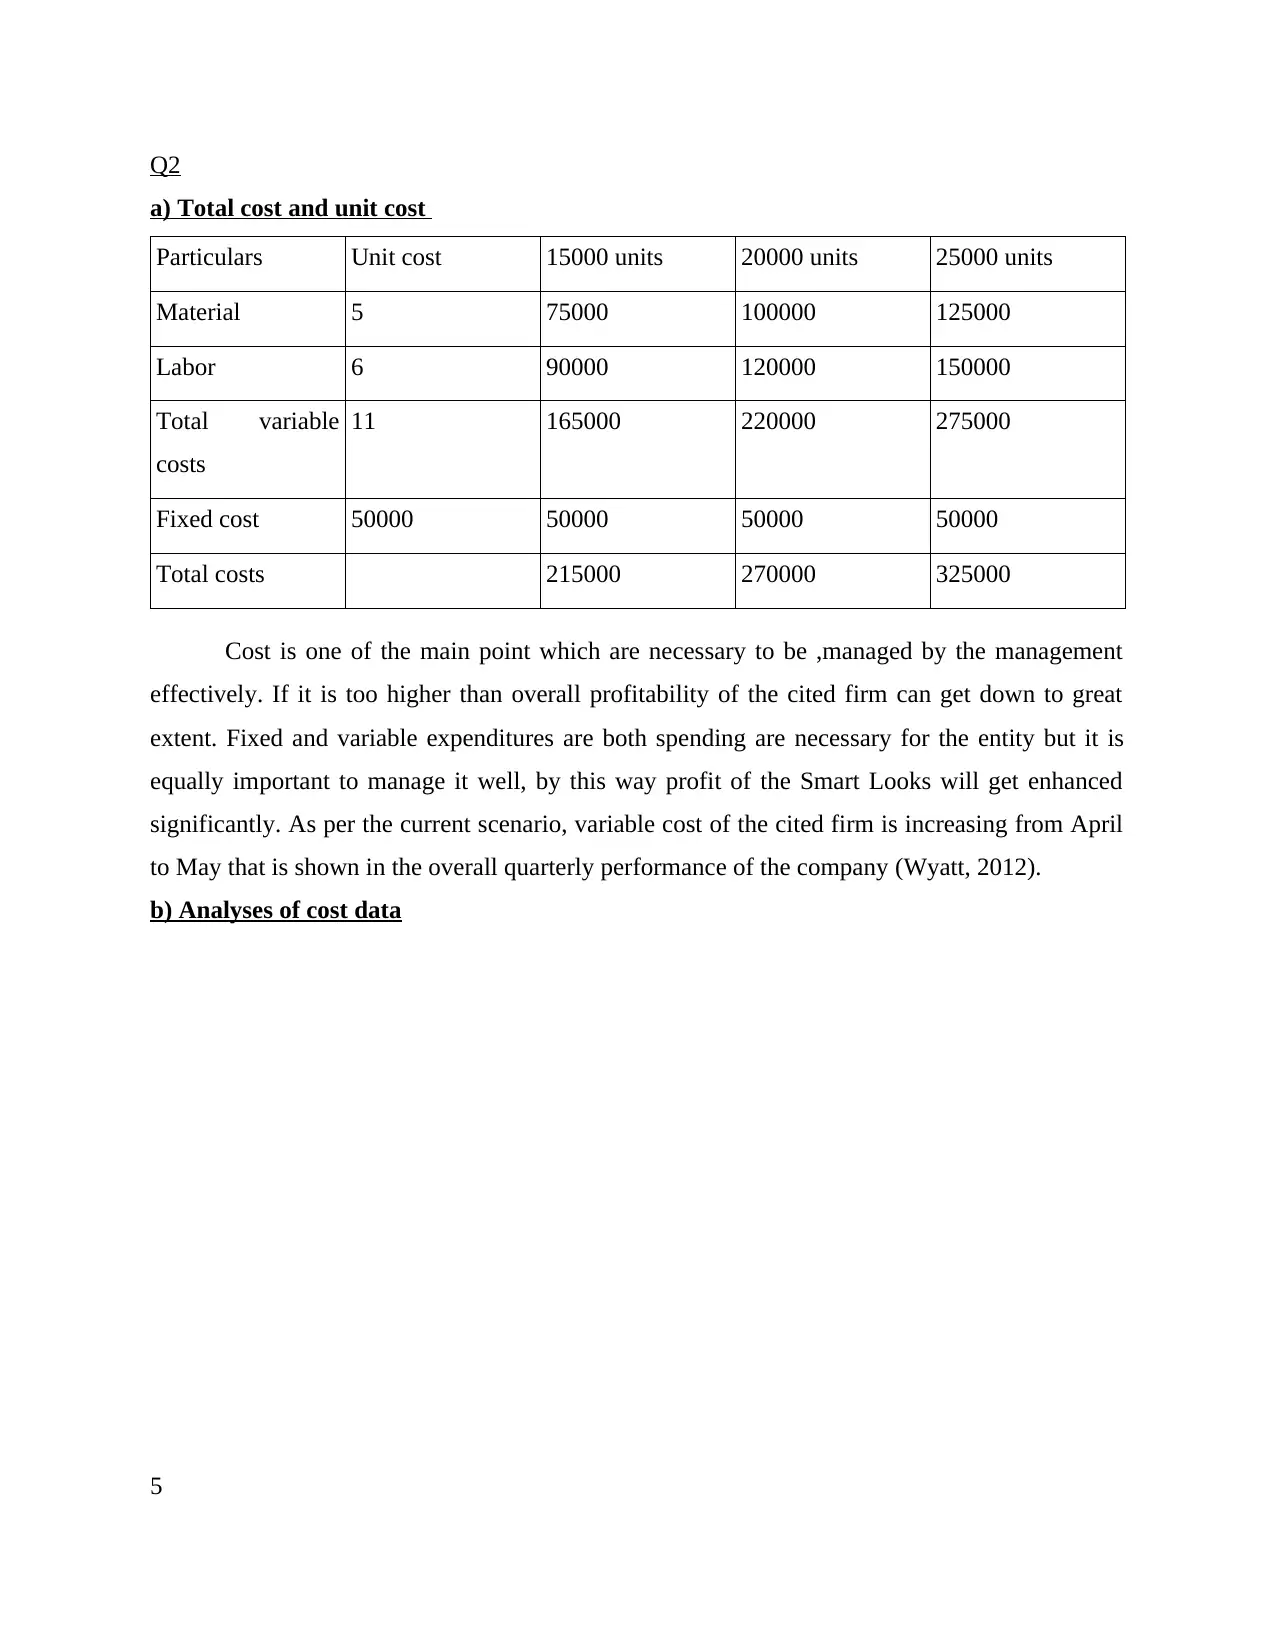
Q2
a) Total cost and unit cost
Particulars Unit cost 15000 units 20000 units 25000 units
Material 5 75000 100000 125000
Labor 6 90000 120000 150000
Total variable
costs
11 165000 220000 275000
Fixed cost 50000 50000 50000 50000
Total costs 215000 270000 325000
Cost is one of the main point which are necessary to be ,managed by the management
effectively. If it is too higher than overall profitability of the cited firm can get down to great
extent. Fixed and variable expenditures are both spending are necessary for the entity but it is
equally important to manage it well, by this way profit of the Smart Looks will get enhanced
significantly. As per the current scenario, variable cost of the cited firm is increasing from April
to May that is shown in the overall quarterly performance of the company (Wyatt, 2012).
b) Analyses of cost data
5
Material
Labor
Total variable costs
Fixed cost
Total costs
0
50000
100000
150000
200000
250000
300000
350000
15000 units
20000 units
25000 units
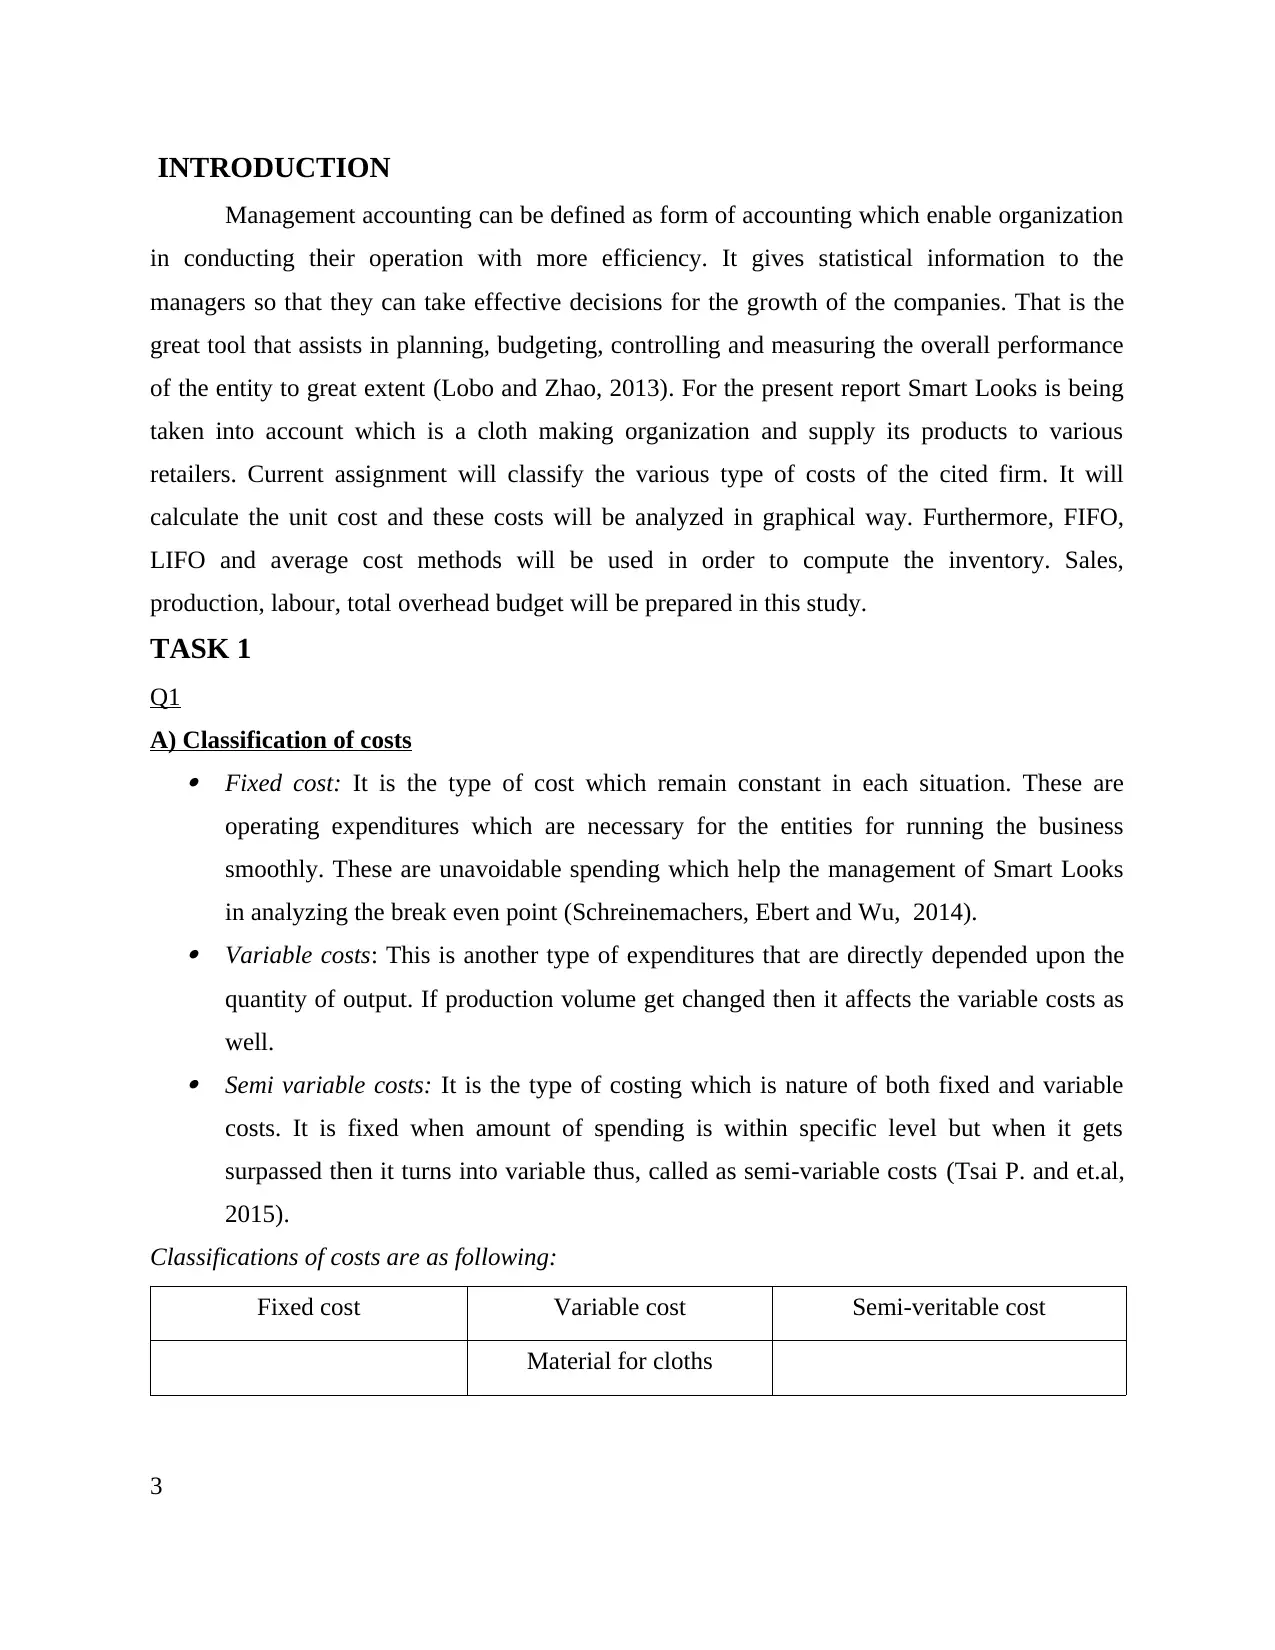
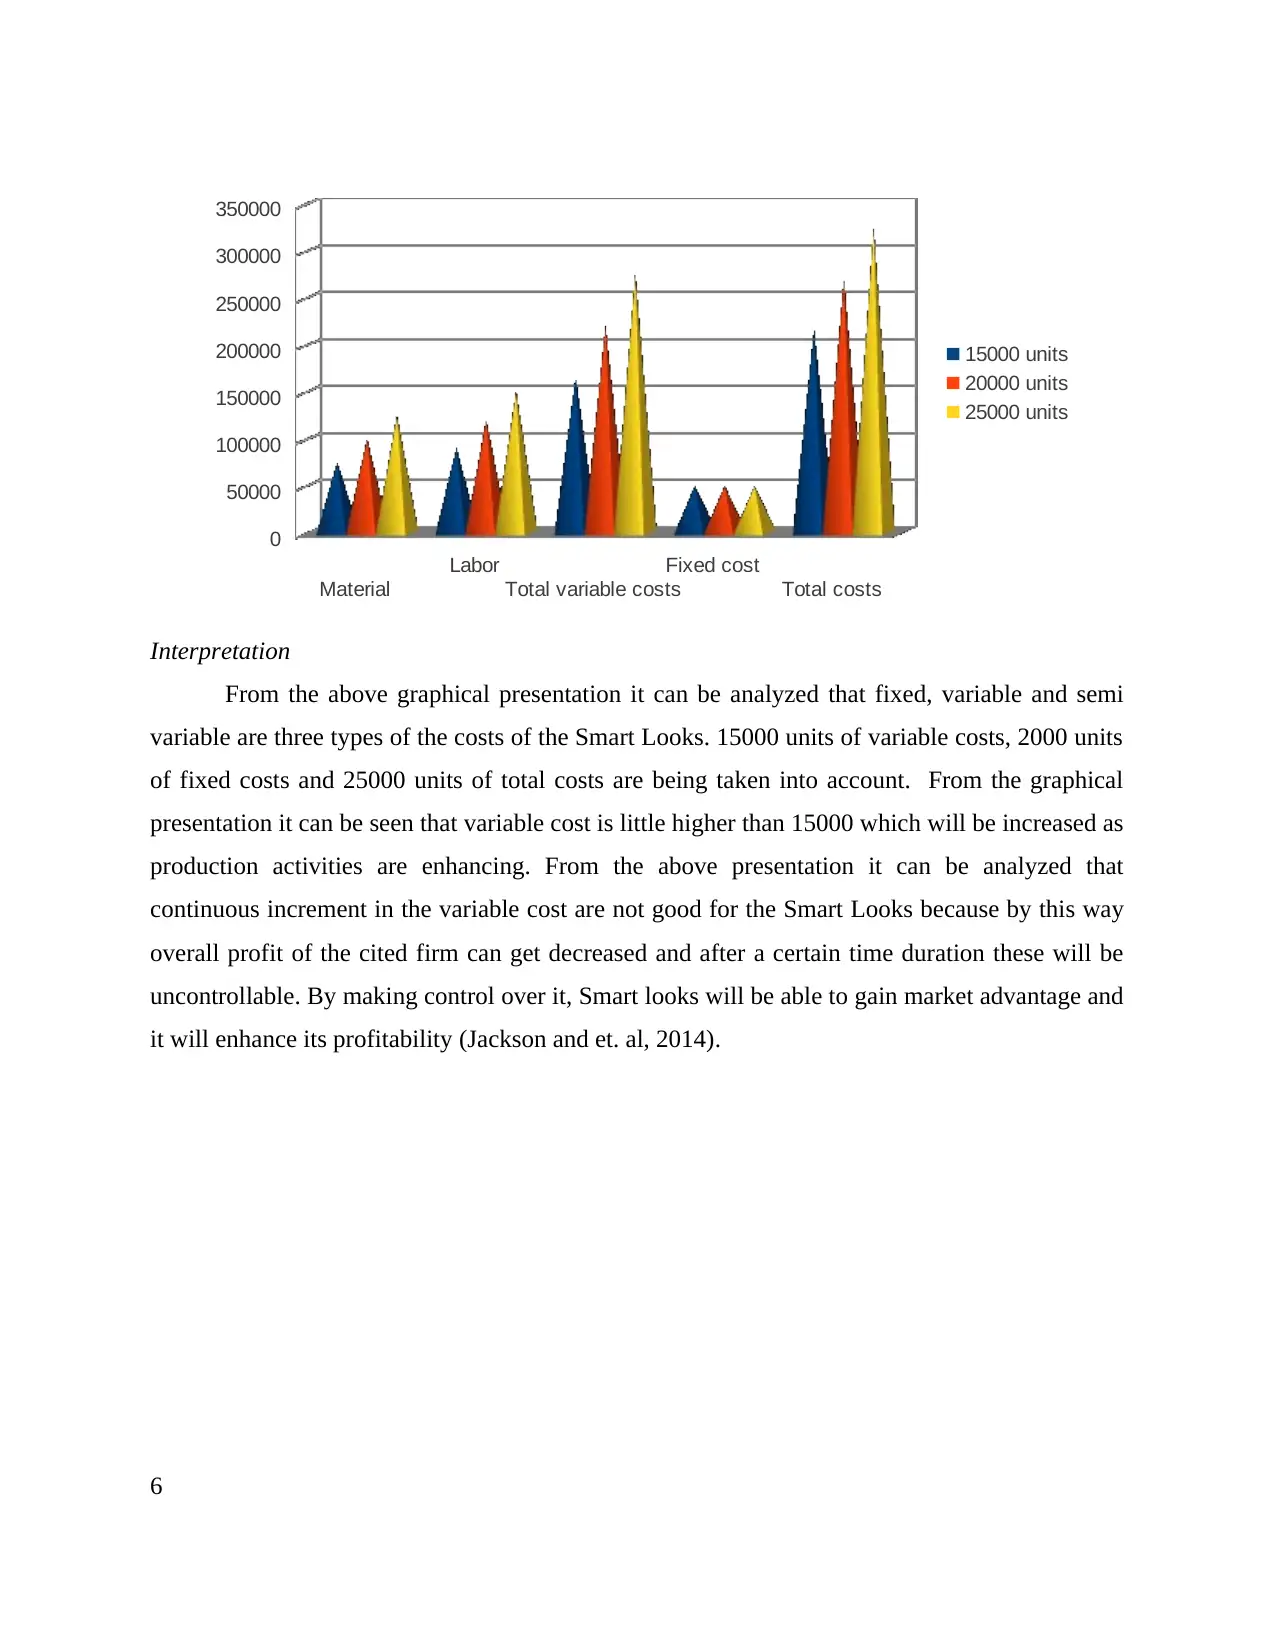
Interpretation
From the above graphical presentation it can be analyzed that fixed, variable and semi
variable are three types of the costs of the Smart Looks. 15000 units of variable costs, 2000 units
of fixed costs and 25000 units of total costs are being taken into account. From the graphical
presentation it can be seen that variable cost is little higher than 15000 which will be increased as
production activities are enhancing. From the above presentation it can be analyzed that
continuous increment in the variable cost are not good for the Smart Looks because by this way
overall profit of the cited firm can get decreased and after a certain time duration these will be
uncontrollable. By making control over it, Smart looks will be able to gain market advantage and
it will enhance its profitability (Jackson and et. al, 2014).
6
Labor
Total variable costs
Fixed cost
Total costs
0
50000
100000
150000
200000
250000
300000
350000
15000 units
20000 units
25000 units
Interpretation
From the above graphical presentation it can be analyzed that fixed, variable and semi
variable are three types of the costs of the Smart Looks. 15000 units of variable costs, 2000 units
of fixed costs and 25000 units of total costs are being taken into account. From the graphical
presentation it can be seen that variable cost is little higher than 15000 which will be increased as
production activities are enhancing. From the above presentation it can be analyzed that
continuous increment in the variable cost are not good for the Smart Looks because by this way
overall profit of the cited firm can get decreased and after a certain time duration these will be
uncontrollable. By making control over it, Smart looks will be able to gain market advantage and
it will enhance its profitability (Jackson and et. al, 2014).
6
⊘ This is a preview!⊘
Do you want full access?
Subscribe today to unlock all pages.
Trusted by 1+ million students worldwide
15000 units 20000 units 25000 units
0
50000
100000
150000
200000
250000
300000
350000
Total variable costs
Fixed cost
Total costs
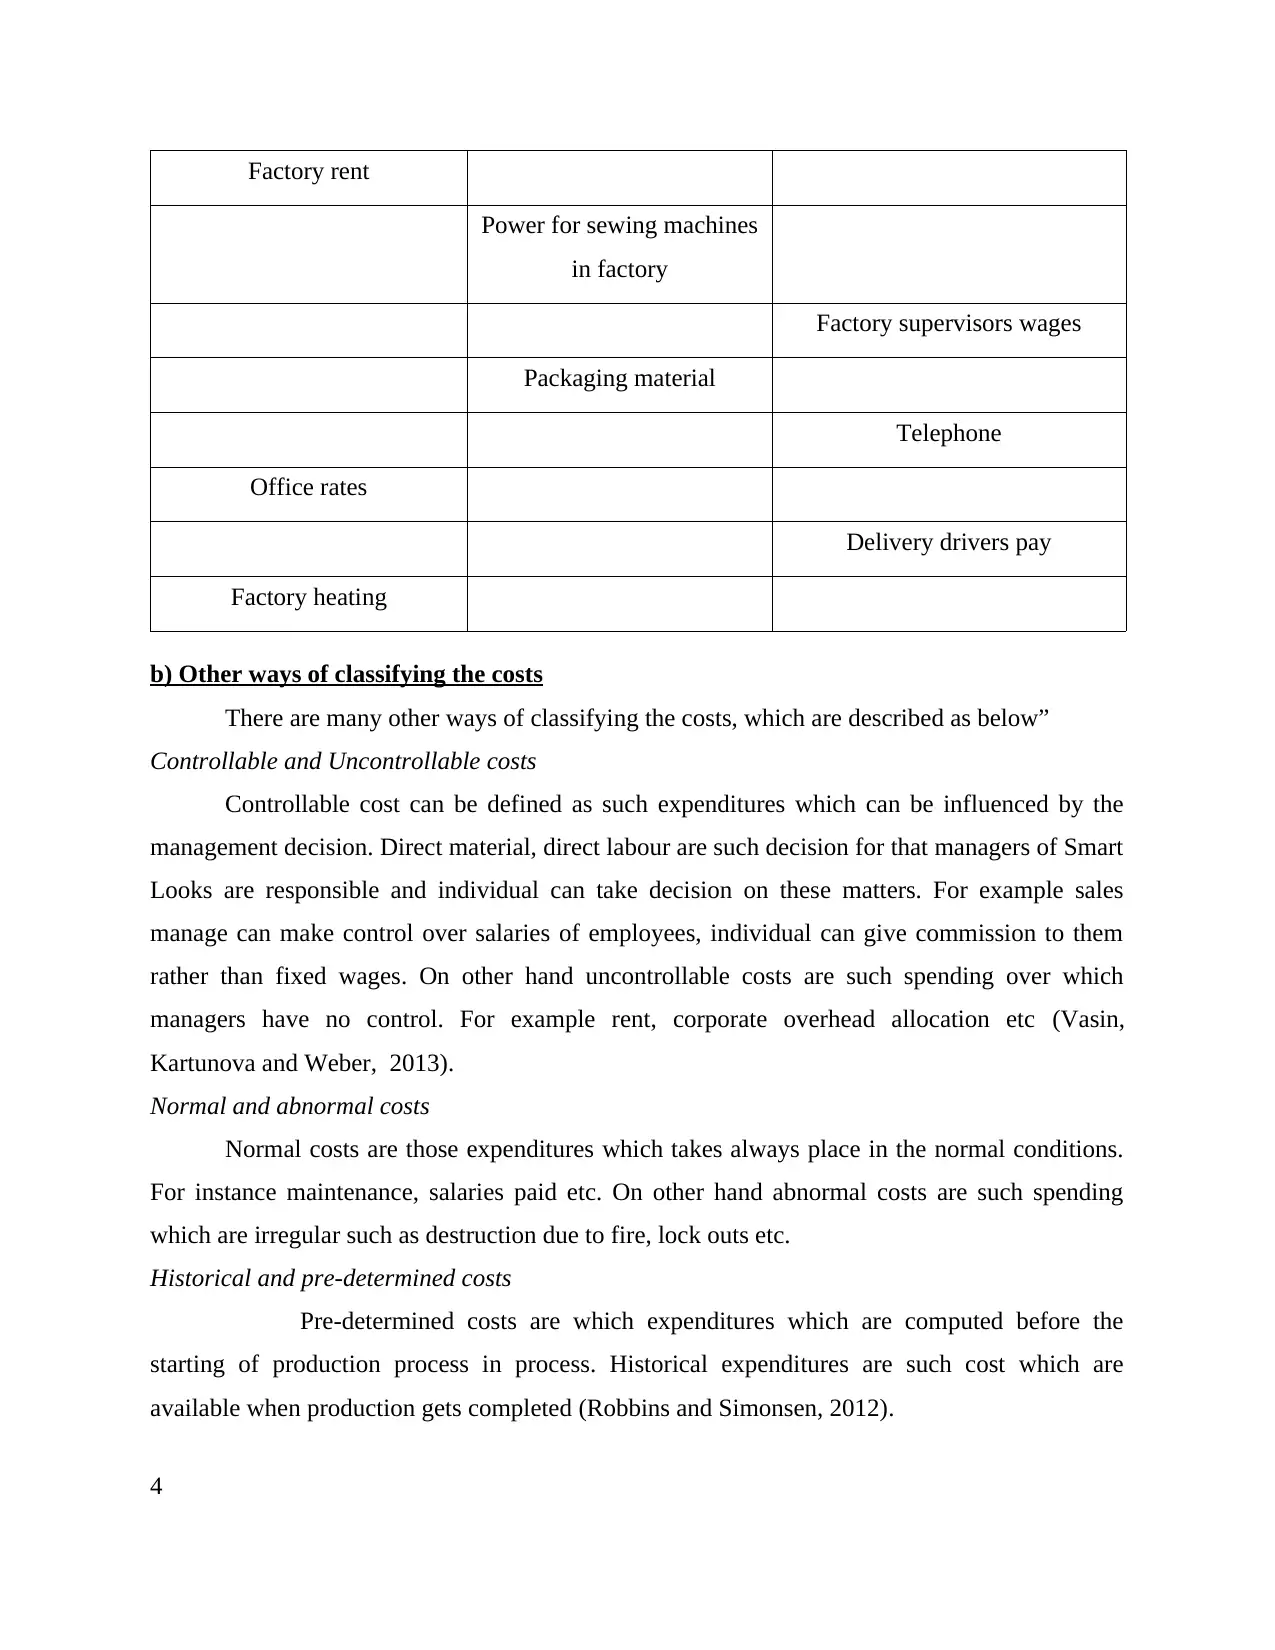
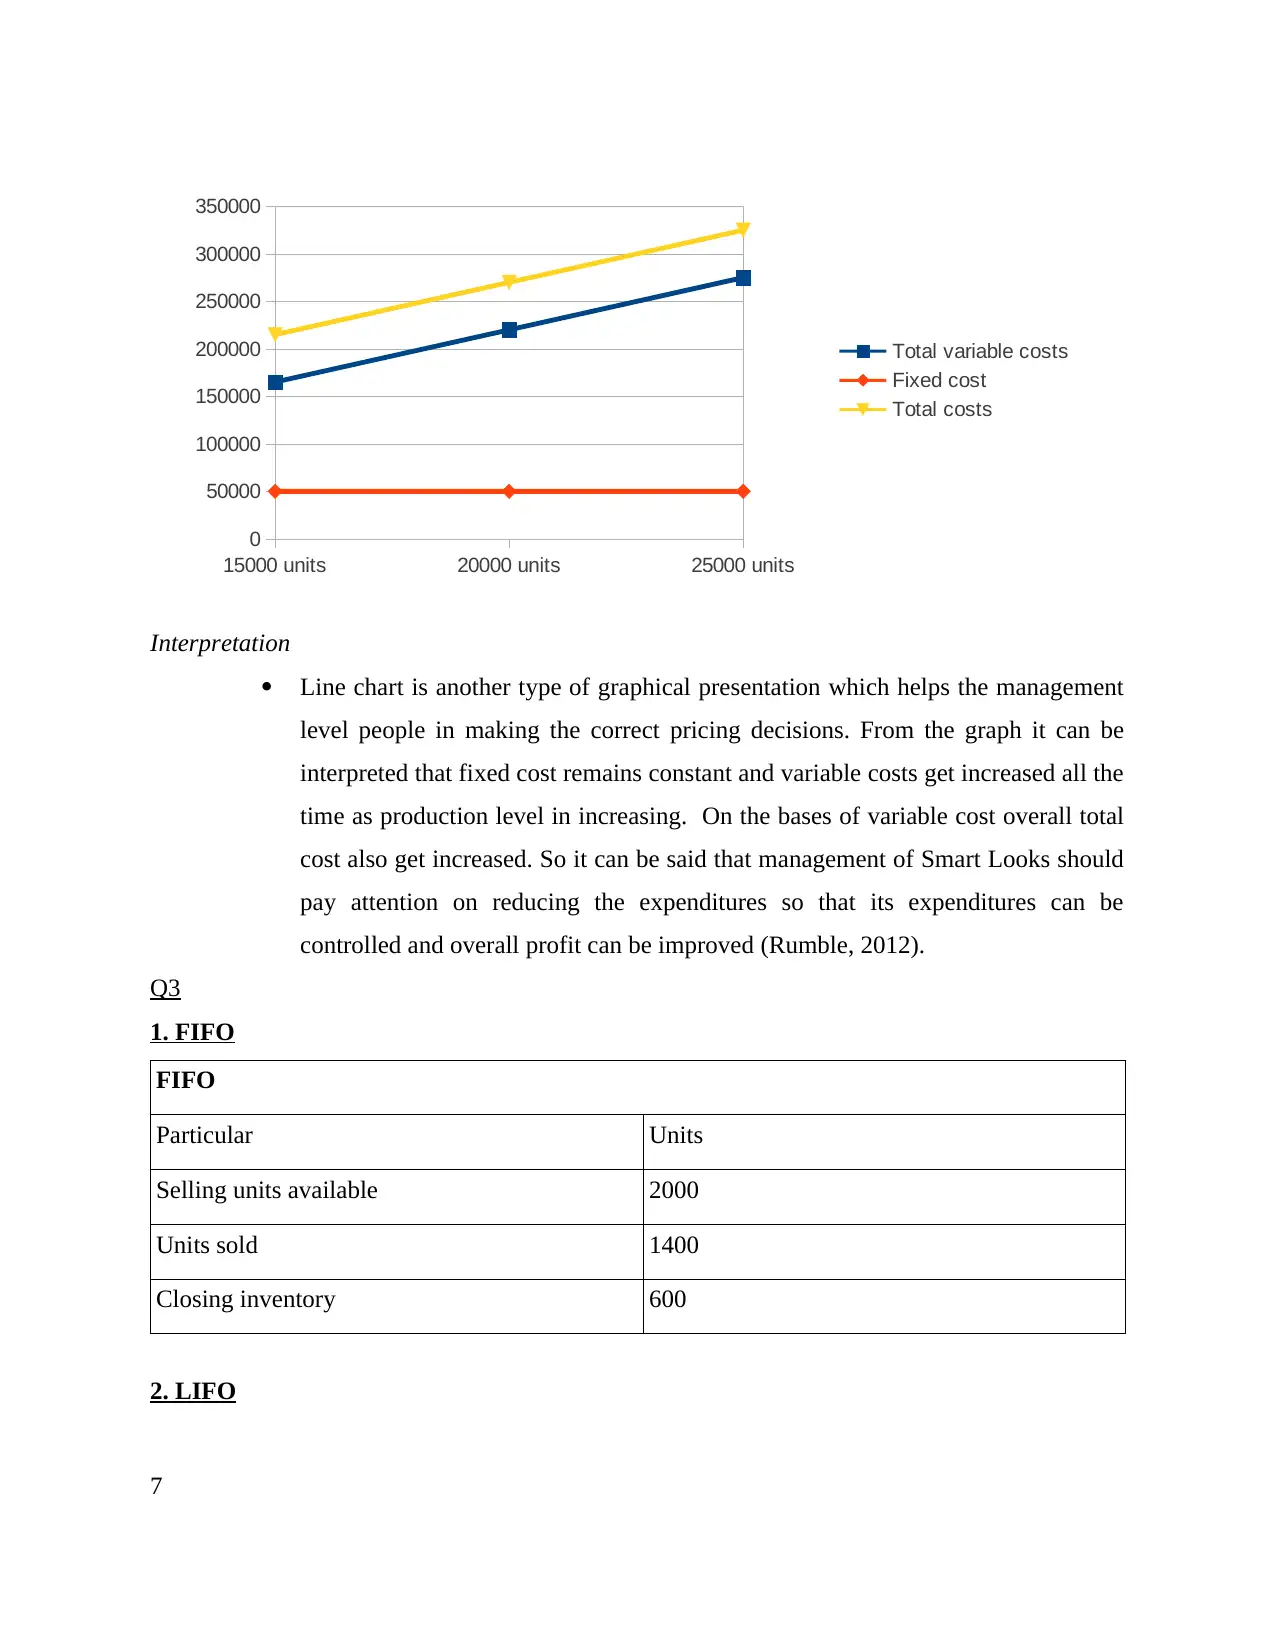
Interpretation
Line chart is another type of graphical presentation which helps the management
level people in making the correct pricing decisions. From the graph it can be
interpreted that fixed cost remains constant and variable costs get increased all the
time as production level in increasing. On the bases of variable cost overall total
cost also get increased. So it can be said that management of Smart Looks should
pay attention on reducing the expenditures so that its expenditures can be
controlled and overall profit can be improved (Rumble, 2012).
Q3
1. FIFO
FIFO
Particular Units
Selling units available 2000
Units sold 1400
Closing inventory 600
2. LIFO
7
0
50000
100000
150000
200000
250000
300000
350000
Total variable costs
Fixed cost
Total costs
Interpretation
Line chart is another type of graphical presentation which helps the management
level people in making the correct pricing decisions. From the graph it can be
interpreted that fixed cost remains constant and variable costs get increased all the
time as production level in increasing. On the bases of variable cost overall total
cost also get increased. So it can be said that management of Smart Looks should
pay attention on reducing the expenditures so that its expenditures can be
controlled and overall profit can be improved (Rumble, 2012).
Q3
1. FIFO
FIFO
Particular Units
Selling units available 2000
Units sold 1400
Closing inventory 600
2. LIFO
7
Paraphrase This Document
Need a fresh take? Get an instant paraphrase of this document with our AI Paraphraser
LIFO
Particular Units
Selling units available 2000
Units sold 1400
Closing inventory 600
3. Average cost
Average cost
Particular Units
Selling units available 2000
Units sold 1400
Closing inventory 600
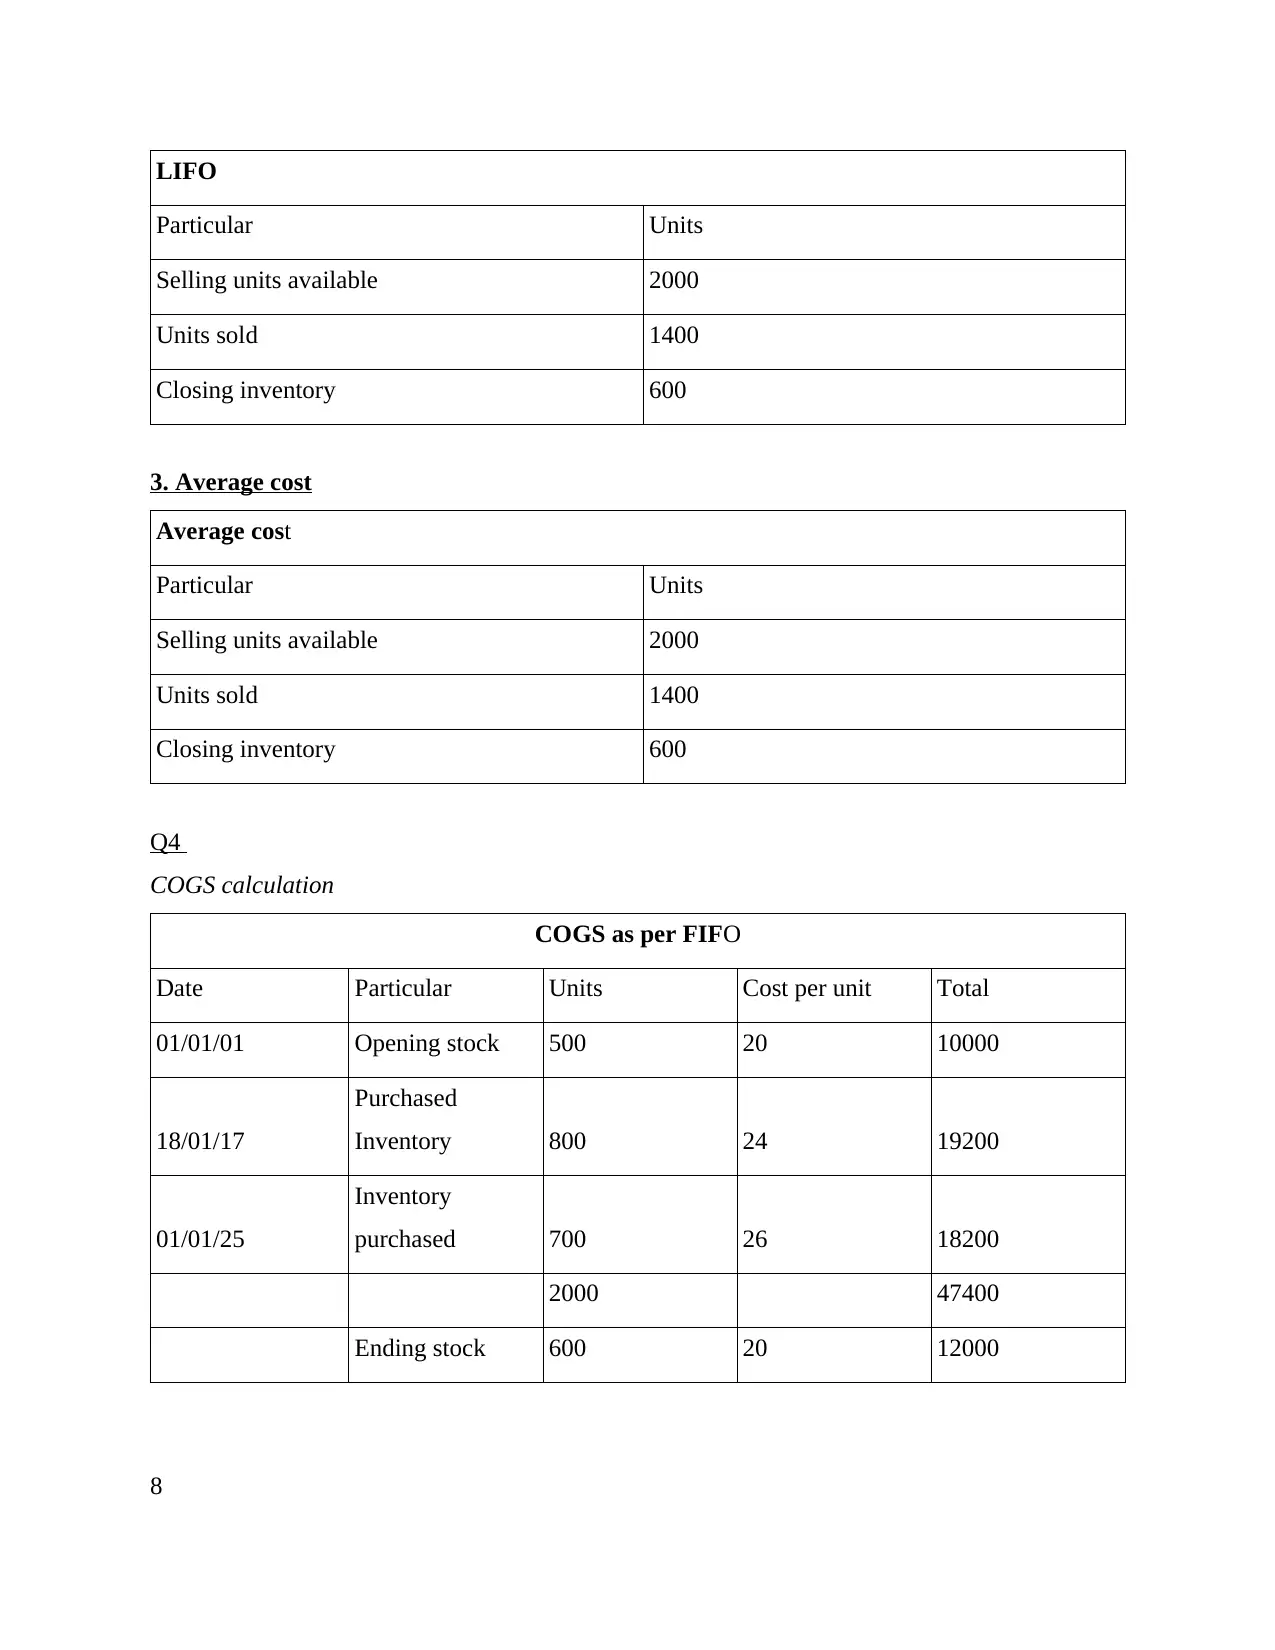
Q4
COGS calculation
COGS as per FIFO
Date Particular Units Cost per unit Total
01/01/01 Opening stock 500 20 10000
18/01/17
Purchased
Inventory 800 24 19200
01/01/25
Inventory
purchased 700 26 18200
2000 47400
Ending stock 600 20 12000
8
Particular Units
Selling units available 2000
Units sold 1400
Closing inventory 600
3. Average cost
Average cost
Particular Units
Selling units available 2000
Units sold 1400
Closing inventory 600
Q4
COGS calculation
COGS as per FIFO
Date Particular Units Cost per unit Total
01/01/01 Opening stock 500 20 10000
18/01/17
Purchased
Inventory 800 24 19200
01/01/25
Inventory
purchased 700 26 18200
2000 47400
Ending stock 600 20 12000
8
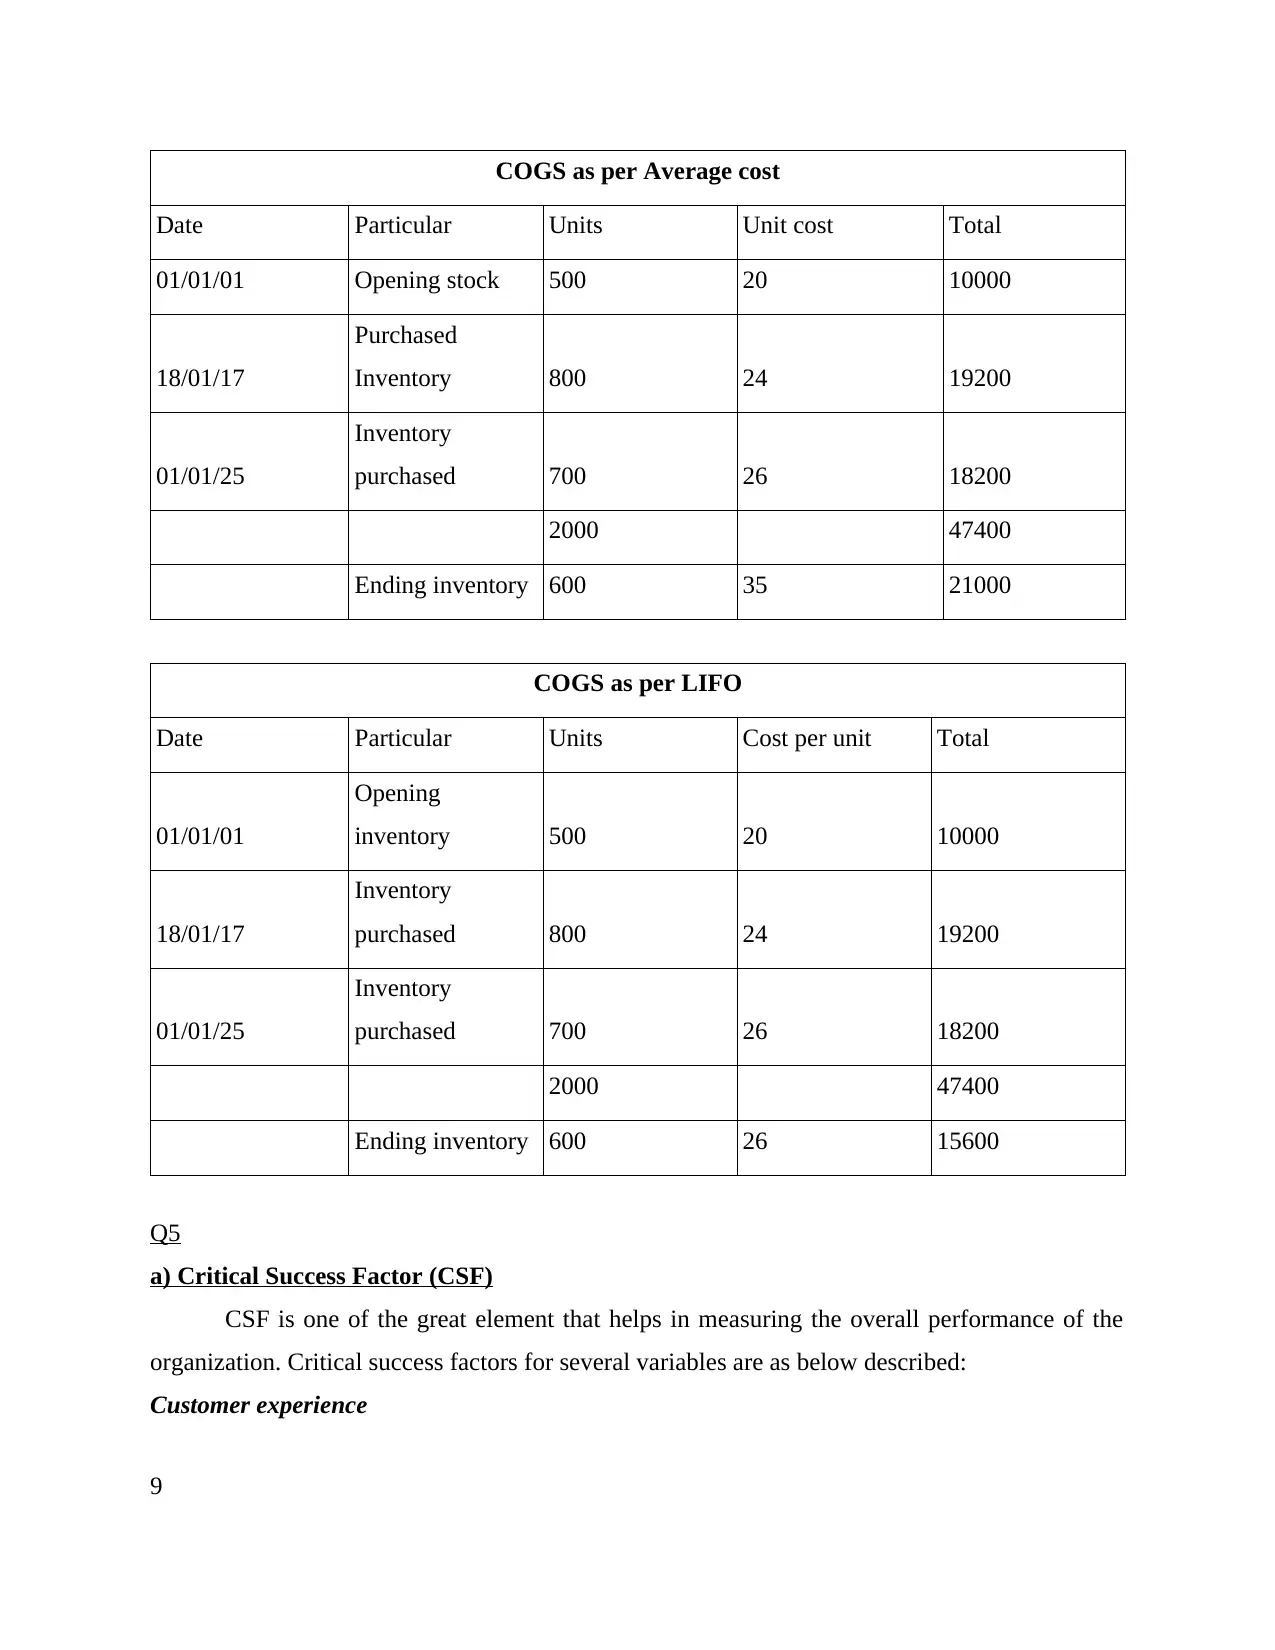
COGS as per Average cost
Date Particular Units Unit cost Total
01/01/01 Opening stock 500 20 10000
18/01/17
Purchased
Inventory 800 24 19200
01/01/25
Inventory
purchased 700 26 18200
2000 47400
Ending inventory 600 35 21000
COGS as per LIFO
Date Particular Units Cost per unit Total
01/01/01
Opening
inventory 500 20 10000
18/01/17
Inventory
purchased 800 24 19200
01/01/25
Inventory
purchased 700 26 18200
2000 47400
Ending inventory 600 26 15600
Q5
a) Critical Success Factor (CSF)
CSF is one of the great element that helps in measuring the overall performance of the
organization. Critical success factors for several variables are as below described:
Customer experience
9
⊘ This is a preview!⊘
Do you want full access?
Subscribe today to unlock all pages.
Trusted by 1+ million students worldwide
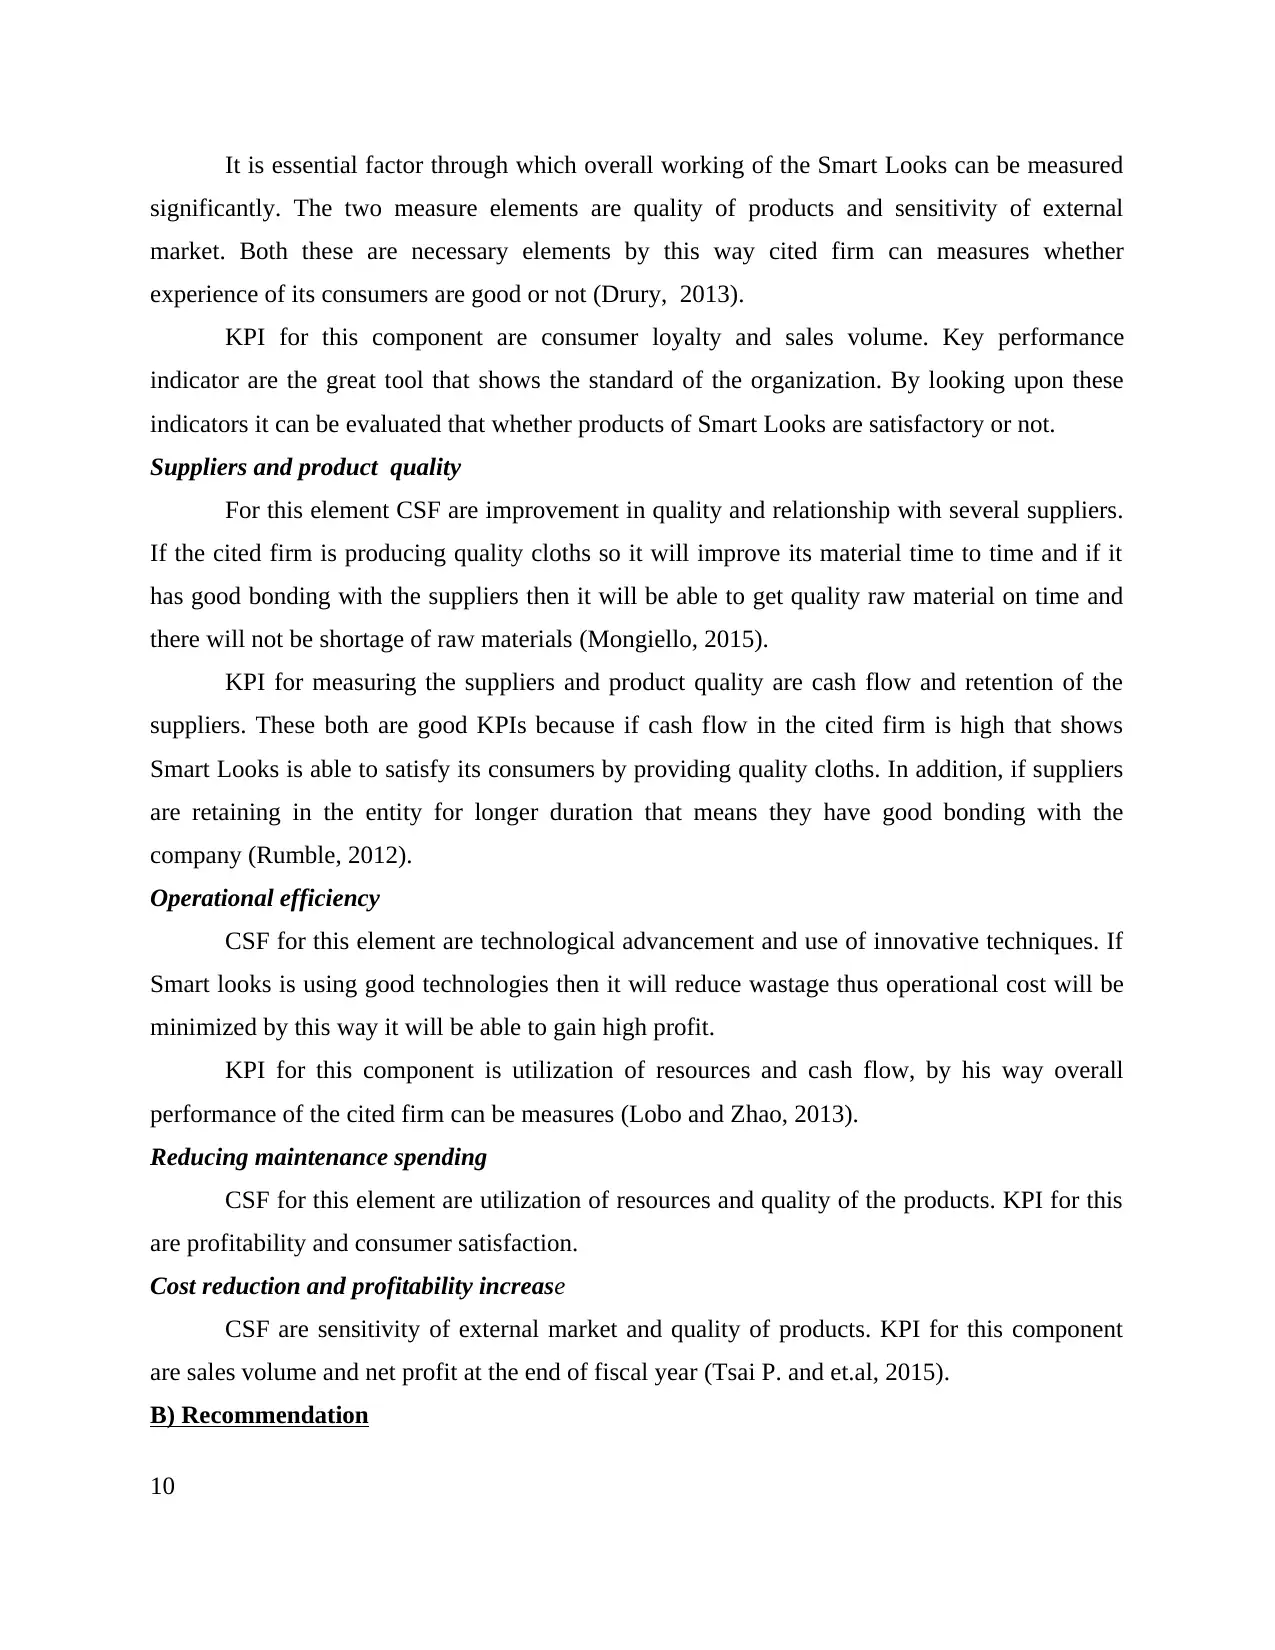
It is essential factor through which overall working of the Smart Looks can be measured
significantly. The two measure elements are quality of products and sensitivity of external
market. Both these are necessary elements by this way cited firm can measures whether
experience of its consumers are good or not (Drury, 2013).
KPI for this component are consumer loyalty and sales volume. Key performance
indicator are the great tool that shows the standard of the organization. By looking upon these
indicators it can be evaluated that whether products of Smart Looks are satisfactory or not.
Suppliers and product quality
For this element CSF are improvement in quality and relationship with several suppliers.
If the cited firm is producing quality cloths so it will improve its material time to time and if it
has good bonding with the suppliers then it will be able to get quality raw material on time and
there will not be shortage of raw materials (Mongiello, 2015).
KPI for measuring the suppliers and product quality are cash flow and retention of the
suppliers. These both are good KPIs because if cash flow in the cited firm is high that shows
Smart Looks is able to satisfy its consumers by providing quality cloths. In addition, if suppliers
are retaining in the entity for longer duration that means they have good bonding with the
company (Rumble, 2012).
Operational efficiency
CSF for this element are technological advancement and use of innovative techniques. If
Smart looks is using good technologies then it will reduce wastage thus operational cost will be
minimized by this way it will be able to gain high profit.
KPI for this component is utilization of resources and cash flow, by his way overall
performance of the cited firm can be measures (Lobo and Zhao, 2013).
Reducing maintenance spending
CSF for this element are utilization of resources and quality of the products. KPI for this
are profitability and consumer satisfaction.
Cost reduction and profitability increase
CSF are sensitivity of external market and quality of products. KPI for this component
are sales volume and net profit at the end of fiscal year (Tsai P. and et.al, 2015).
B) Recommendation
10
Paraphrase This Document
Need a fresh take? Get an instant paraphrase of this document with our AI Paraphraser
1. Reduction of cost is very essential for the Smart looks company, that is only possible
when cited firm utilize its resources well. By effective utilization of resources
corporation will be able to cut the cost. In addition, if entity enhances production level
then it will be beneficial for the firm and overall cost will get reduced to great extent
2. Value and quality is the important factor for making improvement in this section
managers of Smart Looks can monitor and control the activities of the business. By this
way mistakes will be identified that will help in making solutions for eliminating the
mistakes.
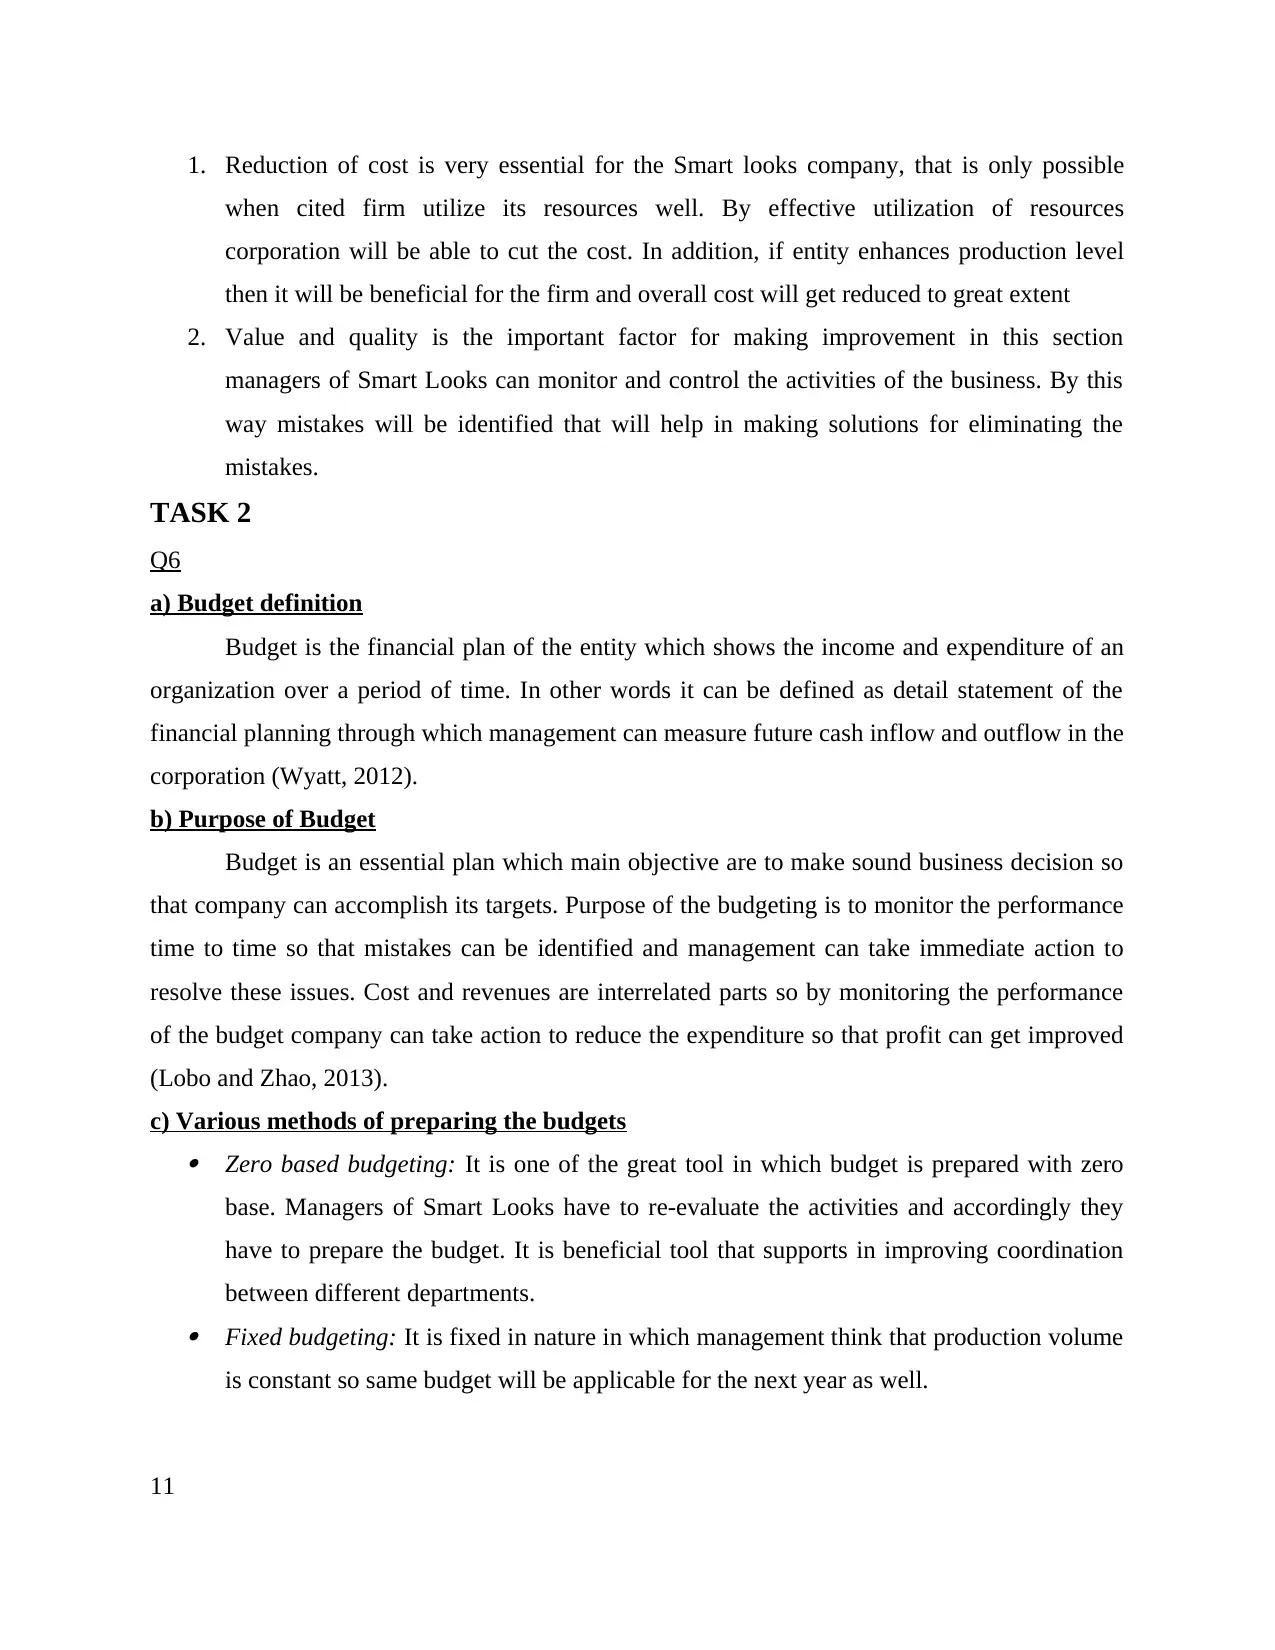
TASK 2
Q6
a) Budget definition
Budget is the financial plan of the entity which shows the income and expenditure of an
organization over a period of time. In other words it can be defined as detail statement of the
financial planning through which management can measure future cash inflow and outflow in the
corporation (Wyatt, 2012).
b) Purpose of Budget
Budget is an essential plan which main objective are to make sound business decision so
that company can accomplish its targets. Purpose of the budgeting is to monitor the performance
time to time so that mistakes can be identified and management can take immediate action to
resolve these issues. Cost and revenues are interrelated parts so by monitoring the performance
of the budget company can take action to reduce the expenditure so that profit can get improved
(Lobo and Zhao, 2013).
c) Various methods of preparing the budgets Zero based budgeting: It is one of the great tool in which budget is prepared with zero
base. Managers of Smart Looks have to re-evaluate the activities and accordingly they
have to prepare the budget. It is beneficial tool that supports in improving coordination
between different departments. Fixed budgeting: It is fixed in nature in which management think that production volume
is constant so same budget will be applicable for the next year as well.
11
when cited firm utilize its resources well. By effective utilization of resources
corporation will be able to cut the cost. In addition, if entity enhances production level
then it will be beneficial for the firm and overall cost will get reduced to great extent
2. Value and quality is the important factor for making improvement in this section
managers of Smart Looks can monitor and control the activities of the business. By this
way mistakes will be identified that will help in making solutions for eliminating the
mistakes.
TASK 2
Q6
a) Budget definition
Budget is the financial plan of the entity which shows the income and expenditure of an
organization over a period of time. In other words it can be defined as detail statement of the
financial planning through which management can measure future cash inflow and outflow in the
corporation (Wyatt, 2012).
b) Purpose of Budget
Budget is an essential plan which main objective are to make sound business decision so
that company can accomplish its targets. Purpose of the budgeting is to monitor the performance
time to time so that mistakes can be identified and management can take immediate action to
resolve these issues. Cost and revenues are interrelated parts so by monitoring the performance
of the budget company can take action to reduce the expenditure so that profit can get improved
(Lobo and Zhao, 2013).
c) Various methods of preparing the budgets Zero based budgeting: It is one of the great tool in which budget is prepared with zero
base. Managers of Smart Looks have to re-evaluate the activities and accordingly they
have to prepare the budget. It is beneficial tool that supports in improving coordination
between different departments. Fixed budgeting: It is fixed in nature in which management think that production volume
is constant so same budget will be applicable for the next year as well.
11
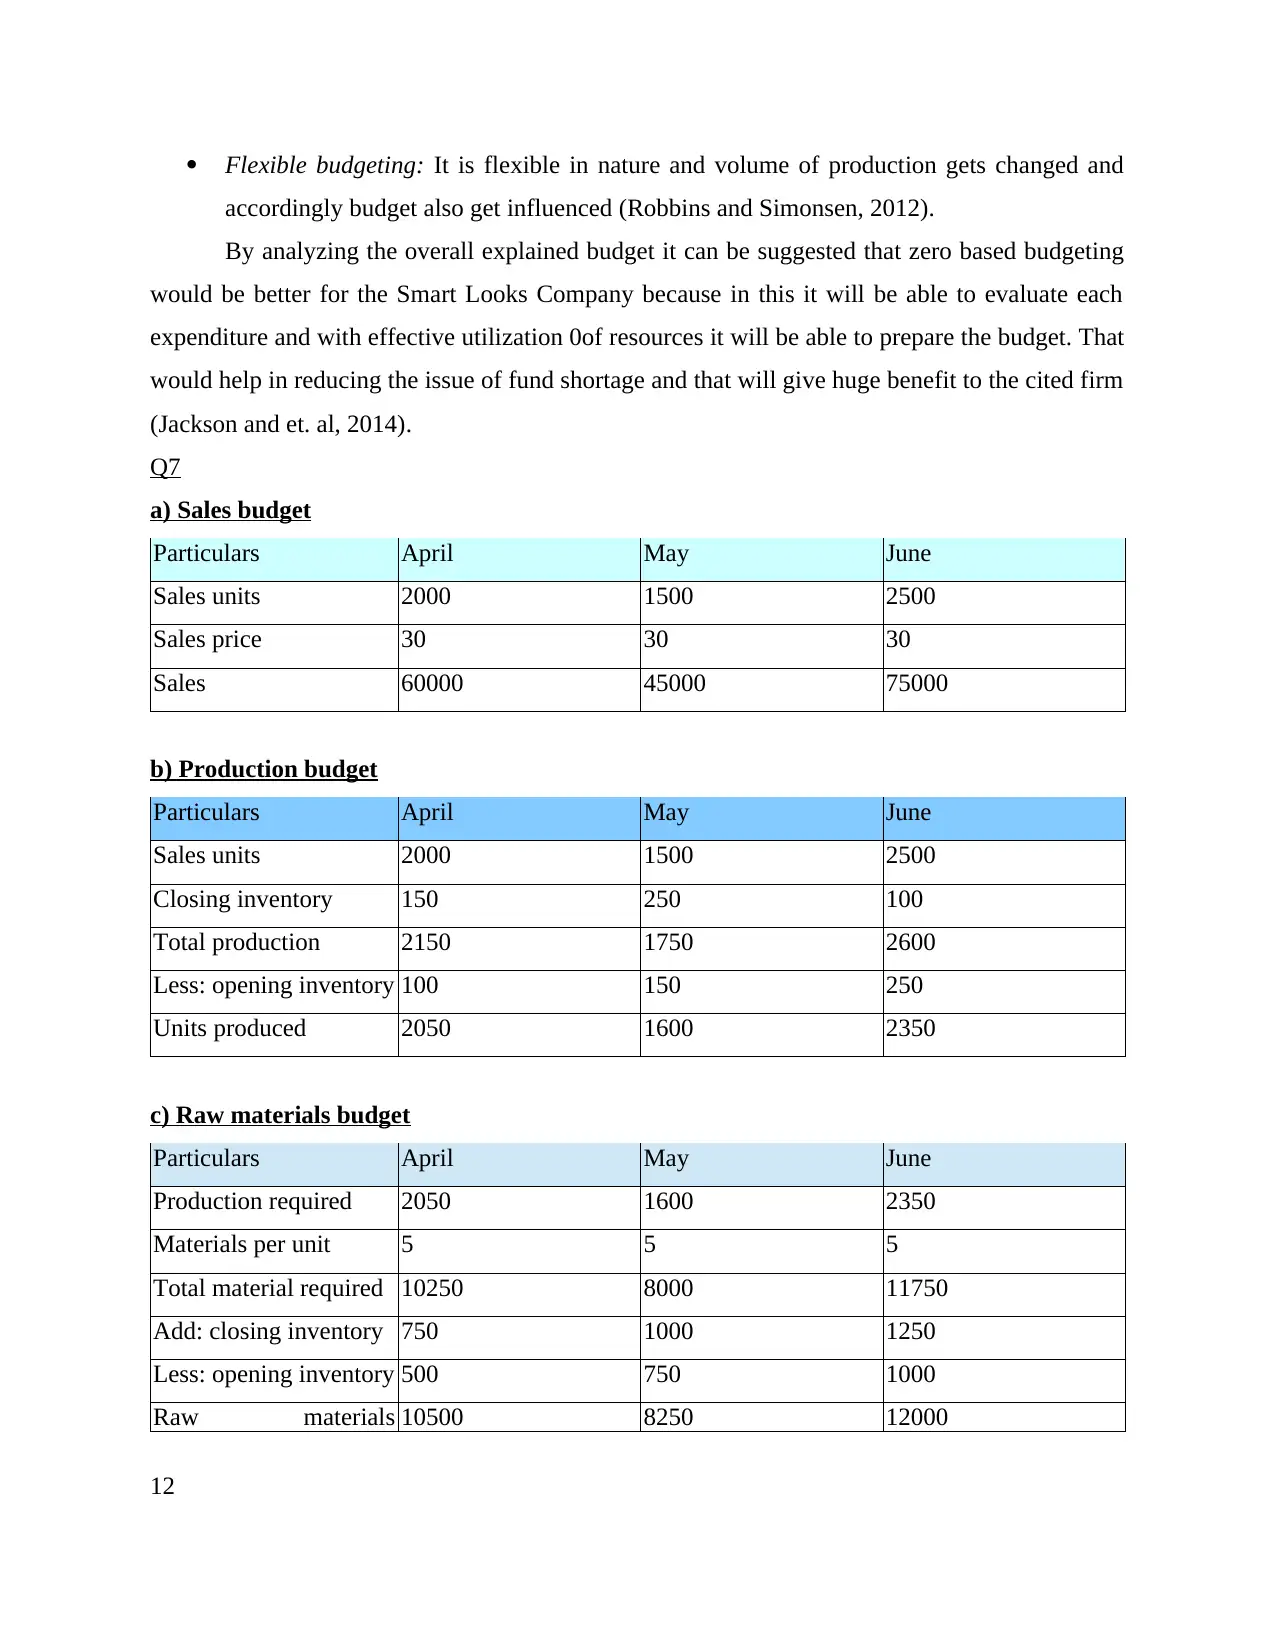
Flexible budgeting: It is flexible in nature and volume of production gets changed and
accordingly budget also get influenced (Robbins and Simonsen, 2012).
By analyzing the overall explained budget it can be suggested that zero based budgeting
would be better for the Smart Looks Company because in this it will be able to evaluate each
expenditure and with effective utilization 0of resources it will be able to prepare the budget. That
would help in reducing the issue of fund shortage and that will give huge benefit to the cited firm
(Jackson and et. al, 2014).
Q7
a) Sales budget
Particulars April May June
Sales units 2000 1500 2500
Sales price 30 30 30
Sales 60000 45000 75000
b) Production budget
Particulars April May June
Sales units 2000 1500 2500
Closing inventory 150 250 100
Total production 2150 1750 2600
Less: opening inventory 100 150 250
Units produced 2050 1600 2350
c) Raw materials budget
Particulars April May June
Production required 2050 1600 2350
Materials per unit 5 5 5
Total material required 10250 8000 11750
Add: closing inventory 750 1000 1250
Less: opening inventory 500 750 1000
Raw materials 10500 8250 12000
12
⊘ This is a preview!⊘
Do you want full access?
Subscribe today to unlock all pages.
Trusted by 1+ million students worldwide
1 out of 15
Related Documents


Your All-in-One AI-Powered Toolkit for Academic Success.
+13062052269
info@desklib.com
Available 24*7 on WhatsApp / Email
![[object Object]](/_next/static/media/star-bottom.7253800d.svg)
Unlock your academic potential
Copyright © 2020–2026 A2Z Services. All Rights Reserved. Developed and managed by ZUCOL.