Report: Analyzing Financial Performance of Stanmore Resources Limited

Verified

Added on  2023/06/08

|10
|2157
|233
Report
AI Summary
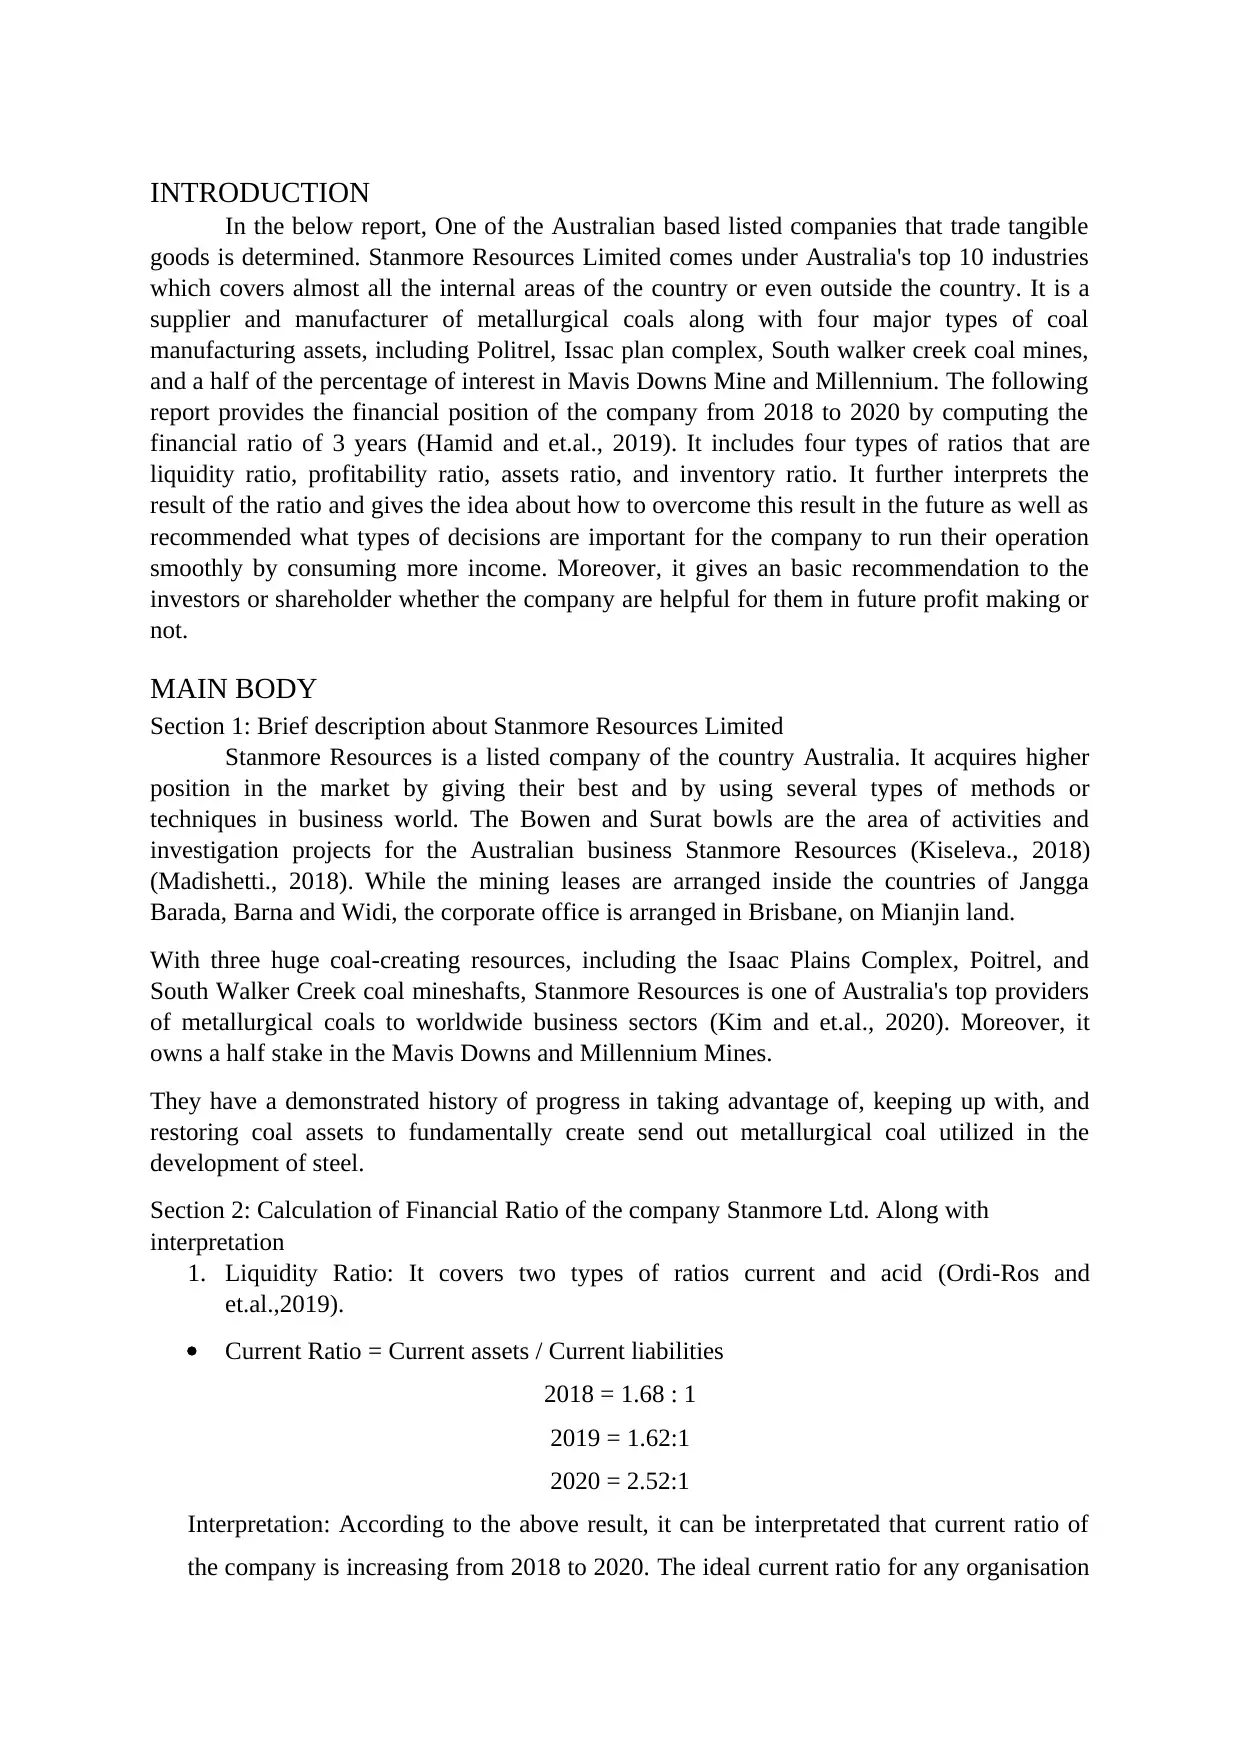
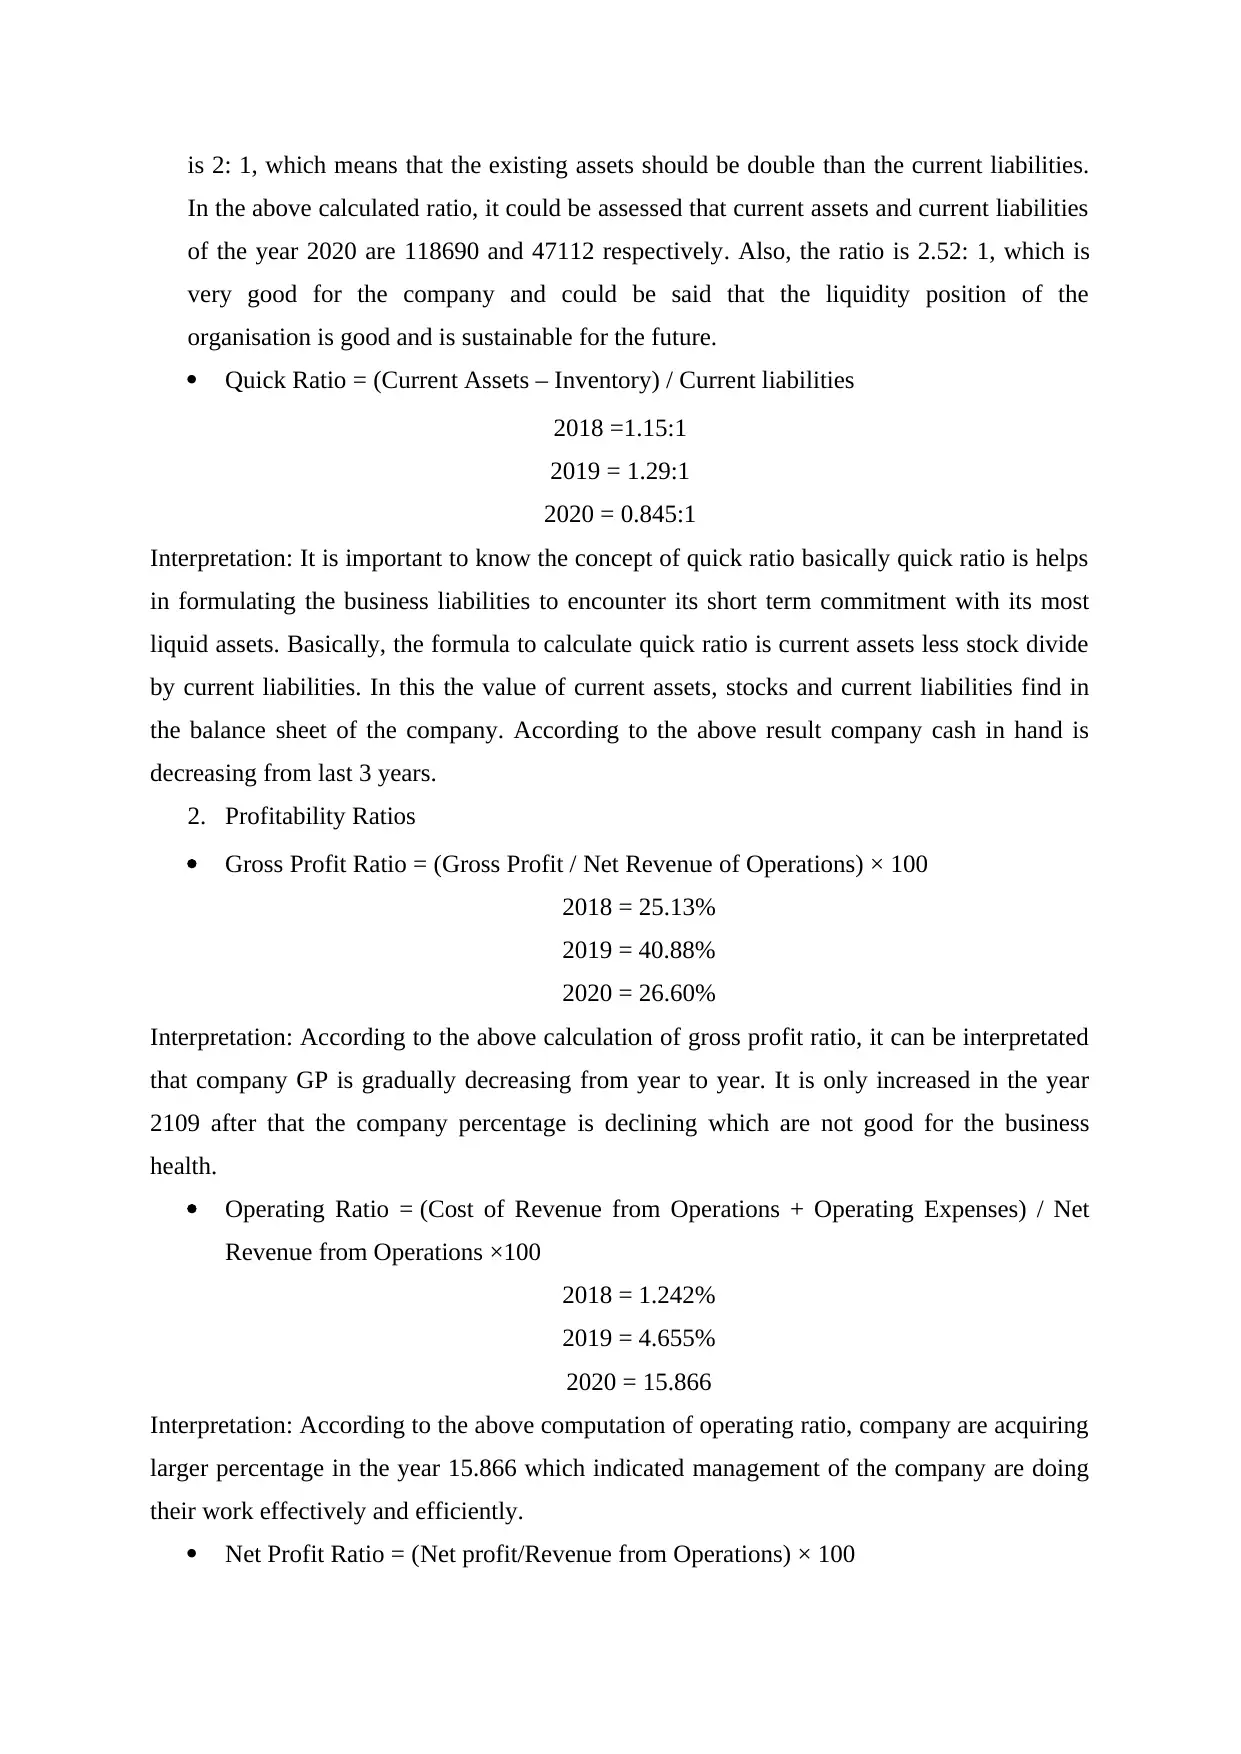
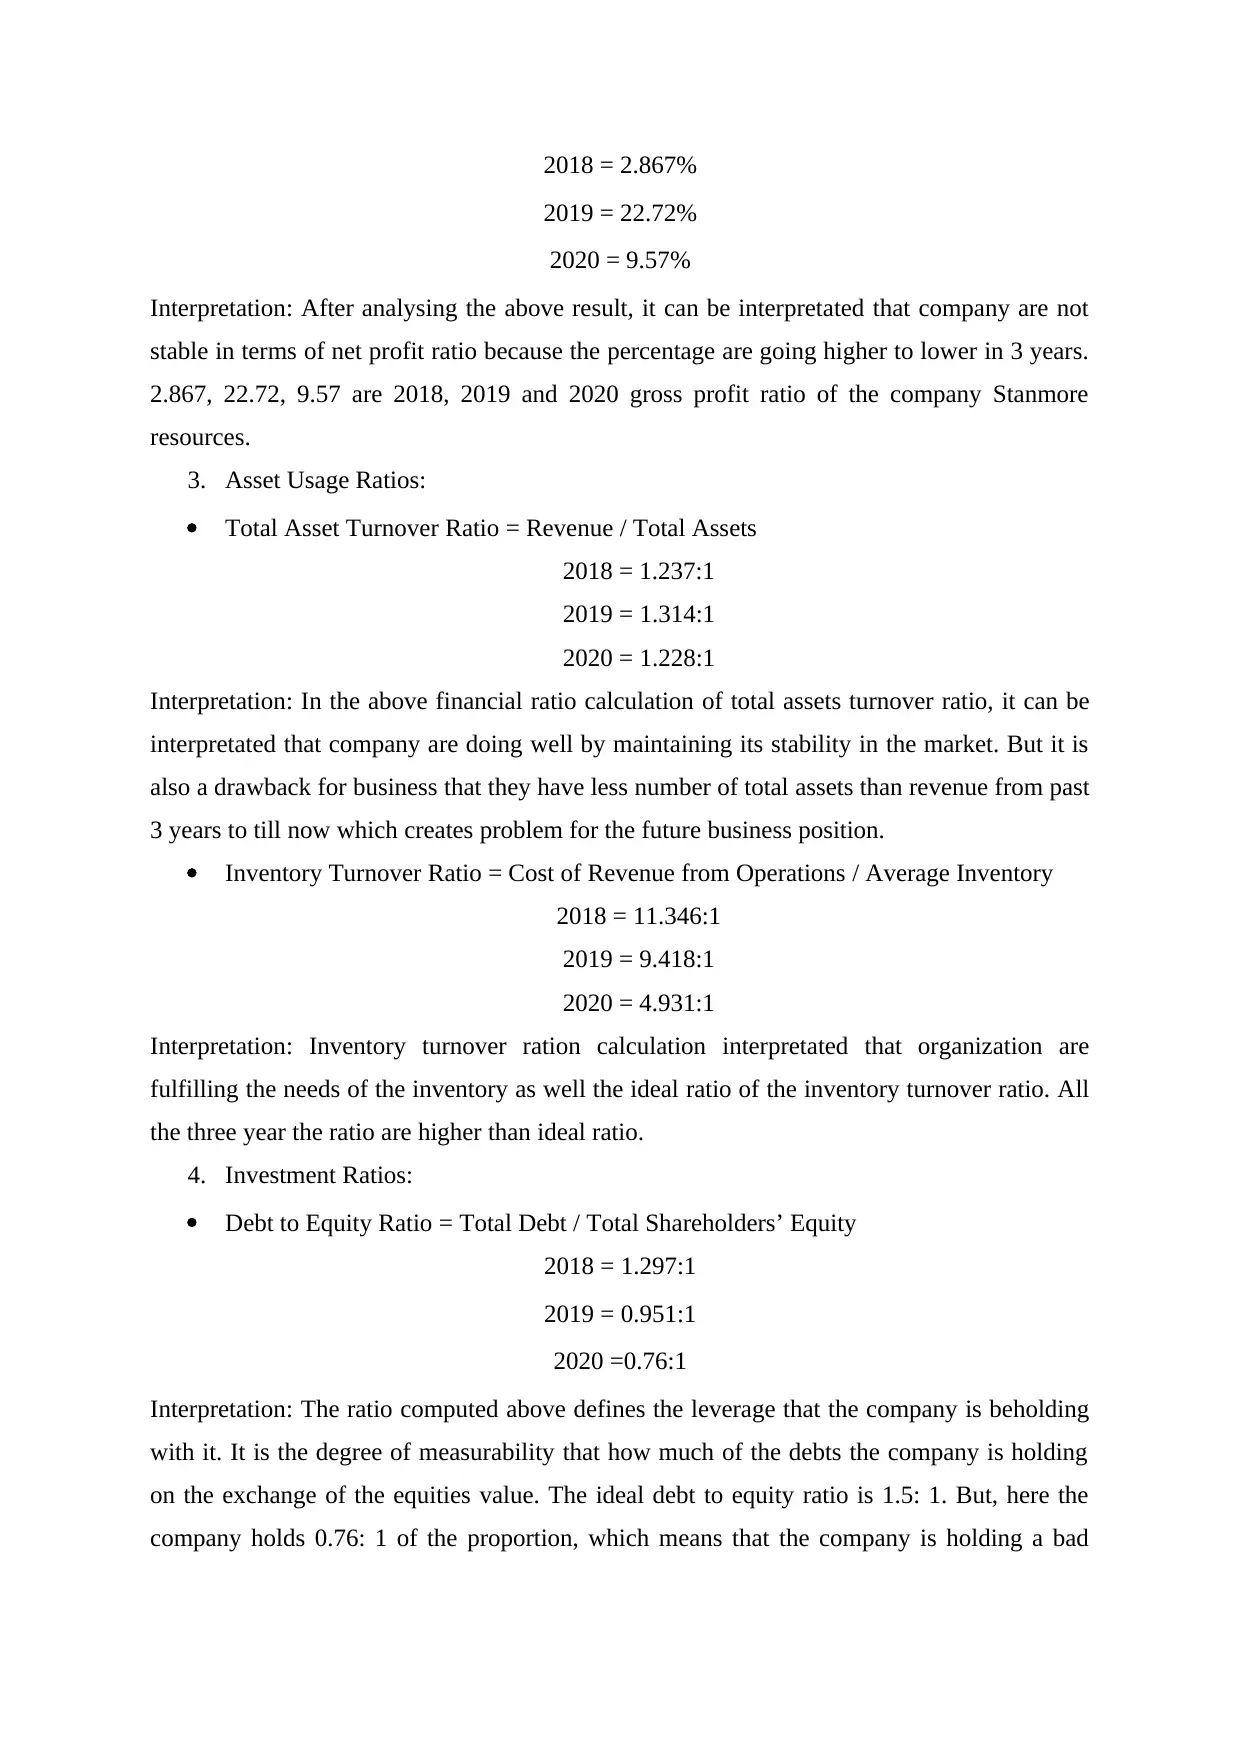
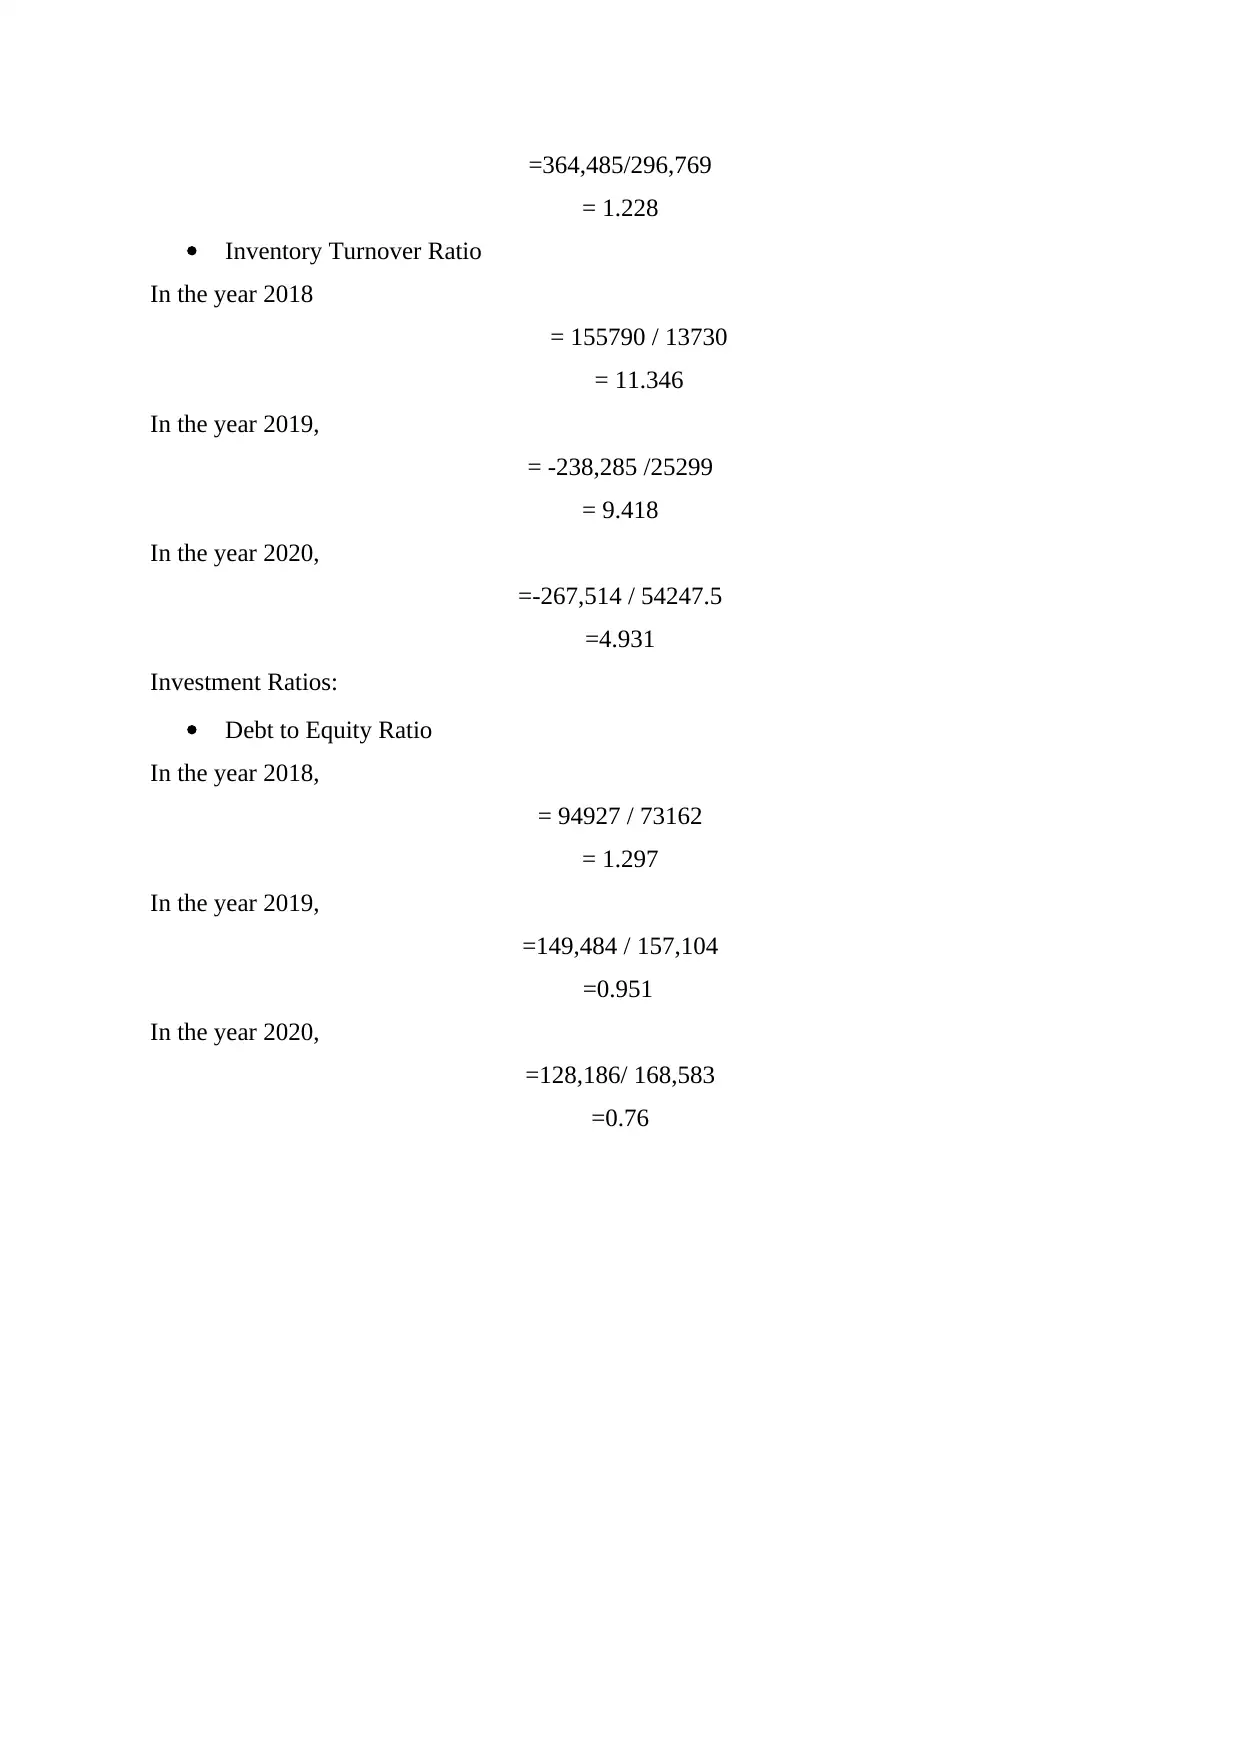
This report provides a comprehensive financial analysis of Stanmore Resources Limited, an Australian-based coal mining company, from 2018 to 2020. It examines the company's financial position by calculating and interpreting various financial ratios, including liquidity ratios (current and quick), profitability ratios (gross profit, operating, and net profit), asset usage ratios (total asset turnover and inventory turnover), and investment ratios (debt to equity). The analysis interprets the trends and implications of these ratios, offering insights into the company's performance and financial health. The report concludes with recommendations for the company and potential investors, assessing the company's strengths, weaknesses, and future prospects. The analysis is based on the company's published financial statements and aims to provide a clear understanding of Stanmore Resources' financial standing during the specified period.
Document Page
This assessment is an
individual report on
the performance of a
public limited
company selected by
you and is based on
the published
financial informa
tabler-icon-diamond-filled.svg

Paraphrase This Document

Need a fresh take? Get an instant paraphrase of this document with our AI Paraphraser
Document Page
Table of Contents
INTRODUCTION.................................................................................................................................3
MAIN BODY........................................................................................................................................3
Section 1: Brief description about Stanmore Resources Limited.......................................................3
Section 2: Calculation of Financial Ratio of the company Stanmore Ltd. Along with interpretation 3
Section 3: Conclusion and Recommendation.....................................................................................6
CONCLUSION.....................................................................................................................................6
REFERENCE........................................................................................................................................7
Appendix...............................................................................................................................................8
Document Page
INTRODUCTION
In the below report, One of the Australian based listed companies that trade tangible
goods is determined. Stanmore Resources Limited comes under Australia's top 10 industries
which covers almost all the internal areas of the country or even outside the country. It is a
supplier and manufacturer of metallurgical coals along with four major types of coal
manufacturing assets, including Politrel, Issac plan complex, South walker creek coal mines,
and a half of the percentage of interest in Mavis Downs Mine and Millennium. The following
report provides the financial position of the company from 2018 to 2020 by computing the
financial ratio of 3 years (Hamid and et.al., 2019). It includes four types of ratios that are
liquidity ratio, profitability ratio, assets ratio, and inventory ratio. It further interprets the
result of the ratio and gives the idea about how to overcome this result in the future as well as
recommended what types of decisions are important for the company to run their operation
smoothly by consuming more income. Moreover, it gives an basic recommendation to the
investors or shareholder whether the company are helpful for them in future profit making or
not.
MAIN BODY
Section 1: Brief description about Stanmore Resources Limited
Stanmore Resources is a listed company of the country Australia. It acquires higher
position in the market by giving their best and by using several types of methods or
techniques in business world. The Bowen and Surat bowls are the area of activities and
investigation projects for the Australian business Stanmore Resources (Kiseleva., 2018)
(Madishetti., 2018). While the mining leases are arranged inside the countries of Jangga
Barada, Barna and Widi, the corporate office is arranged in Brisbane, on Mianjin land.
With three huge coal-creating resources, including the Isaac Plains Complex, Poitrel, and
South Walker Creek coal mineshafts, Stanmore Resources is one of Australia's top providers
of metallurgical coals to worldwide business sectors (Kim and et.al., 2020). Moreover, it
owns a half stake in the Mavis Downs and Millennium Mines.
They have a demonstrated history of progress in taking advantage of, keeping up with, and
restoring coal assets to fundamentally create send out metallurgical coal utilized in the
development of steel.
Section 2: Calculation of Financial Ratio of the company Stanmore Ltd. Along with
interpretation
1. Liquidity Ratio: It covers two types of ratios current and acid (Ordi-Ros and
et.al.,2019).
Current Ratio = Current assets / Current liabilities
2018 = 1.68 : 1
2019 = 1.62:1
2020 = 2.52:1
Interpretation: According to the above result, it can be interpretated that current ratio of
the company is increasing from 2018 to 2020. The ideal current ratio for any organisation
Document Page
is 2: 1, which means that the existing assets should be double than the current liabilities.
In the above calculated ratio, it could be assessed that current assets and current liabilities
of the year 2020 are 118690 and 47112 respectively. Also, the ratio is 2.52: 1, which is
very good for the company and could be said that the liquidity position of the
organisation is good and is sustainable for the future.
Quick Ratio = (Current Assets – Inventory) / Current liabilities
2018 =1.15:1
2019 = 1.29:1
2020 = 0.845:1
Interpretation: It is important to know the concept of quick ratio basically quick ratio is helps
in formulating the business liabilities to encounter its short term commitment with its most
liquid assets. Basically, the formula to calculate quick ratio is current assets less stock divide
by current liabilities. In this the value of current assets, stocks and current liabilities find in
the balance sheet of the company. According to the above result company cash in hand is
decreasing from last 3 years.
2. Profitability Ratios
Gross Profit Ratio = (Gross Profit / Net Revenue of Operations) × 100
2018 = 25.13%
2019 = 40.88%
2020 = 26.60%
Interpretation: According to the above calculation of gross profit ratio, it can be interpretated
that company GP is gradually decreasing from year to year. It is only increased in the year
2109 after that the company percentage is declining which are not good for the business
health.
Operating Ratio = (Cost of Revenue from Operations + Operating Expenses) / Net
Revenue from Operations ×100
2018 = 1.242%
2019 = 4.655%
2020 = 15.866
Interpretation: According to the above computation of operating ratio, company are acquiring
larger percentage in the year 15.866 which indicated management of the company are doing
their work effectively and efficiently.
Net Profit Ratio = (Net profit/Revenue from Operations) × 100
tabler-icon-diamond-filled.svg

Paraphrase This Document

Need a fresh take? Get an instant paraphrase of this document with our AI Paraphraser
Document Page
2018 = 2.867%
2019 = 22.72%
2020 = 9.57%
Interpretation: After analysing the above result, it can be interpretated that company are not
stable in terms of net profit ratio because the percentage are going higher to lower in 3 years.
2.867, 22.72, 9.57 are 2018, 2019 and 2020 gross profit ratio of the company Stanmore
resources.
3. Asset Usage Ratios:
Total Asset Turnover Ratio = Revenue / Total Assets
2018 = 1.237:1
2019 = 1.314:1
2020 = 1.228:1
Interpretation: In the above financial ratio calculation of total assets turnover ratio, it can be
interpretated that company are doing well by maintaining its stability in the market. But it is
also a drawback for business that they have less number of total assets than revenue from past
3 years to till now which creates problem for the future business position.
Inventory Turnover Ratio = Cost of Revenue from Operations / Average Inventory
2018 = 11.346:1
2019 = 9.418:1
2020 = 4.931:1
Interpretation: Inventory turnover ration calculation interpretated that organization are
fulfilling the needs of the inventory as well the ideal ratio of the inventory turnover ratio. All
the three year the ratio are higher than ideal ratio.
4. Investment Ratios:
Debt to Equity Ratio = Total Debt / Total Shareholders’ Equity
2018 = 1.297:1
2019 = 0.951:1
2020 =0.76:1
Interpretation: The ratio computed above defines the leverage that the company is beholding
with it. It is the degree of measurability that how much of the debts the company is holding
on the exchange of the equities value. The ideal debt to equity ratio is 1.5: 1. But, here the
company holds 0.76: 1 of the proportion, which means that the company is holding a bad
Document Page
position in the market and is not able to pay debt. It decreases the efficiency of the business
entity and creates issues in maintaining the financial obligation of the corporation.
Section 3: Conclusion and Recommendation
From the analysis of the financial statement, it can be suggested to the company that
the organisation is doing good in the market. Only it can improve its equity position as the
profitability will decrease if the business entity will incur more debt. As it has to pay more
interest then. In shareholder point of view company are more profitmaking that helps them to
gain more income in the future.
CONCLUSION
From the above calculation, it can be concluded that Stanmore resources financial
position from past 3 years in the market. This company is one of the best and rank holder
companies in Australia and deals with coals and mines. The above report explained the
company type and working nature as well as capabilities and resources. Further, it computed
the financial ratio of the company with the help of the company financial statement. Ratio
analysis of the Stanmore states that company is doing their work effectively and efficiently in
some practices by maintaining their liquidity assets and net profit.
Document Page
REFERENCE
Books and Journal
Hamid, A.A. and et.al., 2019. Compound genomic alterations of TP53, PTEN, and RB1
tumor suppressors in localized and metastatic prostate cancer. European urology, 76(1),
pp.89-97.
Kim, M. and et.al., 2020. A rational interpretation of solidification microstructures in the Mg-
rich corner of the Mg–Al–La system. Journal of Alloys and Compounds, 844, p.156068.
Kiseleva, I.I., 2018. Identification of the concept of" financialization" and its interpretation at
the micro and macro levels of economic development. In Дни науки (pp. 932-935).
Madishetti, S., 2018. Ownership structure and financial performance of commercial banks: a
comparative study of Twomajor banks in Tanzania. SAARJ Journal on Banking & Insurance
Research, 7(1), pp.41-58.
Ordi-Ros, J. and et.al., 2019. Rivaroxaban versus vitamin K antagonist in antiphospholipid
syndrome: a randomized noninferiority trial. Annals of internal medicine, 171(10), pp.685-
694.
Papatheodoridis, G.V. and et.al., 2020. Hepatocellular carcinoma prediction beyond year 5
of oral therapy in a large cohort of Caucasian patients with chronic hepatitis B. Journal of
hepatology, 72(6), pp.1088-1096.
Sathianathen, N.J. and et.al., 2020. Indirect comparisons of efficacy between combination
approaches in metastatic hormone-sensitive prostate cancer: a systematic review and network
meta-analysis. European urology, 77(3), pp.365-372.
Singh, P.P., Sabnani, C.S. and Kapse, V.S., 2021. Interpreting benchmark assessment of
emergency fire service using geoinformation technology. International Journal of Disaster
Risk Reduction, 63, p.102432.
Torras, O.R. and et.al., 2022. Molecular genetic determinants of shorter time on active
surveillance in a prospective phase 2 clinical trial in metastatic renal cell
carcinoma. European urology, 81(6), pp.555-558.
Zhang, H., Sun, C. and Xie, X., 2021. Interpreting the role of carbon in phase transformation
from β-FeOOH to α-Fe2O3. Materials Letters, 296, p.129860.
tabler-icon-diamond-filled.svg

Paraphrase This Document

Need a fresh take? Get an instant paraphrase of this document with our AI Paraphraser
Document Page
Appendix
Liquidity Ratio
Current Ratio
In the year 2018,
= 65794 / 38944
= 1.68 : 1
In the year 2019,
=145104/89587
=1.62:1
In the year 2020,
=118690/47112
= 2.52:1
Quick Ratio
In the year 2018,
= (65,794-20,967) / 38,944
= 1.15:1
In the year 2019,
= (145104-29631)/89587
= 1.29
In the year 2020,
=(118690-78864)/47112
= 0.845
Profitability Ratios
Gross Profit Ratio
In the year 2018,
= (52,291/208,081)*100
= 25.13
In the year 2019,
= (164774/403059)*100
= 40.88
In the year 2020,
Document Page
= (96971/364485)*100
= 26.60
Operating Ratio
In the year 2018
= (-6493 + 9079)/208081 * 100
=1.242%
In the year 2019,
= (8664+10100)/403059*100
= 4.655%
In the year 2020,
= (49233+8597)/364485*100
15.866%
Net Profit Ratio
In the year 2018
= (5966/ 208081) *100
= 2.867%
In the year 2019,
(91598/403059)*100
22.72%
In the year 2020,
(34893/364485)*100
=9.57%
Asset Usage Ratios:
Total Assets turnover ratio:
In the year 2018:
= 208081/ 168089
=1.237
In the year 2019,
= 403,059 /306,588
= 1.314
In the year 2020,
Document Page
=364,485/296,769
= 1.228
Inventory Turnover Ratio
In the year 2018
= 155790 / 13730
= 11.346
In the year 2019,
= -238,285 /25299
= 9.418
In the year 2020,
=-267,514 / 54247.5
=4.931
Investment Ratios:
Debt to Equity Ratio
In the year 2018,
= 94927 / 73162
= 1.297
In the year 2019,
=149,484 / 157,104
=0.951
In the year 2020,
=128,186/ 168,583
=0.76
chevron_up_icon
1 out of 10
circle_padding
hide_on_mobile
zoom_out_icon
[object Object]