Comprehensive Financial Management and Analysis of Starbucks Coffee
VerifiedAdded on 2020/10/20
|21
|4466
|116
Report
AI Summary
This report presents a comprehensive financial analysis of Starbucks Coffee Company, examining its performance through various financial ratios. It begins with an introduction to financial management and the company background of Starbucks. The analysis covers liquidity ratios (current and quick ratios), long-term solvency ratios (debt-to-equity ratio), profitability ratios (gross profit ratio, return on equity), asset management ratios (inventory turnover, asset turnover), and market value ratios (earnings per share, dividend per share). The report calculates and interprets these ratios over a five-year period, providing insights into Starbucks' financial health, operational efficiency, and ability to manage its debts and generate profits. The analysis also includes graphical representations for easy understanding and discusses the limitations of ratio analysis. The report concludes with a summary of the findings and references used.
An Assignment on
Financial Management and Analysis
Financial Management and Analysis
Paraphrase This Document
Need a fresh take? Get an instant paraphrase of this document with our AI Paraphraser

Table of Contents
Introduction................................................................................................................................... 2
Company background of Starbuck Coffee.....................................................................................3
Financial performance and ratio analysis.....................................................................................................3
2 Analysis of Liquidity Ratio......................................................................................................................4
2.1 Current ratio......................................................................................................................................4
2.2 Quick ratio or acid test.......................................................................................................................5
3. Analysis of long term solvency ratio.......................................................................................................7
3.1 debt to equity ratio.............................................................................................................................7
4. Analysis of profitability ratio...................................................................................................................9
4.1 Gross profit ratio..............................................................................................................................10
4.2 Return on Equity (ROE) ratio..........................................................................................................11
5. Analysis of asset management ratio.......................................................................................................13
5.1 Inventory turnover ratio...................................................................................................................13
5.2 Asset turnover ratio.........................................................................................................................14
6. Analysis of market value ratios.............................................................................................................16
6.1 Earnings per share...........................................................................................................................16
6.2 Dividend Per Share..........................................................................................................................17
7. Limitations of ratio analysis..................................................................................................................18
Conclusion.................................................................................................................................................19
References.................................................................................................................................................20
Page 2 of 21
Introduction
Finance is called the lifeline of business and requires efficient management to be used properly.
The concerned activities on planning, controlling, monitoring and administering the available
funds in business are called financial management. Joy Thomas , & Rabiyathulbasariya, (2017)
stated that financial management in any organization intended to achieve the reduction in finance
cost, sufficient funds availability to operate business, and efficient funds utilization and proper
procurement.
The main objective of financial management analysis and reporting is to provide useful financial
and non-financial information to existing and potential users about the financial health,
performance, continuous changing environment and performance of corporate firms to make
investing, financing and other economic decisions (Iatridis, 2010). To assess risk level against
expected returns analyzing financial statement and management process yields all valuable
information about the firm’s earning quality, co-relationships and trends, as well as the
weaknesses and strength in financial position as well as operational process to interest parties
(Peterson Drake, and Fabozzi, 2012). Management hierarchy of corporate firms are highly
concern about documentation, preparation and presentation of financial statements, relevant
notes and disclosers in reliable and understanding manner to information users such as investors,
creditors, legal authorities, government and corporate media. Also, Iatridis, (2010) demonstrated
that fulfilling the requirement of financial management and corporate reporting, business firms
fulfill the target of utilization of economic and other resources, satisfactory fulfillment of
regulations and laws, updating the cash flow and financial position, exploring future business
opportunities and most importantly satisfy user’s information needs.
Going to present in this paper, through extensive and deeper calculation and analysis of financial
and non-financial information of Starbucks Coffee Company the business strategy and policy
making, operational efficiency and performance growth or changes over couple of years.
Starbuck Coffee is a publically listed coffee shop in coffee industry, serving all over the world
with products in the category of coffee, smoothies, tea, backed products, beverages and
sandwiches and enjoy a major portion of quality minded coffee drinker’s expenditure in its own
Page 3 of 21
⊘ This is a preview!⊘
Do you want full access?
Subscribe today to unlock all pages.
Trusted by 1+ million students worldwide
pocket. The firm is following IFRS and IAS to measure, prepare and present its financial
statements and reports to interested information seekers.
Company background of Starbuck Coffee
Financial management analysis reflects information and disclosures about how Starbuck Coffee
is utilizing financial and non-financial resources to increase profitability and enhance firm value
in long-run.
Starbuck is an America based china coffee house founded in 1971, at Seattle, Washington DC.
Starbuck coffee is called the representative of second wave coffee and after 2000s it targeted the
quality seeking coffee drinker with artisanal coffee especially with dark roasted coffee. As
Starbuck is a public company, it’s traded at New York stock exchange and spreading business all
over the world with around 29,500 outlets or franchisee locations and creating employment
opportunities for 295,000 employees (Starbucks.com. 2019).
Away from home and work place, Starbuck coffee successfully positioned itself as a third place,
with long-term focus extending business in emerging economic countries. Interestingly, the
revenue portion of Starbuck is increased from 7% to 12% in 2018 from Asian market segment
and opened 2839 stores more in the last two years (Starbucks.com. 2019). Starbuck is upgrading
with innovative technology not only in business communication, easy ordering and payment
system but also updates its production and procedures for safety and efficiency reasons such as
automated espresso coffee making machines. Myron. E. Ullman is currently serving as the
chairman and it attained in 2018 $24.71 billion as total revenue, from which $4.15 billion was
net profit (Starbucks.com. 2019). Starbuck has other subsidiaries such as ethos water, Hear
Music, Evolution Fresh, Torrefazione Italia and others.
Financial performance and ratio analysis
Ratio analysis means to reckon or calculate, the term had come from Latin word (Joy Thomas, &
Rabiyathulbasariya, 2017). So, financial performance and ratio analysis is significantly
advantageous as it generates useful information on historical performance of the specific firm
about liquidity, solvency, market performance, capitalization and efficiency on operations
through identification, measuring, analyzing and evaluating prepared financial statements of the
company (Green, 2013).
Page 4 of 21
Paraphrase This Document
Need a fresh take? Get an instant paraphrase of this document with our AI Paraphraser
2 Analysis of Liquidity Ratio.
Liquidity ratio analysis reflects the company’s financial ability to pay off long-term debts and
current debts from the balance of current assets in a specific financial time period (Peterson
Drake, and Fabozzi, 2012). These ratios are highly dependent on firm’s performance to generate
cash or cash equivalent items in the cash emergency or crisis time not bother about cash balance
on that time period.
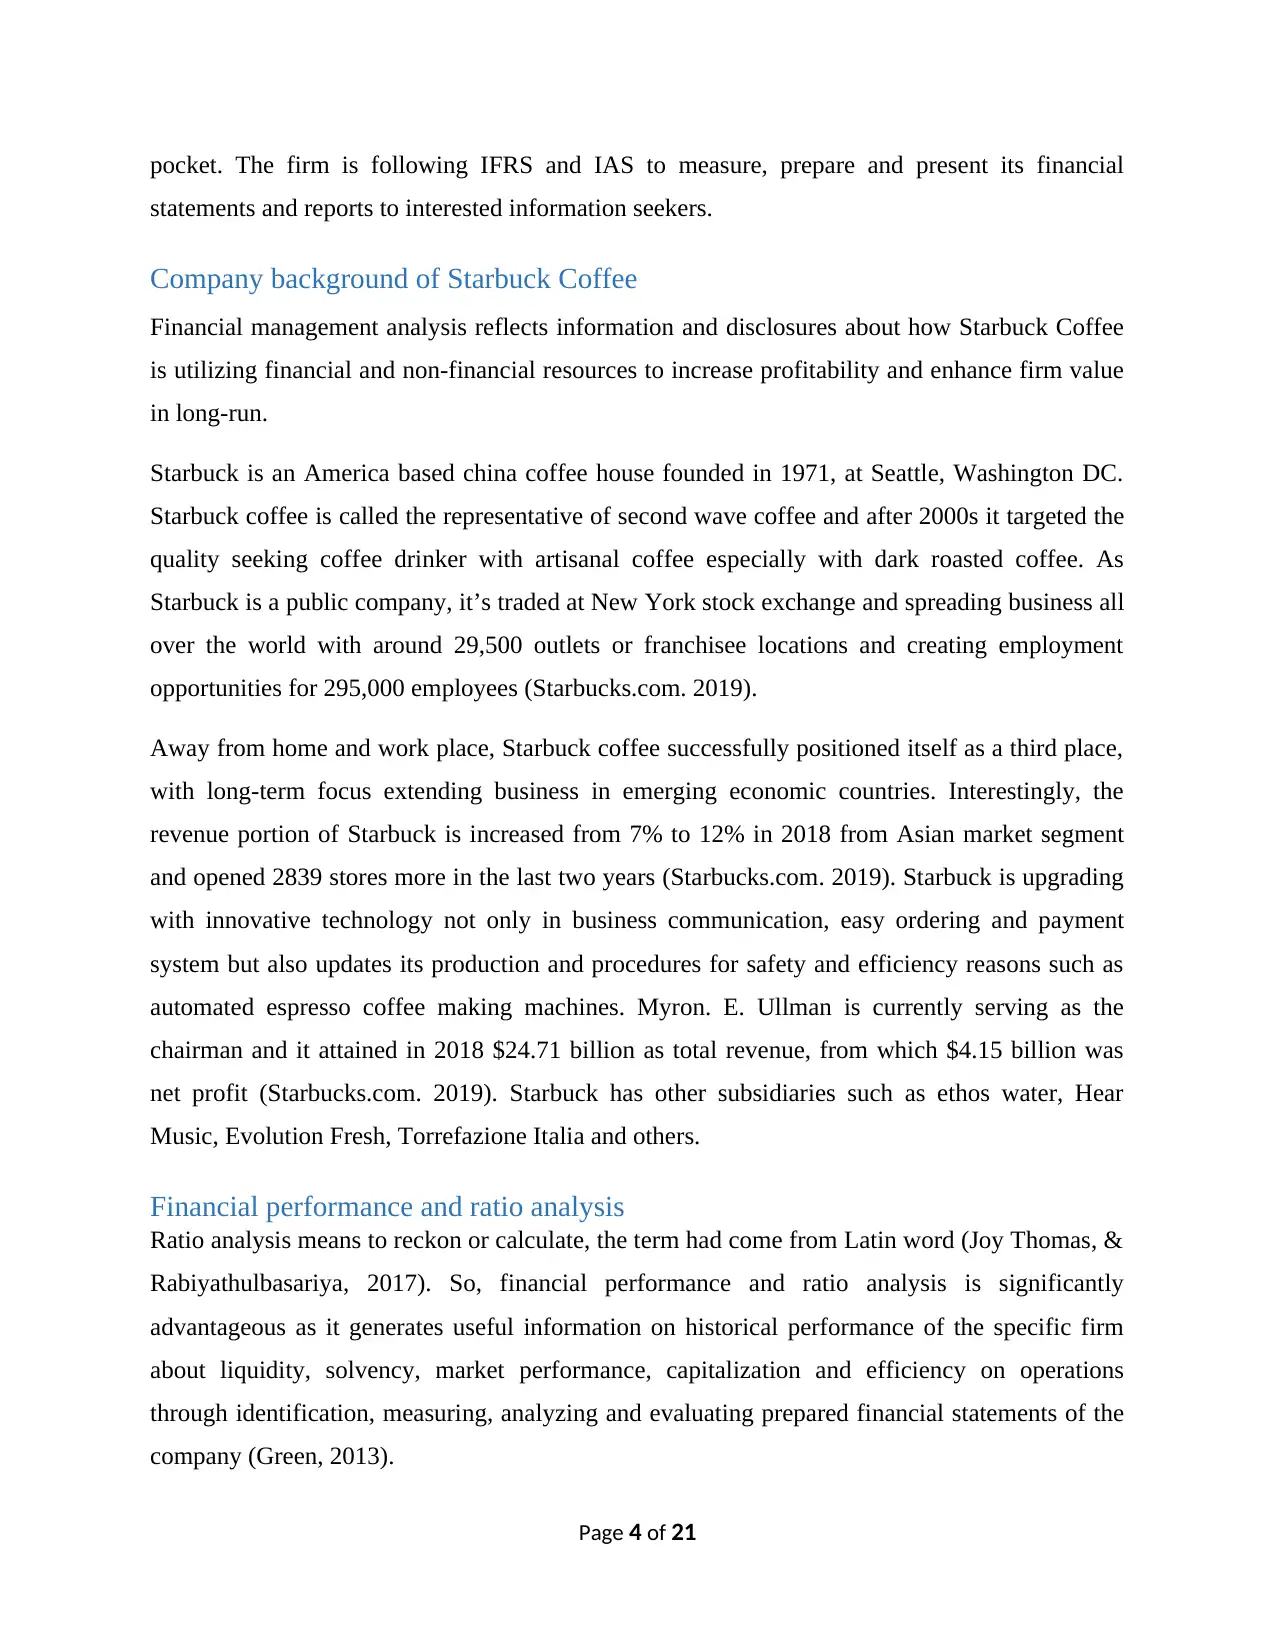
2.1 Current ratio
Current ratio is called the efficiency ratio as it measures the company’s ability to pay its short-
term liabilities off with the balance of current assets (MANISHA B, 2012). It’s important to
measure as short-term liabilities are due in the running accounting year.
Current assets such as cash, cash equivalents, market securities are easy to convert into cash in
short time and pay off all current liabilities as they become due and without selling off revenue
generating long term assets (Needles, and Powers, 2010). So, current ratio helps creditors and
inventors of Starbucks to understand the liquidity position and efficient of paying current
liabilities. The formula to calculate current ratio is as follows:
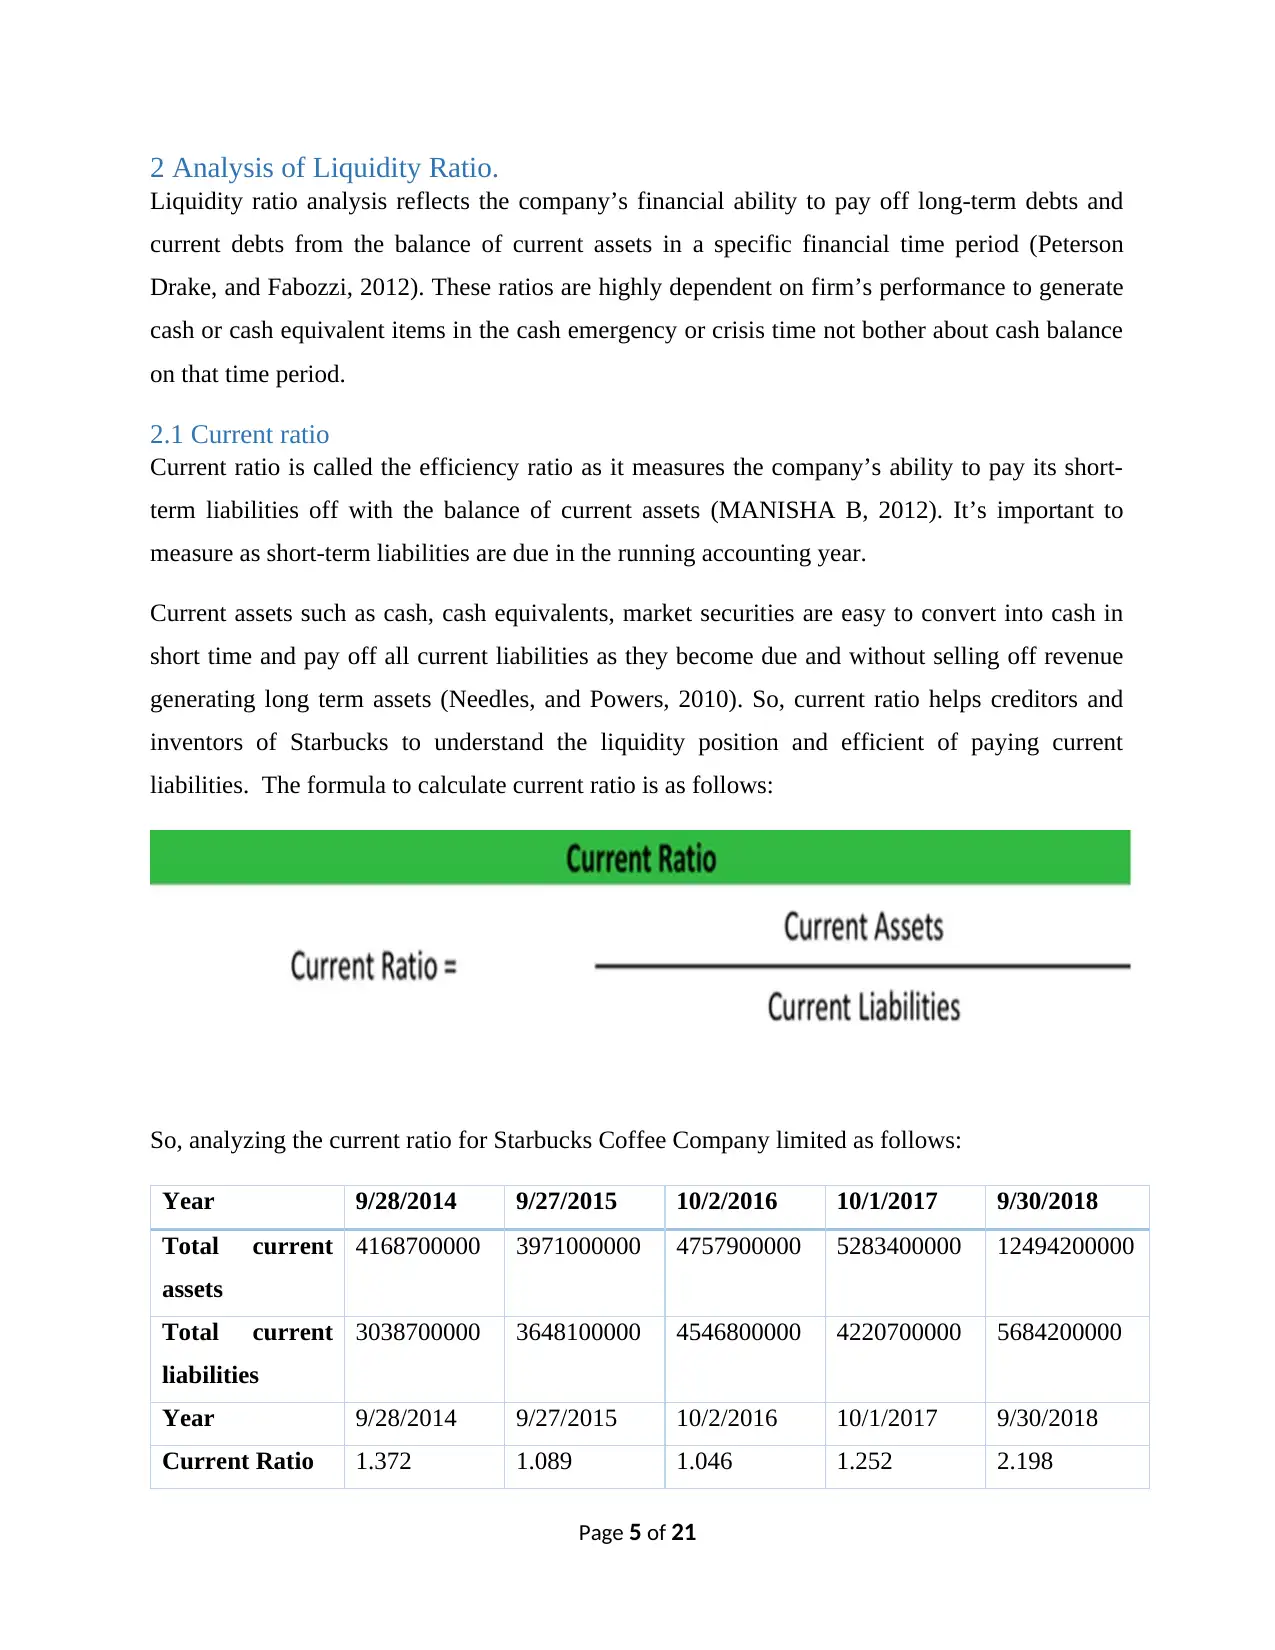
So, analyzing the current ratio for Starbucks Coffee Company limited as follows:
Year 9/28/2014 9/27/2015 10/2/2016 10/1/2017 9/30/2018
Total current
assets
4168700000 3971000000 4757900000 5283400000 12494200000
Total current
liabilities
3038700000 3648100000 4546800000 4220700000 5684200000
Year 9/28/2014 9/27/2015 10/2/2016 10/1/2017 9/30/2018
Current Ratio 1.372 1.089 1.046 1.252 2.198
Page 5 of 21
Liquidity ratio analysis reflects the company’s financial ability to pay off long-term debts and
current debts from the balance of current assets in a specific financial time period (Peterson
Drake, and Fabozzi, 2012). These ratios are highly dependent on firm’s performance to generate
cash or cash equivalent items in the cash emergency or crisis time not bother about cash balance
on that time period.
2.1 Current ratio
Current ratio is called the efficiency ratio as it measures the company’s ability to pay its short-
term liabilities off with the balance of current assets (MANISHA B, 2012). It’s important to
measure as short-term liabilities are due in the running accounting year.
Current assets such as cash, cash equivalents, market securities are easy to convert into cash in
short time and pay off all current liabilities as they become due and without selling off revenue
generating long term assets (Needles, and Powers, 2010). So, current ratio helps creditors and
inventors of Starbucks to understand the liquidity position and efficient of paying current
liabilities. The formula to calculate current ratio is as follows:
So, analyzing the current ratio for Starbucks Coffee Company limited as follows:
Year 9/28/2014 9/27/2015 10/2/2016 10/1/2017 9/30/2018
Total current
assets
4168700000 3971000000 4757900000 5283400000 12494200000
Total current
liabilities
3038700000 3648100000 4546800000 4220700000 5684200000
Year 9/28/2014 9/27/2015 10/2/2016 10/1/2017 9/30/2018
Current Ratio 1.372 1.089 1.046 1.252 2.198
Page 5 of 21
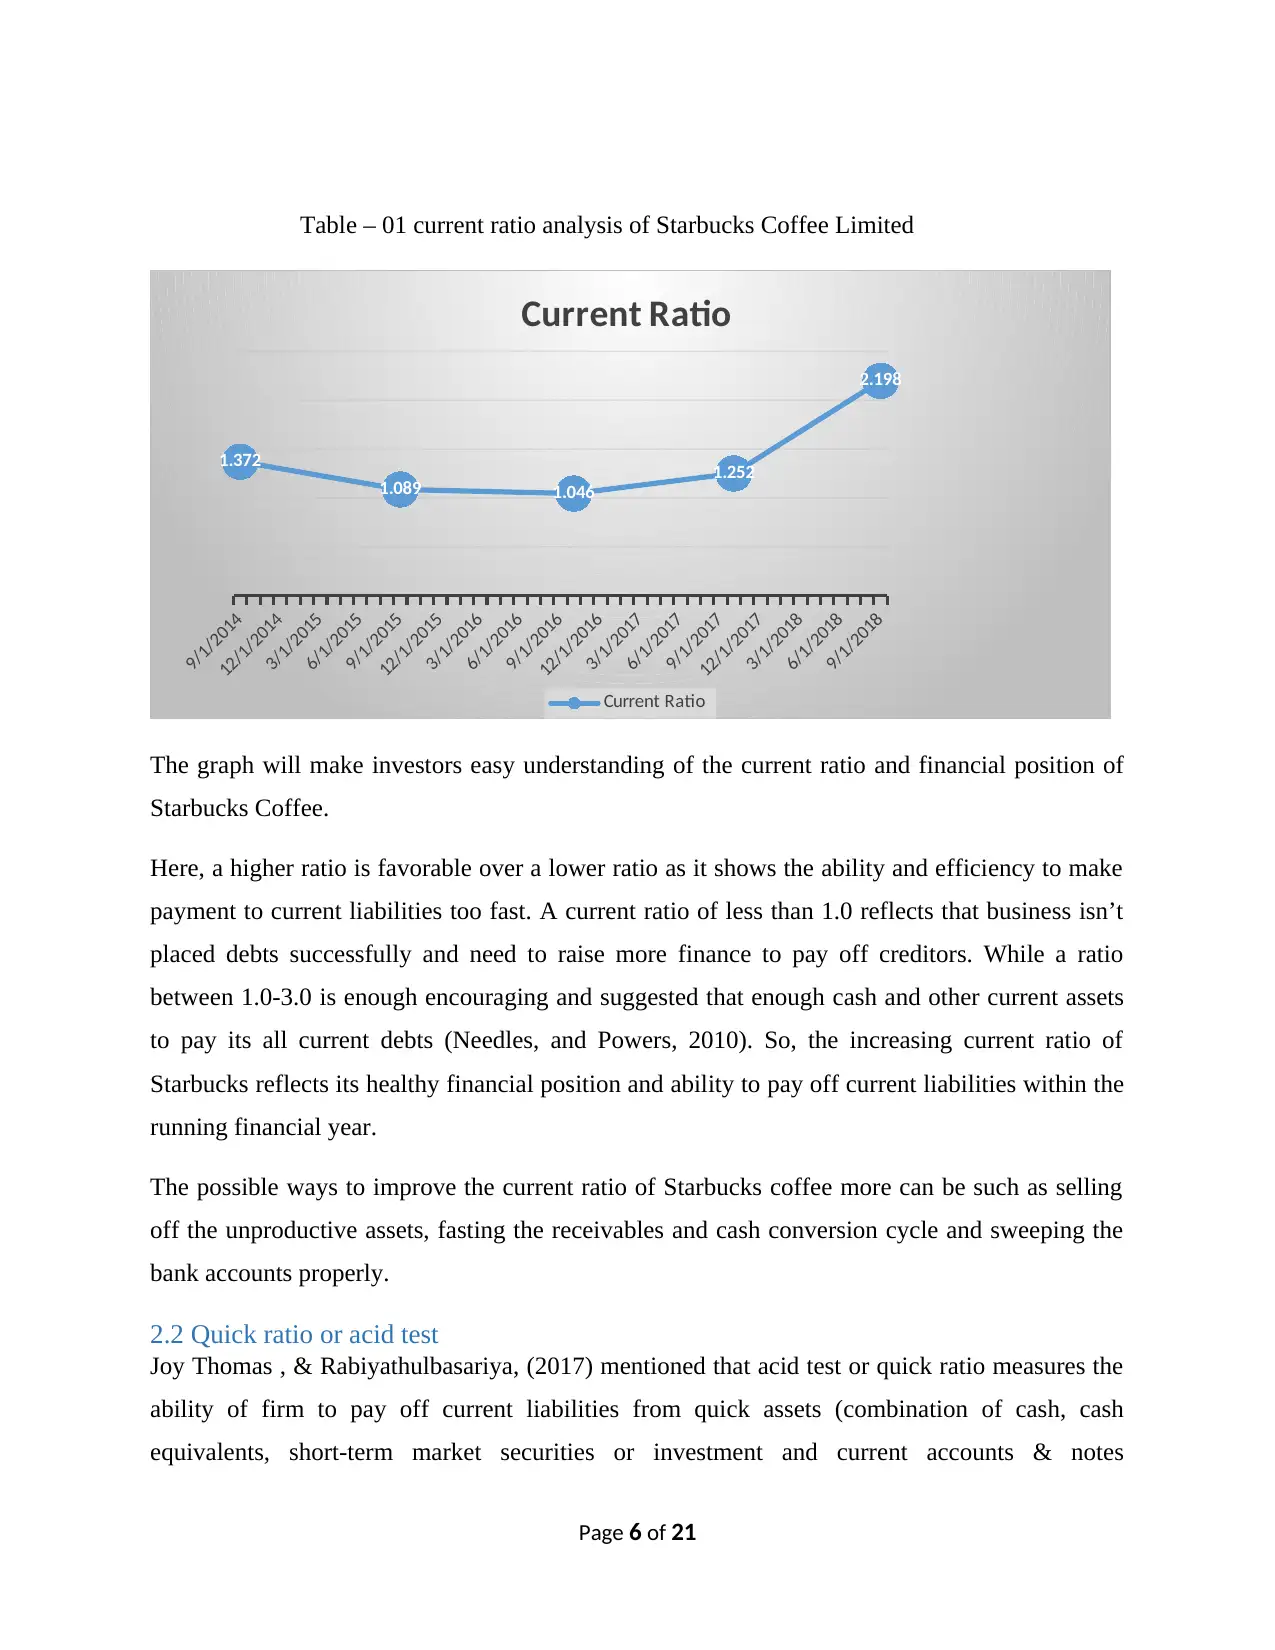
Table – 01 current ratio analysis of Starbucks Coffee Limited
9/1/2014
12/1/2014
3/1/2015
6/1/2015
9/1/2015
12/1/2015
3/1/2016
6/1/2016
9/1/2016
12/1/2016
3/1/2017
6/1/2017
9/1/2017
12/1/2017
3/1/2018
6/1/2018
9/1/2018
1.372
1.089 1.046
1.252
2.198
Current Ratio
Current Ratio
The graph will make investors easy understanding of the current ratio and financial position of
Starbucks Coffee.
Here, a higher ratio is favorable over a lower ratio as it shows the ability and efficiency to make
payment to current liabilities too fast. A current ratio of less than 1.0 reflects that business isn’t
placed debts successfully and need to raise more finance to pay off creditors. While a ratio
between 1.0-3.0 is enough encouraging and suggested that enough cash and other current assets
to pay its all current debts (Needles, and Powers, 2010). So, the increasing current ratio of
Starbucks reflects its healthy financial position and ability to pay off current liabilities within the
running financial year.
The possible ways to improve the current ratio of Starbucks coffee more can be such as selling
off the unproductive assets, fasting the receivables and cash conversion cycle and sweeping the
bank accounts properly.
2.2 Quick ratio or acid test
Joy Thomas , & Rabiyathulbasariya, (2017) mentioned that acid test or quick ratio measures the
ability of firm to pay off current liabilities from quick assets (combination of cash, cash
equivalents, short-term market securities or investment and current accounts & notes
Page 6 of 21
⊘ This is a preview!⊘
Do you want full access?
Subscribe today to unlock all pages.
Trusted by 1+ million students worldwide
receivables). The analysis is called quick ratio as the assets can be converted into cash so faster.
At the time of calculating quick ratio or acid test it’s necessary to make comparison with
competitors and measure average industry performance for building strengths and overcoming
the weaknesses with better future perspective in coffee industry (Darmawan, 2017).
The formula to calculate quick ratio or acid test is as follows:
Quick ratio = (Cash+ Cash Equivalent + Short-term marketable securities or investment +
Current Receivables) ÷ Current liabilities
Here, analyzing the quick ratio or acid test for Starbucks Coffee Company limited as follows:
Year 9/28/2014 9/27/2015 10/2/2016 10/1/2017 9/30/2018
Total current
assets
4168700000 3971000000 4757900000 5283400000 12494200000
Total current
liabilities
3038700000 3648100000 4546800000 4220700000 5684200000
Inventories 1090900000 1306400000 1378500000 1364000000 1400500000
Year 9/28/2014 9/27/2015 10/2/2016 10/1/2017 9/30/2018
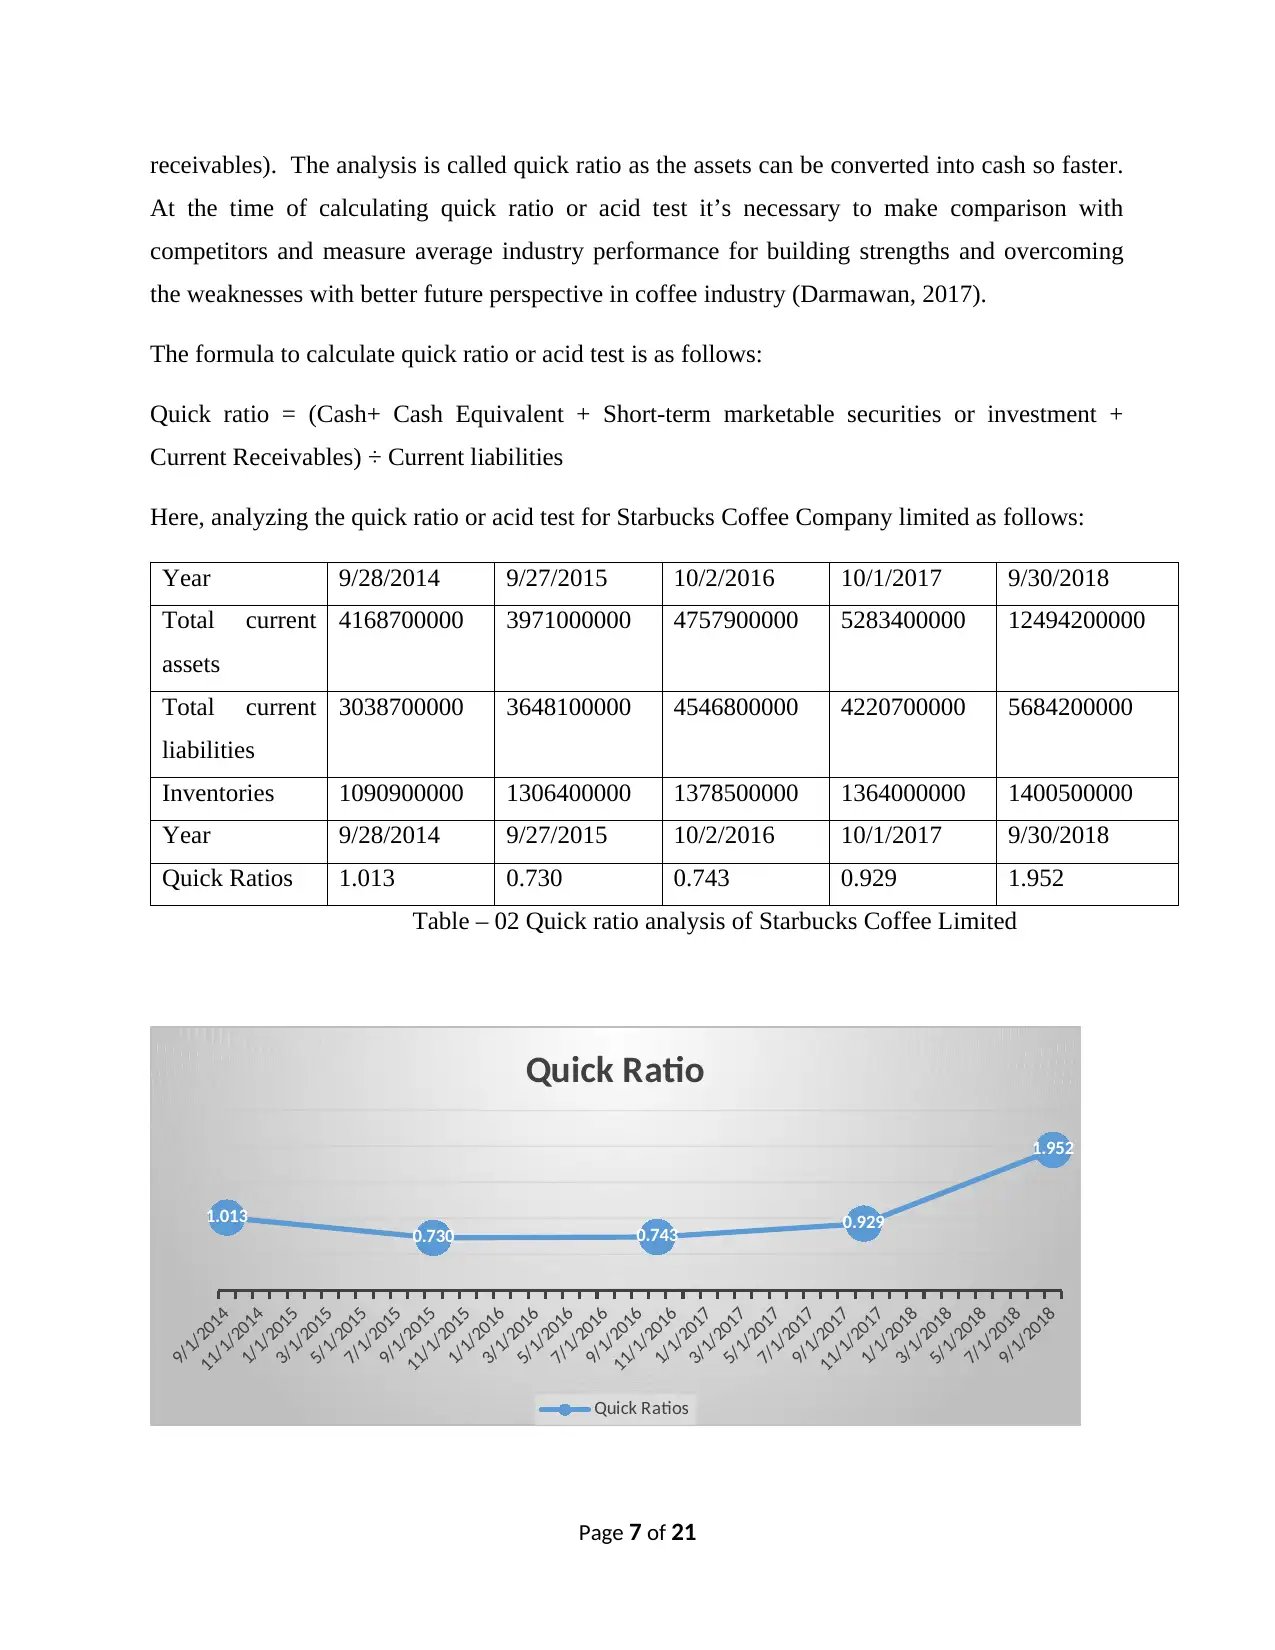
Quick Ratios 1.013 0.730 0.743 0.929 1.952
Table – 02 Quick ratio analysis of Starbucks Coffee Limited
9/1/2014
11/1/2014
1/1/2015
3/1/2015
5/1/2015
7/1/2015
9/1/2015
11/1/2015
1/1/2016
3/1/2016
5/1/2016
7/1/2016
9/1/2016
11/1/2016
1/1/2017
3/1/2017
5/1/2017
7/1/2017
9/1/2017
11/1/2017
1/1/2018
3/1/2018
5/1/2018
7/1/2018
9/1/2018
1.013
0.730 0.743 0.929
1.952
Quick Ratio
Quick Ratios
Page 7 of 21
At the time of calculating quick ratio or acid test it’s necessary to make comparison with
competitors and measure average industry performance for building strengths and overcoming
the weaknesses with better future perspective in coffee industry (Darmawan, 2017).
The formula to calculate quick ratio or acid test is as follows:
Quick ratio = (Cash+ Cash Equivalent + Short-term marketable securities or investment +
Current Receivables) ÷ Current liabilities
Here, analyzing the quick ratio or acid test for Starbucks Coffee Company limited as follows:
Year 9/28/2014 9/27/2015 10/2/2016 10/1/2017 9/30/2018
Total current
assets
4168700000 3971000000 4757900000 5283400000 12494200000
Total current
liabilities
3038700000 3648100000 4546800000 4220700000 5684200000
Inventories 1090900000 1306400000 1378500000 1364000000 1400500000
Year 9/28/2014 9/27/2015 10/2/2016 10/1/2017 9/30/2018
Quick Ratios 1.013 0.730 0.743 0.929 1.952
Table – 02 Quick ratio analysis of Starbucks Coffee Limited
9/1/2014
11/1/2014
1/1/2015
3/1/2015
5/1/2015
7/1/2015
9/1/2015
11/1/2015
1/1/2016
3/1/2016
5/1/2016
7/1/2016
9/1/2016
11/1/2016
1/1/2017
3/1/2017
5/1/2017
7/1/2017
9/1/2017
11/1/2017
1/1/2018
3/1/2018
5/1/2018
7/1/2018
9/1/2018
1.013
0.730 0.743 0.929
1.952
Quick Ratio
Quick Ratios
Page 7 of 21
Paraphrase This Document
Need a fresh take? Get an instant paraphrase of this document with our AI Paraphraser

The graph will help investors to understand the financial condition of Starbuck Coffee easily
with reasonable explanation.
Here, Starbuck Coffee is enjoying increasing quick ratio over the since 2014 to 2018. Higher
ratios are favorable to businesses as it reflects that more quick assets are available than current
liabilities (Jonny, 2016). With a ratio of 1 indicates that firm has quick assets equivalent to
current assets. So, without selling long-term current assets Starbucks can pay off its current
liabilities with quick assets. And the ratio around 2 reflects that Starbucks has twice quick assets
than current liabilities.
The possible ways to Starbucks Coffee to improve quick ratio in an increasing ways can be such
as improving inventory turnover ratio with reduction of cash or receivables collection period.
3. Analysis of long term solvency ratio
The capital structure, long term and short-term solvency can be measured through long-term
solvency ratio. These ratios shows debt-equity mix, assists to evaluate interest payment to total
debt holders and return to equity holders at maturity date (Jonny, 2016). Here, going to present
debt to equity ratio, and times of interest earned are as follows:
3.1 debt to equity ratio
Debt to equity ratio is the result of dividing total debt by total equity to determine the financial
leverage of Starbucks. It measures the level at which a firm can financing its operational
activities through debt as well as shareholder-owned funds (Darmawan, 2017). Also shows the
ability of equity holders to cover outstanding debts in any event of sudden business shutdown.
The formula to calculate debt to equity ratio is presenting as follows:
Here, presenting the debt to equity ratio of Starbucks coffee company as follows:
Particulars 9/28/2014 9/27/2015 10/2/2016 10/1/2017 9/30/2018
Page 8 of 21
Total Liabilities 547920000
0
659650000
0
842180000
0
890860000
0
2298060000
0
Total Shareholder's
Equity
527200000
0
581800000
0
588400000
0
545010000
0
1169500000
Year 9/28/2014 9/27/2015 10/2/2016 10/1/2017 9/30/2018
Debt to Equity
Ratio
1.03930197
3
1.13380886
9
1.43130523
5
1.63457551
2
19.6499358
7
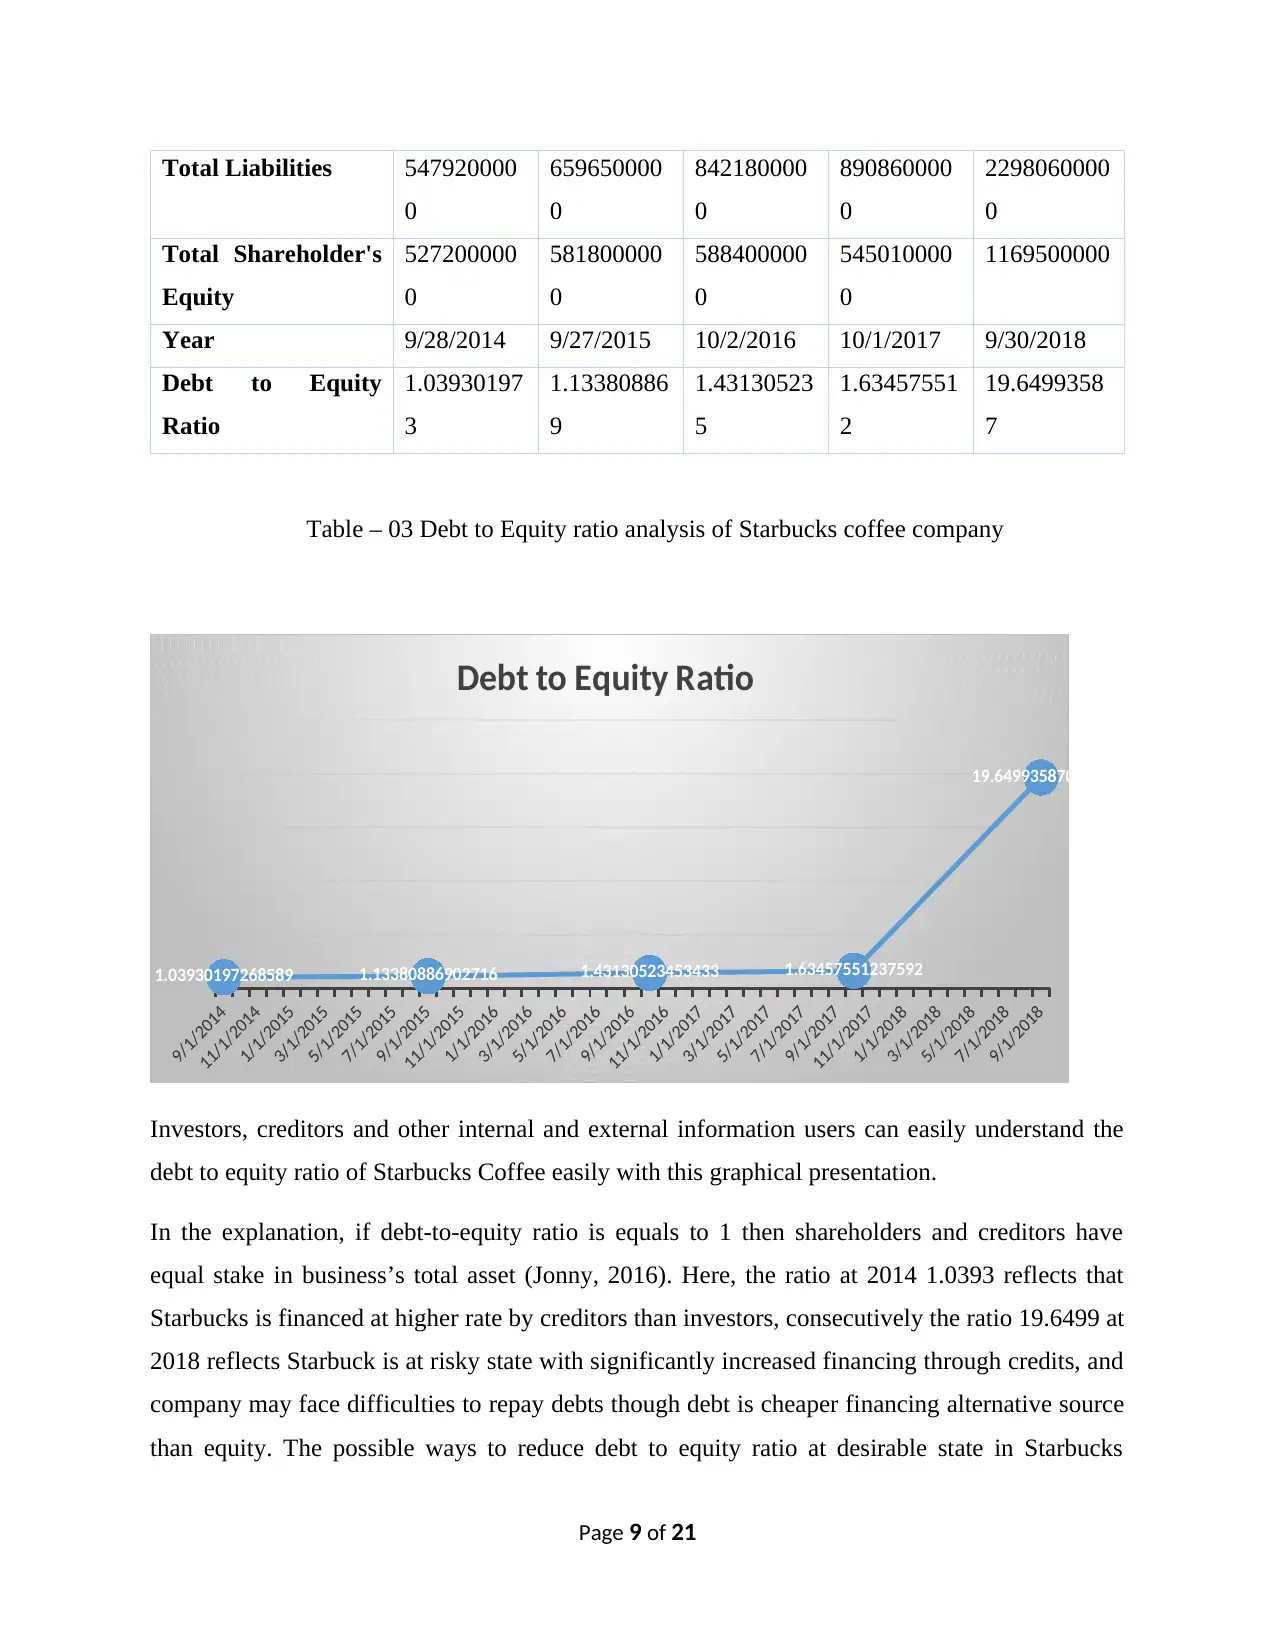
Table – 03 Debt to Equity ratio analysis of Starbucks coffee company
1.03930197268589 1.13380886902716 1.43130523453433 1.63457551237592
19.6499358700299
Debt to Equity Ratio
Investors, creditors and other internal and external information users can easily understand the
debt to equity ratio of Starbucks Coffee easily with this graphical presentation.
In the explanation, if debt-to-equity ratio is equals to 1 then shareholders and creditors have
equal stake in business’s total asset (Jonny, 2016). Here, the ratio at 2014 1.0393 reflects that
Starbucks is financed at higher rate by creditors than investors, consecutively the ratio 19.6499 at
2018 reflects Starbuck is at risky state with significantly increased financing through credits, and
company may face difficulties to repay debts though debt is cheaper financing alternative source
than equity. The possible ways to reduce debt to equity ratio at desirable state in Starbucks
Page 9 of 21
0
659650000
0
842180000
0
890860000
0
2298060000
0
Total Shareholder's
Equity
527200000
0
581800000
0
588400000
0
545010000
0
1169500000
Year 9/28/2014 9/27/2015 10/2/2016 10/1/2017 9/30/2018
Debt to Equity
Ratio
1.03930197
3
1.13380886
9
1.43130523
5
1.63457551
2
19.6499358
7
Table – 03 Debt to Equity ratio analysis of Starbucks coffee company
1.03930197268589 1.13380886902716 1.43130523453433 1.63457551237592
19.6499358700299
Debt to Equity Ratio
Investors, creditors and other internal and external information users can easily understand the
debt to equity ratio of Starbucks Coffee easily with this graphical presentation.
In the explanation, if debt-to-equity ratio is equals to 1 then shareholders and creditors have
equal stake in business’s total asset (Jonny, 2016). Here, the ratio at 2014 1.0393 reflects that
Starbucks is financed at higher rate by creditors than investors, consecutively the ratio 19.6499 at
2018 reflects Starbuck is at risky state with significantly increased financing through credits, and
company may face difficulties to repay debts though debt is cheaper financing alternative source
than equity. The possible ways to reduce debt to equity ratio at desirable state in Starbucks
Page 9 of 21
⊘ This is a preview!⊘
Do you want full access?
Subscribe today to unlock all pages.
Trusted by 1+ million students worldwide
Coffee are increasing profit margin, pay off more risky debts with equity and retained earnings
furthermore after 2018 in Starbucks Coffee.
4. Analysis of profitability ratio
Profitability ratio analysis reflects the generated profit from comprehensive income statements
and evaluate the capacity of firm to earn more profit from business and enhance values of sales
volume, assets value and equity (Omar, and et al 2014). Now, going to analysis net profit margin
and return on equity for Starbucks Coffee Company are as follows:
4.1 Gross profit ratio
The ratios measures the net income earned with each dollar of sales through comparison of net
income and net sales of the firm. So, the profit ratio reflects the left over amount of sales after
paying off all the expenses. The ratio provides information to creditors and investors about
operational efficiency to pay back loans and distributable amount to investors as dividend (Omar,
and et al 2014).
Clemons, (2010) discussed about that though lower ratio indicates firm has higher expenditures
and significantly management requires to cut extra expenses and budgeting the incomes and
expenditures. So, internal management can use the ratio to set performance targets.
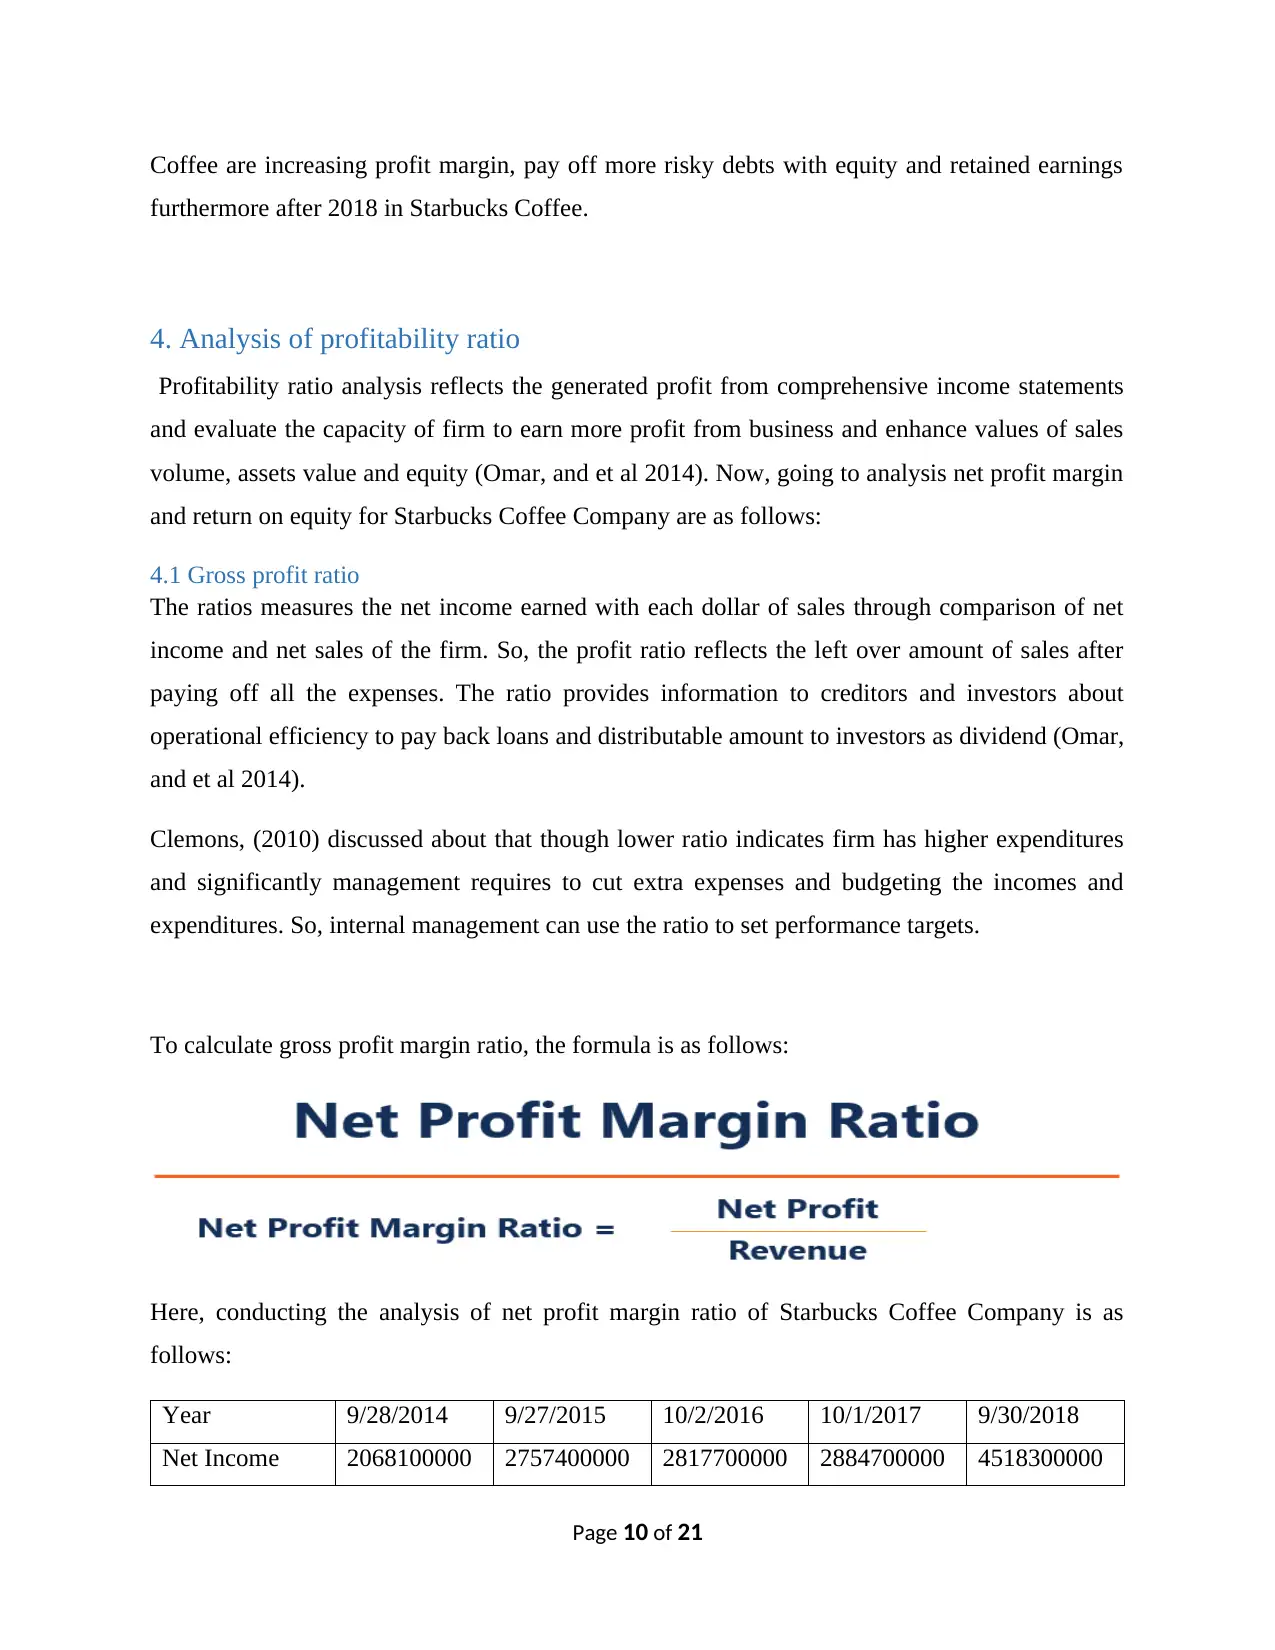
To calculate gross profit margin ratio, the formula is as follows:
Here, conducting the analysis of net profit margin ratio of Starbucks Coffee Company is as
follows:
Year 9/28/2014 9/27/2015 10/2/2016 10/1/2017 9/30/2018
Net Income 2068100000 2757400000 2817700000 2884700000 4518300000
Page 10 of 21
furthermore after 2018 in Starbucks Coffee.
4. Analysis of profitability ratio
Profitability ratio analysis reflects the generated profit from comprehensive income statements
and evaluate the capacity of firm to earn more profit from business and enhance values of sales
volume, assets value and equity (Omar, and et al 2014). Now, going to analysis net profit margin
and return on equity for Starbucks Coffee Company are as follows:
4.1 Gross profit ratio
The ratios measures the net income earned with each dollar of sales through comparison of net
income and net sales of the firm. So, the profit ratio reflects the left over amount of sales after
paying off all the expenses. The ratio provides information to creditors and investors about
operational efficiency to pay back loans and distributable amount to investors as dividend (Omar,
and et al 2014).
Clemons, (2010) discussed about that though lower ratio indicates firm has higher expenditures
and significantly management requires to cut extra expenses and budgeting the incomes and
expenditures. So, internal management can use the ratio to set performance targets.
To calculate gross profit margin ratio, the formula is as follows:
Here, conducting the analysis of net profit margin ratio of Starbucks Coffee Company is as
follows:
Year 9/28/2014 9/27/2015 10/2/2016 10/1/2017 9/30/2018
Net Income 2068100000 2757400000 2817700000 2884700000 4518300000
Page 10 of 21
Paraphrase This Document
Need a fresh take? Get an instant paraphrase of this document with our AI Paraphraser
Revenue 1644780000
0
1916270000
0
2131590000
0
2238680000
0
2471950000
0
Year 9/28/2014 9/27/2015 10/2/2016 10/1/2017 9/30/2018
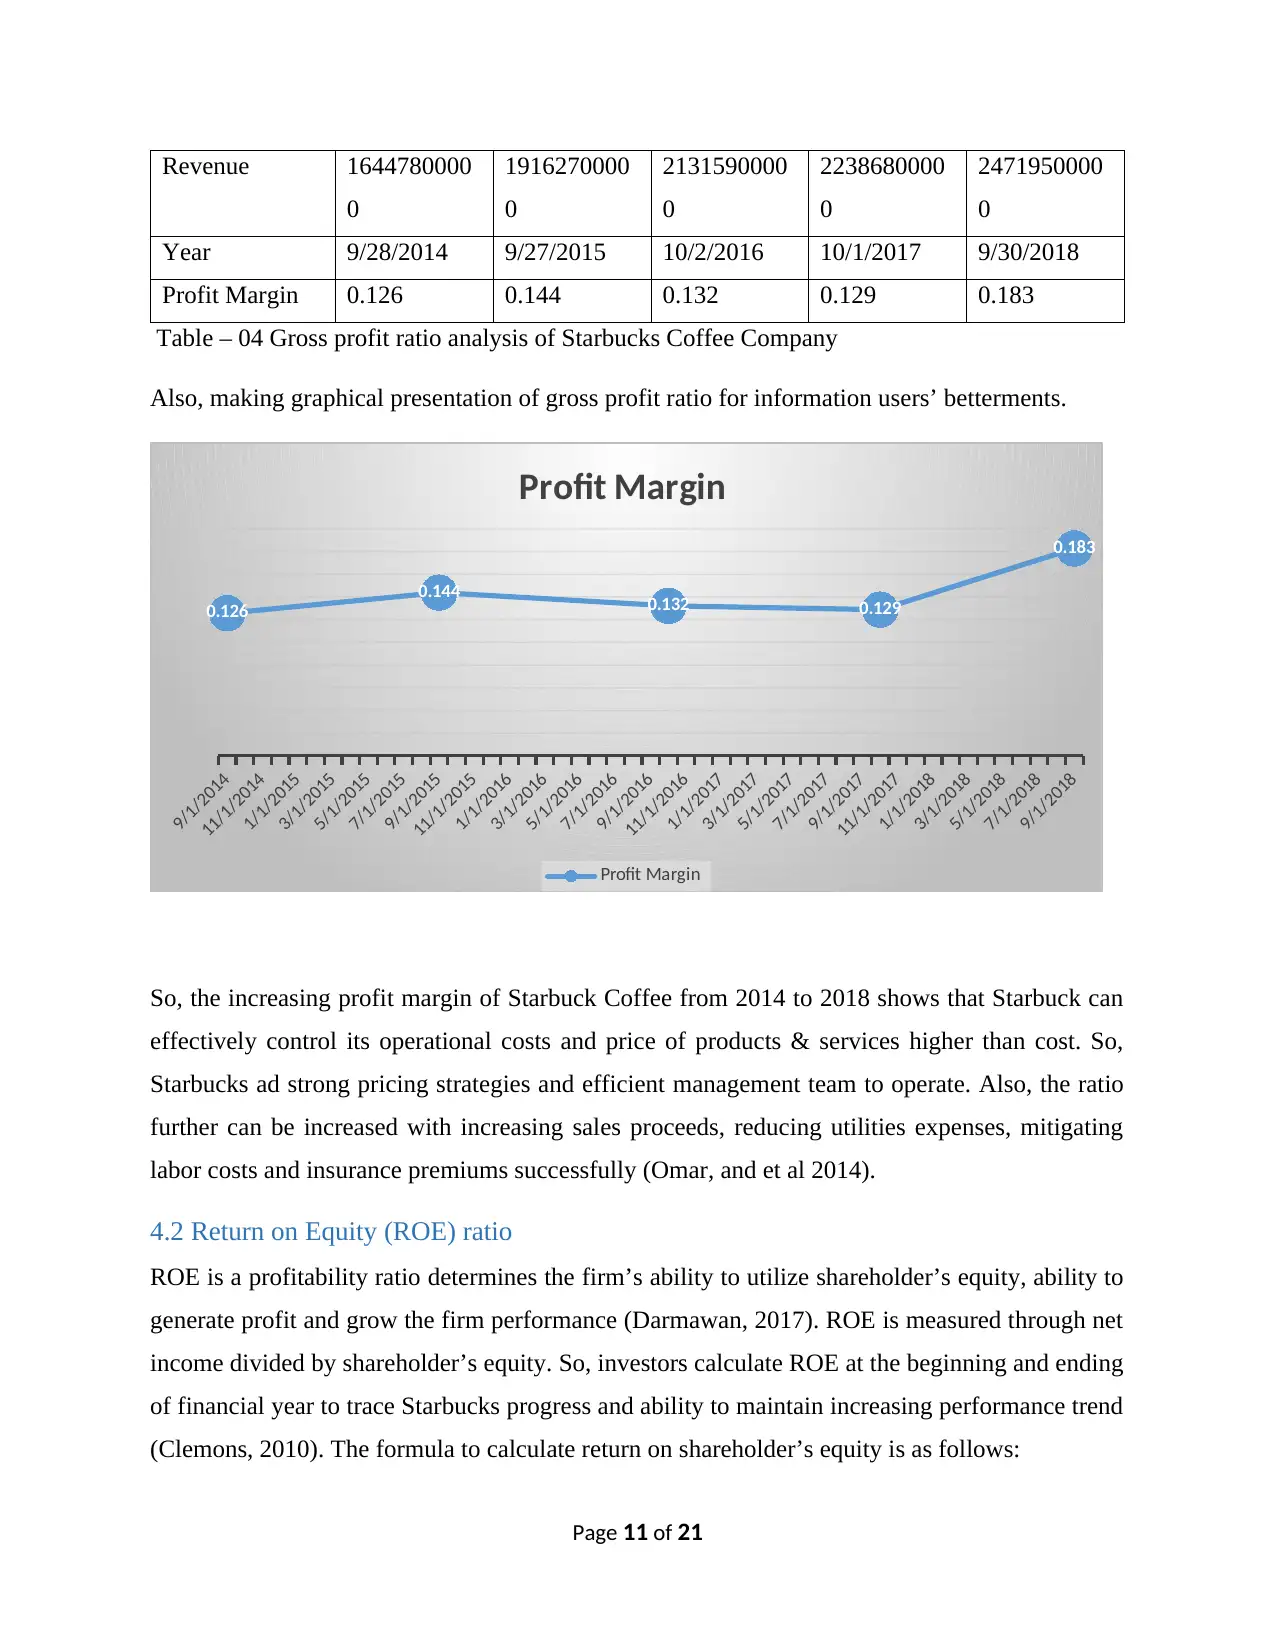
Profit Margin 0.126 0.144 0.132 0.129 0.183
Table – 04 Gross profit ratio analysis of Starbucks Coffee Company
Also, making graphical presentation of gross profit ratio for information users’ betterments.
9/1/2014
11/1/2014
1/1/2015
3/1/2015
5/1/2015
7/1/2015
9/1/2015
11/1/2015
1/1/2016
3/1/2016
5/1/2016
7/1/2016
9/1/2016
11/1/2016
1/1/2017
3/1/2017
5/1/2017
7/1/2017
9/1/2017
11/1/2017
1/1/2018
3/1/2018
5/1/2018
7/1/2018
9/1/2018
0.126
0.144 0.132 0.129
0.183
Profit Margin
Profit Margin
So, the increasing profit margin of Starbuck Coffee from 2014 to 2018 shows that Starbuck can
effectively control its operational costs and price of products & services higher than cost. So,
Starbucks ad strong pricing strategies and efficient management team to operate. Also, the ratio
further can be increased with increasing sales proceeds, reducing utilities expenses, mitigating
labor costs and insurance premiums successfully (Omar, and et al 2014).
4.2 Return on Equity (ROE) ratio
ROE is a profitability ratio determines the firm’s ability to utilize shareholder’s equity, ability to
generate profit and grow the firm performance (Darmawan, 2017). ROE is measured through net
income divided by shareholder’s equity. So, investors calculate ROE at the beginning and ending
of financial year to trace Starbucks progress and ability to maintain increasing performance trend
(Clemons, 2010). The formula to calculate return on shareholder’s equity is as follows:
Page 11 of 21
0
1916270000
0
2131590000
0
2238680000
0
2471950000
0
Year 9/28/2014 9/27/2015 10/2/2016 10/1/2017 9/30/2018
Profit Margin 0.126 0.144 0.132 0.129 0.183
Table – 04 Gross profit ratio analysis of Starbucks Coffee Company
Also, making graphical presentation of gross profit ratio for information users’ betterments.
9/1/2014
11/1/2014
1/1/2015
3/1/2015
5/1/2015
7/1/2015
9/1/2015
11/1/2015
1/1/2016
3/1/2016
5/1/2016
7/1/2016
9/1/2016
11/1/2016
1/1/2017
3/1/2017
5/1/2017
7/1/2017
9/1/2017
11/1/2017
1/1/2018
3/1/2018
5/1/2018
7/1/2018
9/1/2018
0.126
0.144 0.132 0.129
0.183
Profit Margin
Profit Margin
So, the increasing profit margin of Starbuck Coffee from 2014 to 2018 shows that Starbuck can
effectively control its operational costs and price of products & services higher than cost. So,
Starbucks ad strong pricing strategies and efficient management team to operate. Also, the ratio
further can be increased with increasing sales proceeds, reducing utilities expenses, mitigating
labor costs and insurance premiums successfully (Omar, and et al 2014).
4.2 Return on Equity (ROE) ratio
ROE is a profitability ratio determines the firm’s ability to utilize shareholder’s equity, ability to
generate profit and grow the firm performance (Darmawan, 2017). ROE is measured through net
income divided by shareholder’s equity. So, investors calculate ROE at the beginning and ending
of financial year to trace Starbucks progress and ability to maintain increasing performance trend
(Clemons, 2010). The formula to calculate return on shareholder’s equity is as follows:
Page 11 of 21

Here, performing the return on equity of Starbucks Coffee Company is as follows:
Year 9/28/2014 9/27/2015 10/2/2016 10/1/2017 9/30/2018
Net Income 2,068,100,00
0
2,757,400,00
0
2,817,700,00
0
2,884,700,00
0
4,518,300,00
0
Total
shareholders’
equity
5,272,000,00
0
5,818,000,00
0
5,884,000,00
0
5,450,100,00
0
1,169,500,00
0
Year 9/28/2014 9/27/2015 10/2/2016 10/1/2017 9/30/2018
Return On
Equity
0.39227997 0.473942936 0.478874915 0.52929304 3.863445917
Table – 05 Return on Equity of Starbucks Coffee Company
Also, the graphical presentation of ROE ratio is presenting:
0.392279969650
986
0.473942935716
741
0.478874915023
793
0.529293040494
67
3.863445917058
57
Return On Equity
Return On Equity
Page 12 of 21
Year 9/28/2014 9/27/2015 10/2/2016 10/1/2017 9/30/2018
Net Income 2,068,100,00
0
2,757,400,00
0
2,817,700,00
0
2,884,700,00
0
4,518,300,00
0
Total
shareholders’
equity
5,272,000,00
0
5,818,000,00
0
5,884,000,00
0
5,450,100,00
0
1,169,500,00
0
Year 9/28/2014 9/27/2015 10/2/2016 10/1/2017 9/30/2018
Return On
Equity
0.39227997 0.473942936 0.478874915 0.52929304 3.863445917
Table – 05 Return on Equity of Starbucks Coffee Company
Also, the graphical presentation of ROE ratio is presenting:
0.392279969650
986
0.473942935716
741
0.478874915023
793
0.529293040494
67
3.863445917058
57
Return On Equity
Return On Equity
Page 12 of 21
⊘ This is a preview!⊘
Do you want full access?
Subscribe today to unlock all pages.
Trusted by 1+ million students worldwide
1 out of 21
Related Documents


Your All-in-One AI-Powered Toolkit for Academic Success.
+13062052269
info@desklib.com
Available 24*7 on WhatsApp / Email
![[object Object]](/_next/static/media/star-bottom.7253800d.svg)
Unlock your academic potential
Copyright © 2020–2026 A2Z Services. All Rights Reserved. Developed and managed by ZUCOL.