HI5002 Finance: Financial Analysis of Suncorp Group Limited Report
VerifiedAdded on 2023/03/31
|13
|3659
|381
Report
AI Summary
This report presents a financial analysis of Suncorp Group Limited, an Australian banking and insurance company, evaluating its financial performance for investment purposes. It examines key aspects such as company description, governance, sustainability policies, and awards. The analysis includes the calculation and interpretation of profitability and efficiency ratios over a three-year period. The report also assesses cash management practices and conducts a sensitivity analysis to determine the company's volatility under different scenarios. Furthermore, it discusses the company's dividend policy and identifies potential risks. The report concludes with a recommendation for the investor, based on the findings of the financial analysis, to determine if investment is viable.
1
Suncorp group Limited financial analysis report for investment
Abstract
This report is a financial analysis of Suncorp Group Limited which is an Australia based
banking and insurance company. The report studies major factors that can affect the
investment from the annual report and financial reports of the company and aims to
calculate and minimize the investment risk for the investor in question. The report
includes final recommendation for the investor with the point of investing in the company
as their institutional investment.
I. Introduction
As a group of investment analysts working in Australia, we need to provide investment
advice to one of our major institutional investor residing in the overseas about Australian
investment market. As an investor we have chosen Suncorp Group Limited which is
listed on ASX website as well. This report will be an evaluation of financial performance
of the company over the span of at least 3 years and will analyze how the company has
been performing in terms of financial ratios in the previous years. The company’s major
area of work and infrastructure has been described first so that the investor has an idea
about the nature and performance of the company which is then followed by critical
analysis of the company about its governance and sustainability policies. The major
accolades that a company has earned over recent years and which have made the
company trust worthy have also been discussed.
Since the availability of funds and liquidity are a major determining factors for an
investment, the company’s cash management has been studied as well and marketable
securities have been defined too. Next, we run a short sensitivity analysis of the
company on a given pre defined scenario and test it for changes in sales. This will
determine how volatile the company is. Various scenarios including loss and gain in
sales have been used to give a better idea to the client about the nature of the
sensitivity and as a performance indicator. The company’s dividend policy and dividend
payout ratio have also been discussed along with identifying some systemic and un-
systemic risks affecting the company. Lastly, a recommendation has been made based
on the financial analysis done in this report.
II. Financial Analysis of selected company
2.1. Description of the company
Suncorp Group Limited is a publicly registered company and it is based off in Australia.
The head office lies in Brisbane. Suncorp is primarily involved in banking and insurance
company along with additional services of wealth management and services including
Paraphrase This Document
Need a fresh take? Get an instant paraphrase of this document with our AI Paraphraser
2
wealth products. The company has followed the TCFD recommendations for climate
based financial disclosures in its annual review so that comes across as a plus point for
the company. Historically, the company has been performing moderately well.
The company has worked well in the area of community governance and responsibility.
It has also worked in the area of rehabilitation of the migrants by providing refuge and
employment in their organization to the migrants. The company displayed a score of 7.3
on customer satisfactory score card which is pretty impressive score for a banking and
finance sector company. The company claims to have solved 92% level 1 complaints
from their customers within 5 days and the percentage of resolution of level 2 problems
being solved within a time span of 21 days was as high as 80 percent.
The company has bagged Money magazine Business Bank Accreditations award for
the Year 2018 and Money magazine Bank award for the Year 2018. The company is
also a winner of Cannes Lion International Festival of Creativity Silver Award of year
2017. Some other awards that the company has bagged in recent years-
ANZIFF Australian Insurance Industry Awards Innovation of the Year 2017 for its
insurance product Suncorp Cyclone Resilience Benefit
Best Finance IT Project 2018 in IT news benchmark awards for 2018
Australian LGBTI Inclusion Awards 2018 by AWEI Bronze employer was won by
Suncorp Group Limited as well
The company deals effectively in governance, social and material environmental topics.
There are adequate section devotions in its annual reports for sustainable growth with
respect to climatic change impact on business and environment, the transitional and
physical risks involved, building resilience in its community and being ready with
disaster response program. Most importantly, the list of awards goes on to show that
the financial services and the products that the company provides are reliable and
responsive, and that they add value to the lives of their customers.
2.2. Calculation and analysis of selected performance ratios
Investment is a risk taking process and to ensure that a large amount of risk is
calculated, we need to run various financial ratio analyses before actually investing in a
company. Not only the financial ratio analysis helps us to determine current conditions
in the company, but it also helps in determining the trend over last few years so that the
investor can compare the same and make informed decisions. There are many financial
ratios with the help of which we can analyze the financial trends of a company like
3
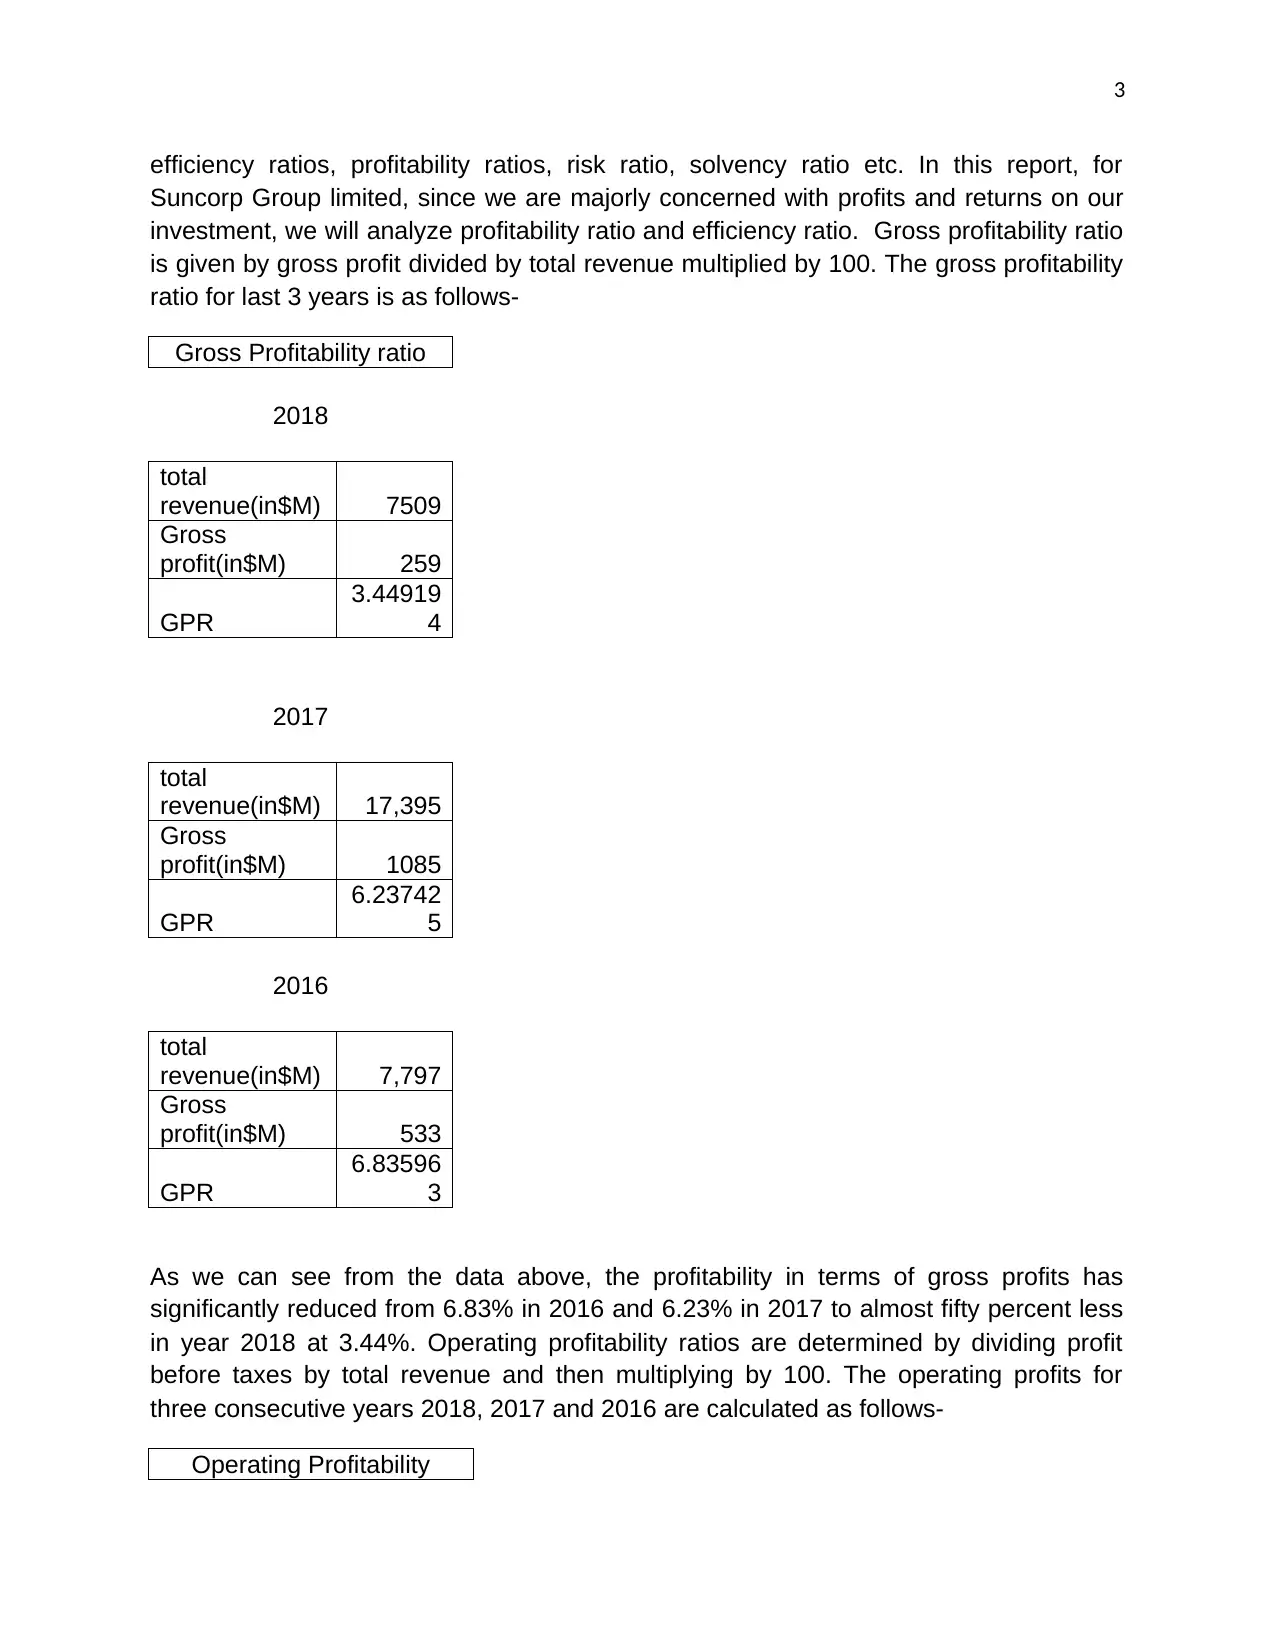
efficiency ratios, profitability ratios, risk ratio, solvency ratio etc. In this report, for
Suncorp Group limited, since we are majorly concerned with profits and returns on our
investment, we will analyze profitability ratio and efficiency ratio. Gross profitability ratio
is given by gross profit divided by total revenue multiplied by 100. The gross profitability
ratio for last 3 years is as follows-
Gross Profitability ratio
2018
total
revenue(in$M) 7509
Gross
profit(in$M) 259
GPR
3.44919
4
2017
total
revenue(in$M) 17,395
Gross
profit(in$M) 1085
GPR
6.23742
5
2016
total
revenue(in$M) 7,797
Gross
profit(in$M) 533
GPR
6.83596
3
As we can see from the data above, the profitability in terms of gross profits has
significantly reduced from 6.83% in 2016 and 6.23% in 2017 to almost fifty percent less
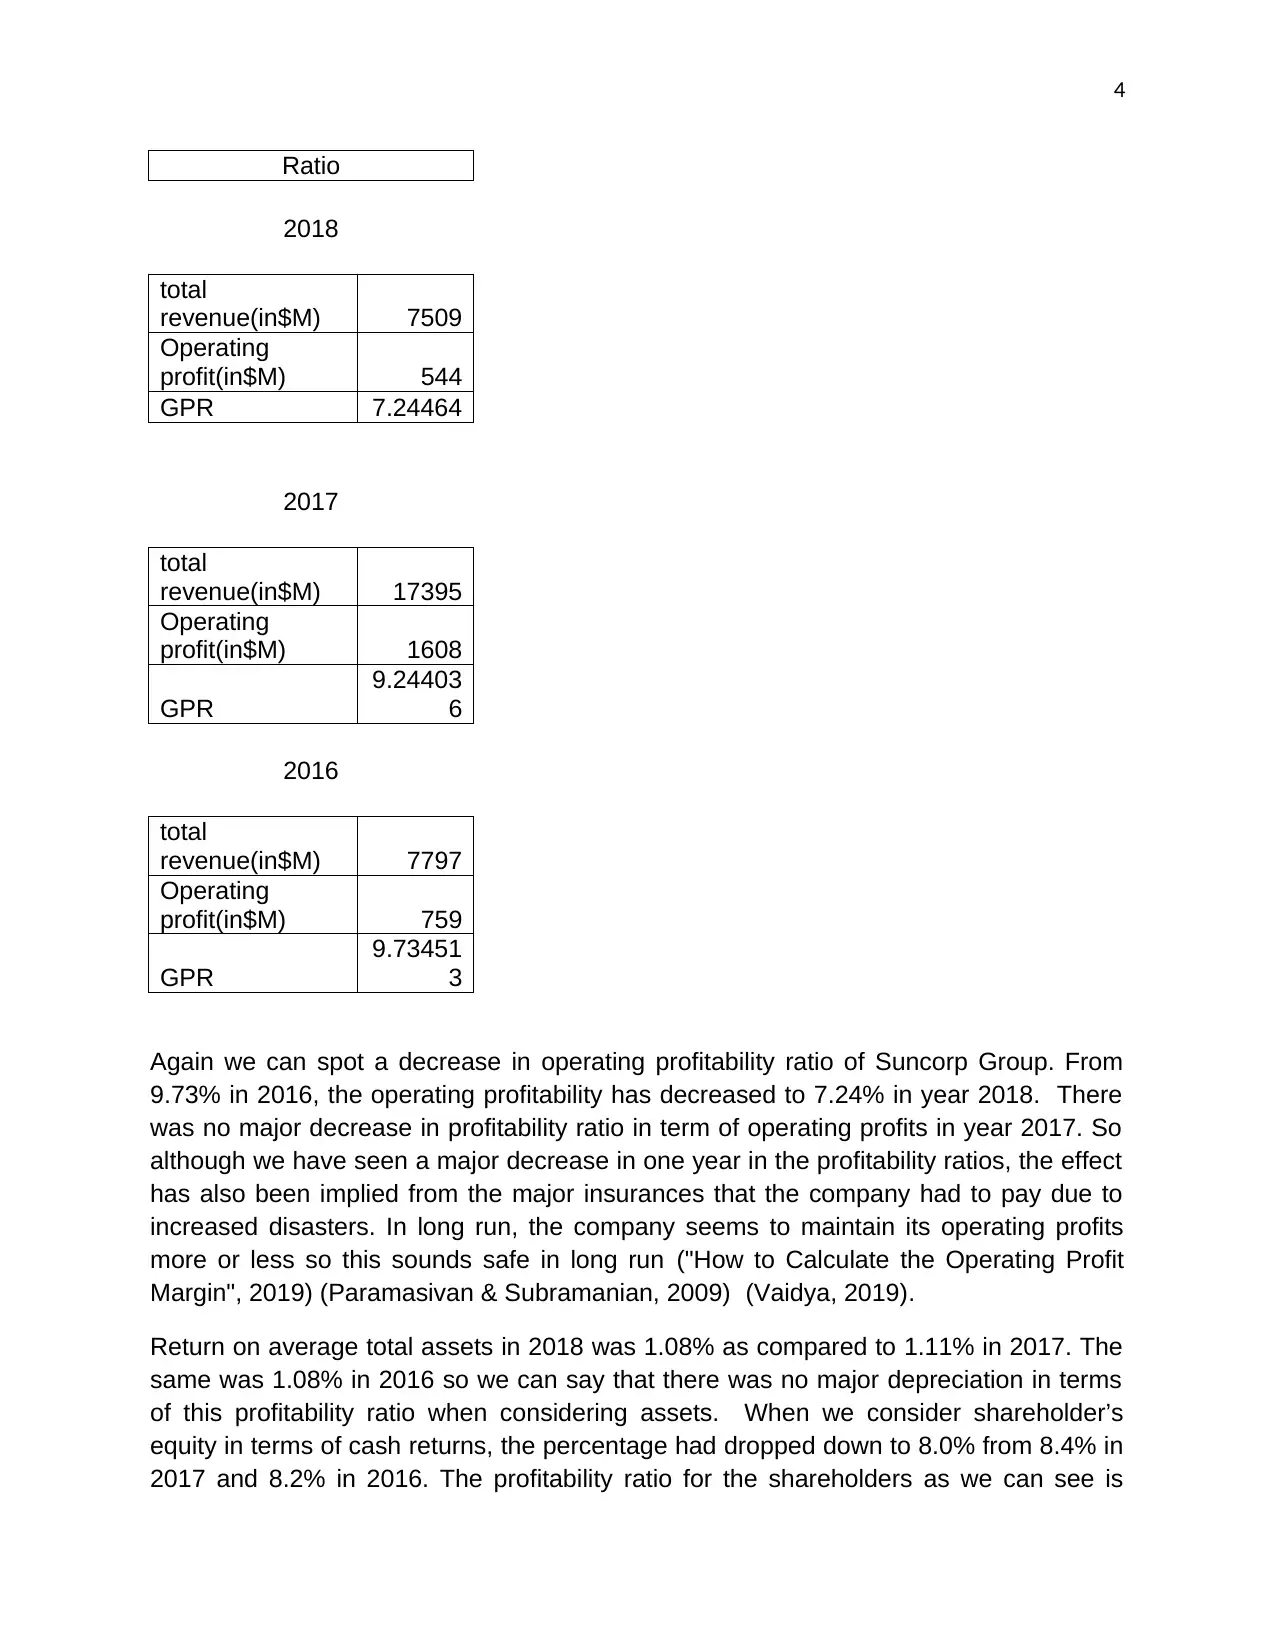
in year 2018 at 3.44%. Operating profitability ratios are determined by dividing profit
before taxes by total revenue and then multiplying by 100. The operating profits for
three consecutive years 2018, 2017 and 2016 are calculated as follows-
Operating Profitability
efficiency ratios, profitability ratios, risk ratio, solvency ratio etc. In this report, for
Suncorp Group limited, since we are majorly concerned with profits and returns on our
investment, we will analyze profitability ratio and efficiency ratio. Gross profitability ratio
is given by gross profit divided by total revenue multiplied by 100. The gross profitability
ratio for last 3 years is as follows-
Gross Profitability ratio
2018
total
revenue(in$M) 7509
Gross
profit(in$M) 259
GPR
3.44919
4
2017
total
revenue(in$M) 17,395
Gross
profit(in$M) 1085
GPR
6.23742
5
2016
total
revenue(in$M) 7,797
Gross
profit(in$M) 533
GPR
6.83596
3
As we can see from the data above, the profitability in terms of gross profits has
significantly reduced from 6.83% in 2016 and 6.23% in 2017 to almost fifty percent less
in year 2018 at 3.44%. Operating profitability ratios are determined by dividing profit
before taxes by total revenue and then multiplying by 100. The operating profits for
three consecutive years 2018, 2017 and 2016 are calculated as follows-
Operating Profitability
⊘ This is a preview!⊘
Do you want full access?
Subscribe today to unlock all pages.
Trusted by 1+ million students worldwide
4
Ratio
2018
total
revenue(in$M) 7509
Operating
profit(in$M) 544
GPR 7.24464
2017
total
revenue(in$M) 17395
Operating
profit(in$M) 1608
GPR
9.24403
6
2016
total
revenue(in$M) 7797
Operating
profit(in$M) 759
GPR
9.73451
3
Again we can spot a decrease in operating profitability ratio of Suncorp Group. From
9.73% in 2016, the operating profitability has decreased to 7.24% in year 2018. There
was no major decrease in profitability ratio in term of operating profits in year 2017. So
although we have seen a major decrease in one year in the profitability ratios, the effect
has also been implied from the major insurances that the company had to pay due to
increased disasters. In long run, the company seems to maintain its operating profits
more or less so this sounds safe in long run ("How to Calculate the Operating Profit
Margin", 2019) (Paramasivan & Subramanian, 2009) (Vaidya, 2019).
Return on average total assets in 2018 was 1.08% as compared to 1.11% in 2017. The
same was 1.08% in 2016 so we can say that there was no major depreciation in terms
of this profitability ratio when considering assets. When we consider shareholder’s
equity in terms of cash returns, the percentage had dropped down to 8.0% from 8.4% in
2017 and 8.2% in 2016. The profitability ratio for the shareholders as we can see is
Paraphrase This Document
Need a fresh take? Get an instant paraphrase of this document with our AI Paraphraser
5
lesser in 2018. A company should either maintain a steady profitability ratio over the
years or maintain a steady growth in profitability ratios. We cannot see either one of the
parameters being fulfilled here in terms of at least profitability ratios.
In contrast to higher profitability ratios being desirable for a company, we must look for
low efficiency ratios to estimate how efficient a company is. Operating efficiency ratios
determine to what extent and how meticulously the company has applied their operating
assets to drive sales. The four major operating efficiency ratios are credit turnover ratio,
asset turnover ratio, debtors turnover ratio and stock turnover ratio. So the operating
profit ratios should be low for high returns.
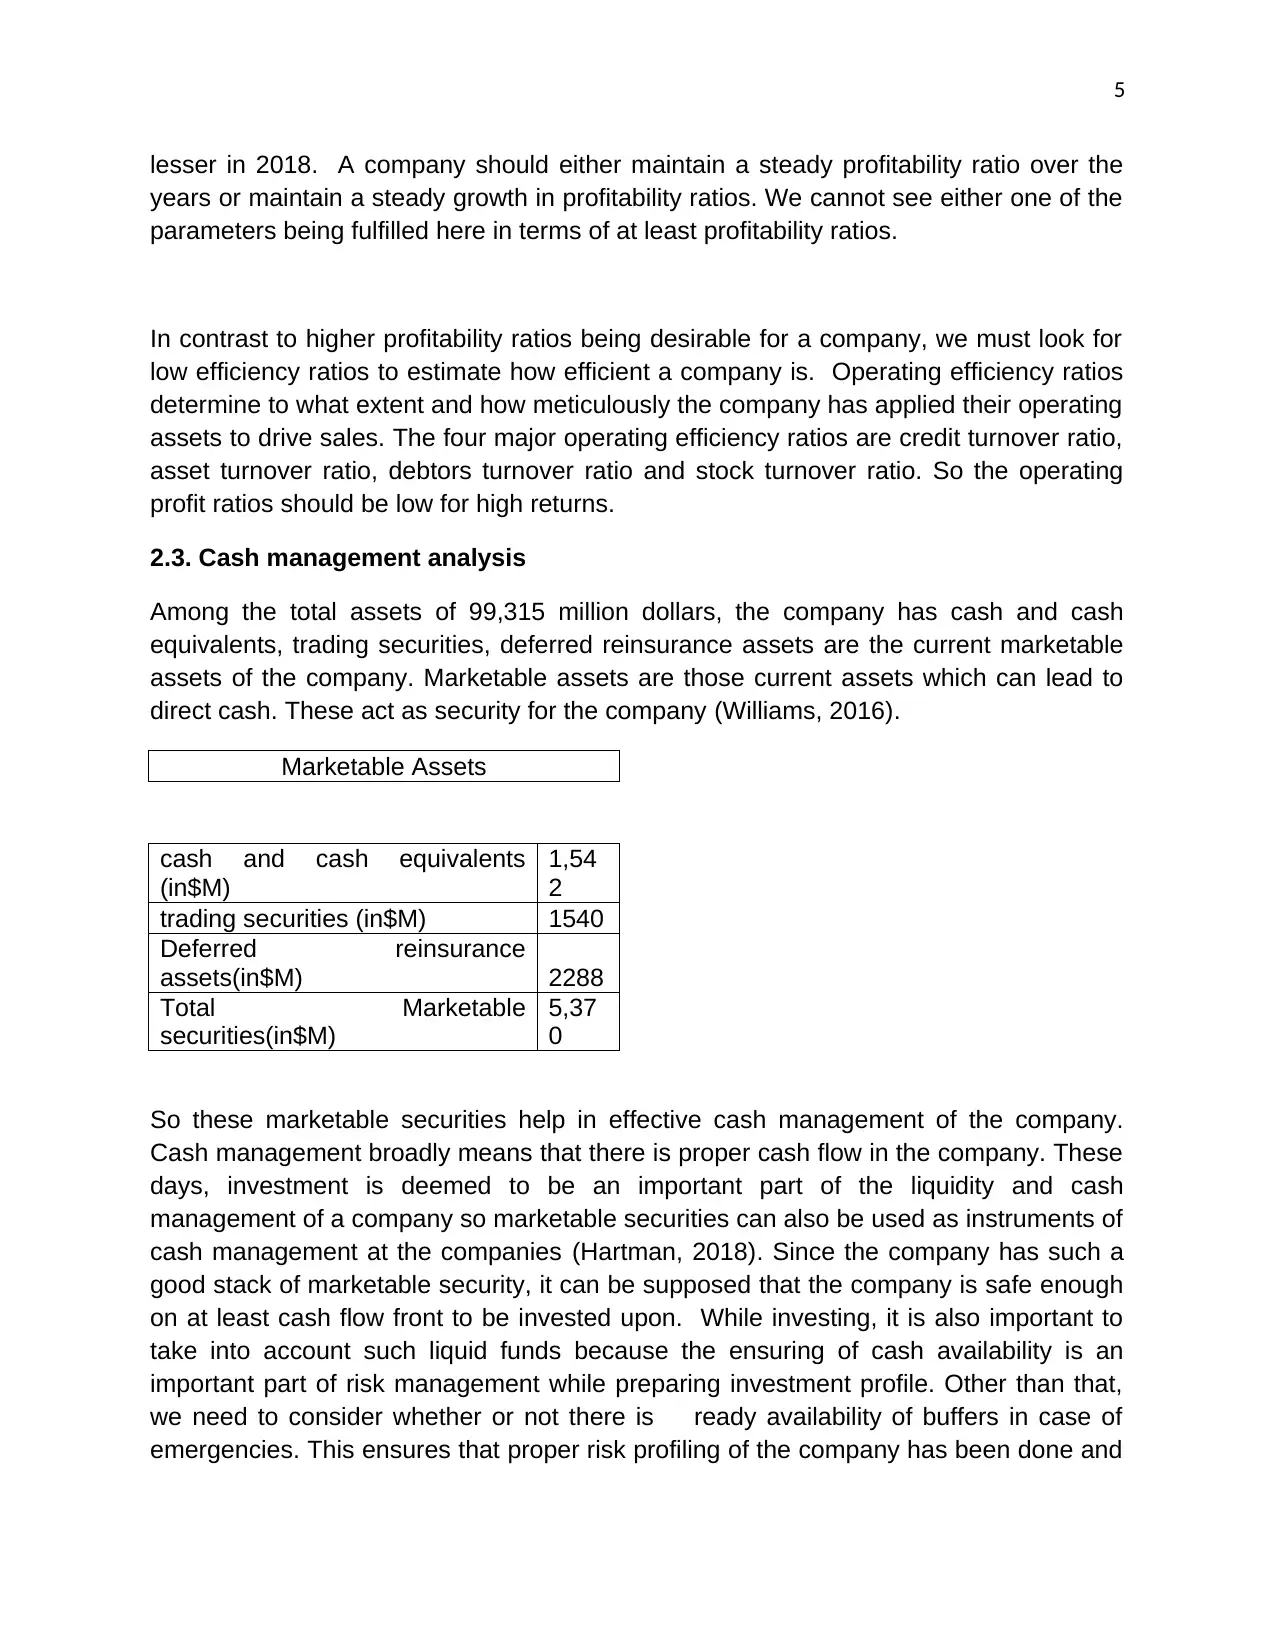
2.3. Cash management analysis
Among the total assets of 99,315 million dollars, the company has cash and cash
equivalents, trading securities, deferred reinsurance assets are the current marketable
assets of the company. Marketable assets are those current assets which can lead to
direct cash. These act as security for the company (Williams, 2016).
Marketable Assets
cash and cash equivalents
(in$M)
1,54
2
trading securities (in$M) 1540
Deferred reinsurance
assets(in$M) 2288
Total Marketable
securities(in$M)
5,37
0
So these marketable securities help in effective cash management of the company.
Cash management broadly means that there is proper cash flow in the company. These
days, investment is deemed to be an important part of the liquidity and cash
management of a company so marketable securities can also be used as instruments of
cash management at the companies (Hartman, 2018). Since the company has such a
good stack of marketable security, it can be supposed that the company is safe enough
on at least cash flow front to be invested upon. While investing, it is also important to
take into account such liquid funds because the ensuring of cash availability is an
important part of risk management while preparing investment profile. Other than that,
we need to consider whether or not there is ready availability of buffers in case of
emergencies. This ensures that proper risk profiling of the company has been done and
lesser in 2018. A company should either maintain a steady profitability ratio over the
years or maintain a steady growth in profitability ratios. We cannot see either one of the
parameters being fulfilled here in terms of at least profitability ratios.
In contrast to higher profitability ratios being desirable for a company, we must look for
low efficiency ratios to estimate how efficient a company is. Operating efficiency ratios
determine to what extent and how meticulously the company has applied their operating
assets to drive sales. The four major operating efficiency ratios are credit turnover ratio,
asset turnover ratio, debtors turnover ratio and stock turnover ratio. So the operating
profit ratios should be low for high returns.
2.3. Cash management analysis
Among the total assets of 99,315 million dollars, the company has cash and cash
equivalents, trading securities, deferred reinsurance assets are the current marketable
assets of the company. Marketable assets are those current assets which can lead to
direct cash. These act as security for the company (Williams, 2016).
Marketable Assets
cash and cash equivalents
(in$M)
1,54
2
trading securities (in$M) 1540
Deferred reinsurance
assets(in$M) 2288
Total Marketable
securities(in$M)
5,37
0
So these marketable securities help in effective cash management of the company.
Cash management broadly means that there is proper cash flow in the company. These
days, investment is deemed to be an important part of the liquidity and cash
management of a company so marketable securities can also be used as instruments of
cash management at the companies (Hartman, 2018). Since the company has such a
good stack of marketable security, it can be supposed that the company is safe enough
on at least cash flow front to be invested upon. While investing, it is also important to
take into account such liquid funds because the ensuring of cash availability is an
important part of risk management while preparing investment profile. Other than that,
we need to consider whether or not there is ready availability of buffers in case of
emergencies. This ensures that proper risk profiling of the company has been done and
6
the risk is reduced comparatively while investing (FY 2015-16 report, 2019) (FY 2017
Sungroup, 2019) (Sovbetov, 2012) (FY 2017-18 report, 2019).
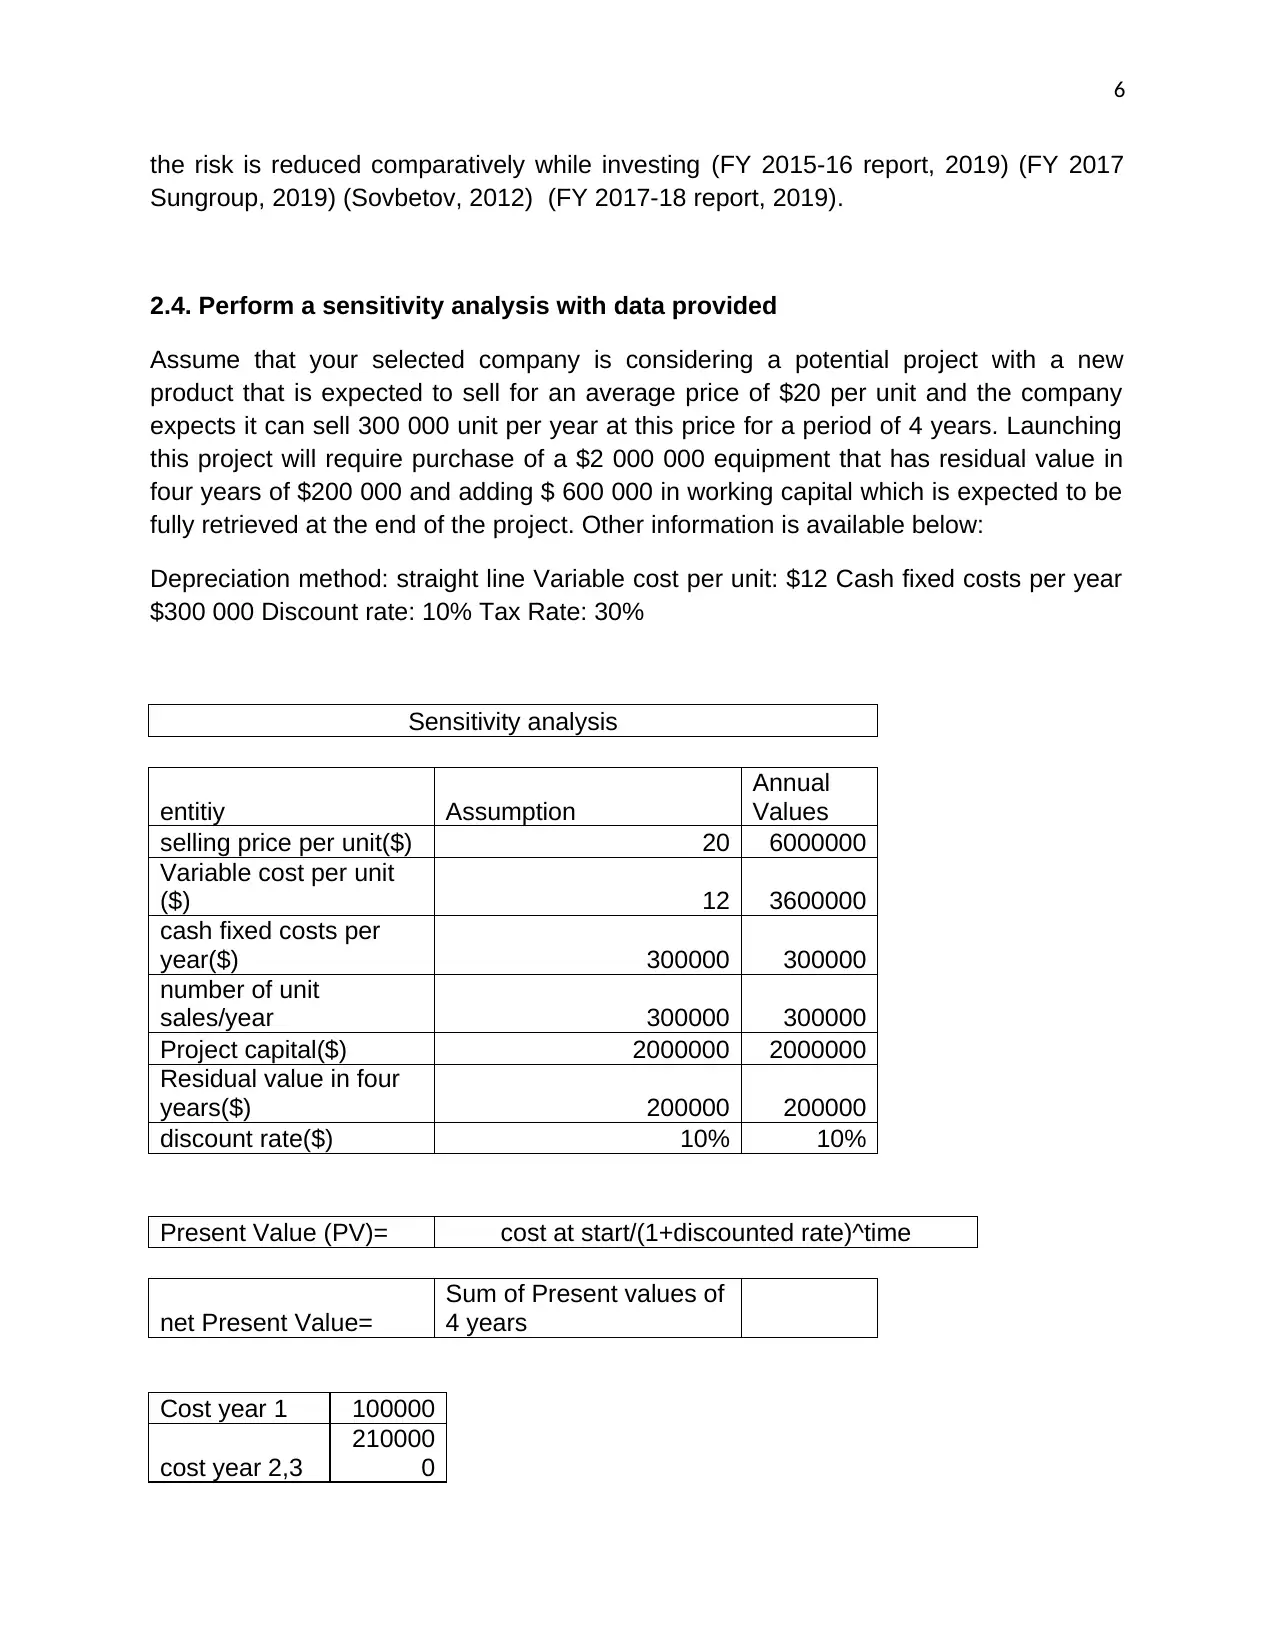
2.4. Perform a sensitivity analysis with data provided
Assume that your selected company is considering a potential project with a new
product that is expected to sell for an average price of $20 per unit and the company
expects it can sell 300 000 unit per year at this price for a period of 4 years. Launching
this project will require purchase of a $2 000 000 equipment that has residual value in
four years of $200 000 and adding $ 600 000 in working capital which is expected to be
fully retrieved at the end of the project. Other information is available below:
Depreciation method: straight line Variable cost per unit: $12 Cash fixed costs per year
$300 000 Discount rate: 10% Tax Rate: 30%
Sensitivity analysis
entitiy Assumption
Annual
Values
selling price per unit($) 20 6000000
Variable cost per unit
($) 12 3600000
cash fixed costs per
year($) 300000 300000
number of unit
sales/year 300000 300000
Project capital($) 2000000 2000000
Residual value in four
years($) 200000 200000
discount rate($) 10% 10%
Present Value (PV)= cost at start/(1+discounted rate)^time
net Present Value=
Sum of Present values of
4 years
Cost year 1 100000
cost year 2,3
210000
0
the risk is reduced comparatively while investing (FY 2015-16 report, 2019) (FY 2017
Sungroup, 2019) (Sovbetov, 2012) (FY 2017-18 report, 2019).
2.4. Perform a sensitivity analysis with data provided
Assume that your selected company is considering a potential project with a new
product that is expected to sell for an average price of $20 per unit and the company
expects it can sell 300 000 unit per year at this price for a period of 4 years. Launching
this project will require purchase of a $2 000 000 equipment that has residual value in
four years of $200 000 and adding $ 600 000 in working capital which is expected to be
fully retrieved at the end of the project. Other information is available below:
Depreciation method: straight line Variable cost per unit: $12 Cash fixed costs per year
$300 000 Discount rate: 10% Tax Rate: 30%
Sensitivity analysis
entitiy Assumption
Annual
Values
selling price per unit($) 20 6000000
Variable cost per unit
($) 12 3600000
cash fixed costs per
year($) 300000 300000
number of unit
sales/year 300000 300000
Project capital($) 2000000 2000000
Residual value in four
years($) 200000 200000
discount rate($) 10% 10%
Present Value (PV)= cost at start/(1+discounted rate)^time
net Present Value=
Sum of Present values of
4 years
Cost year 1 100000
cost year 2,3
210000
0
⊘ This is a preview!⊘
Do you want full access?
Subscribe today to unlock all pages.
Trusted by 1+ million students worldwide
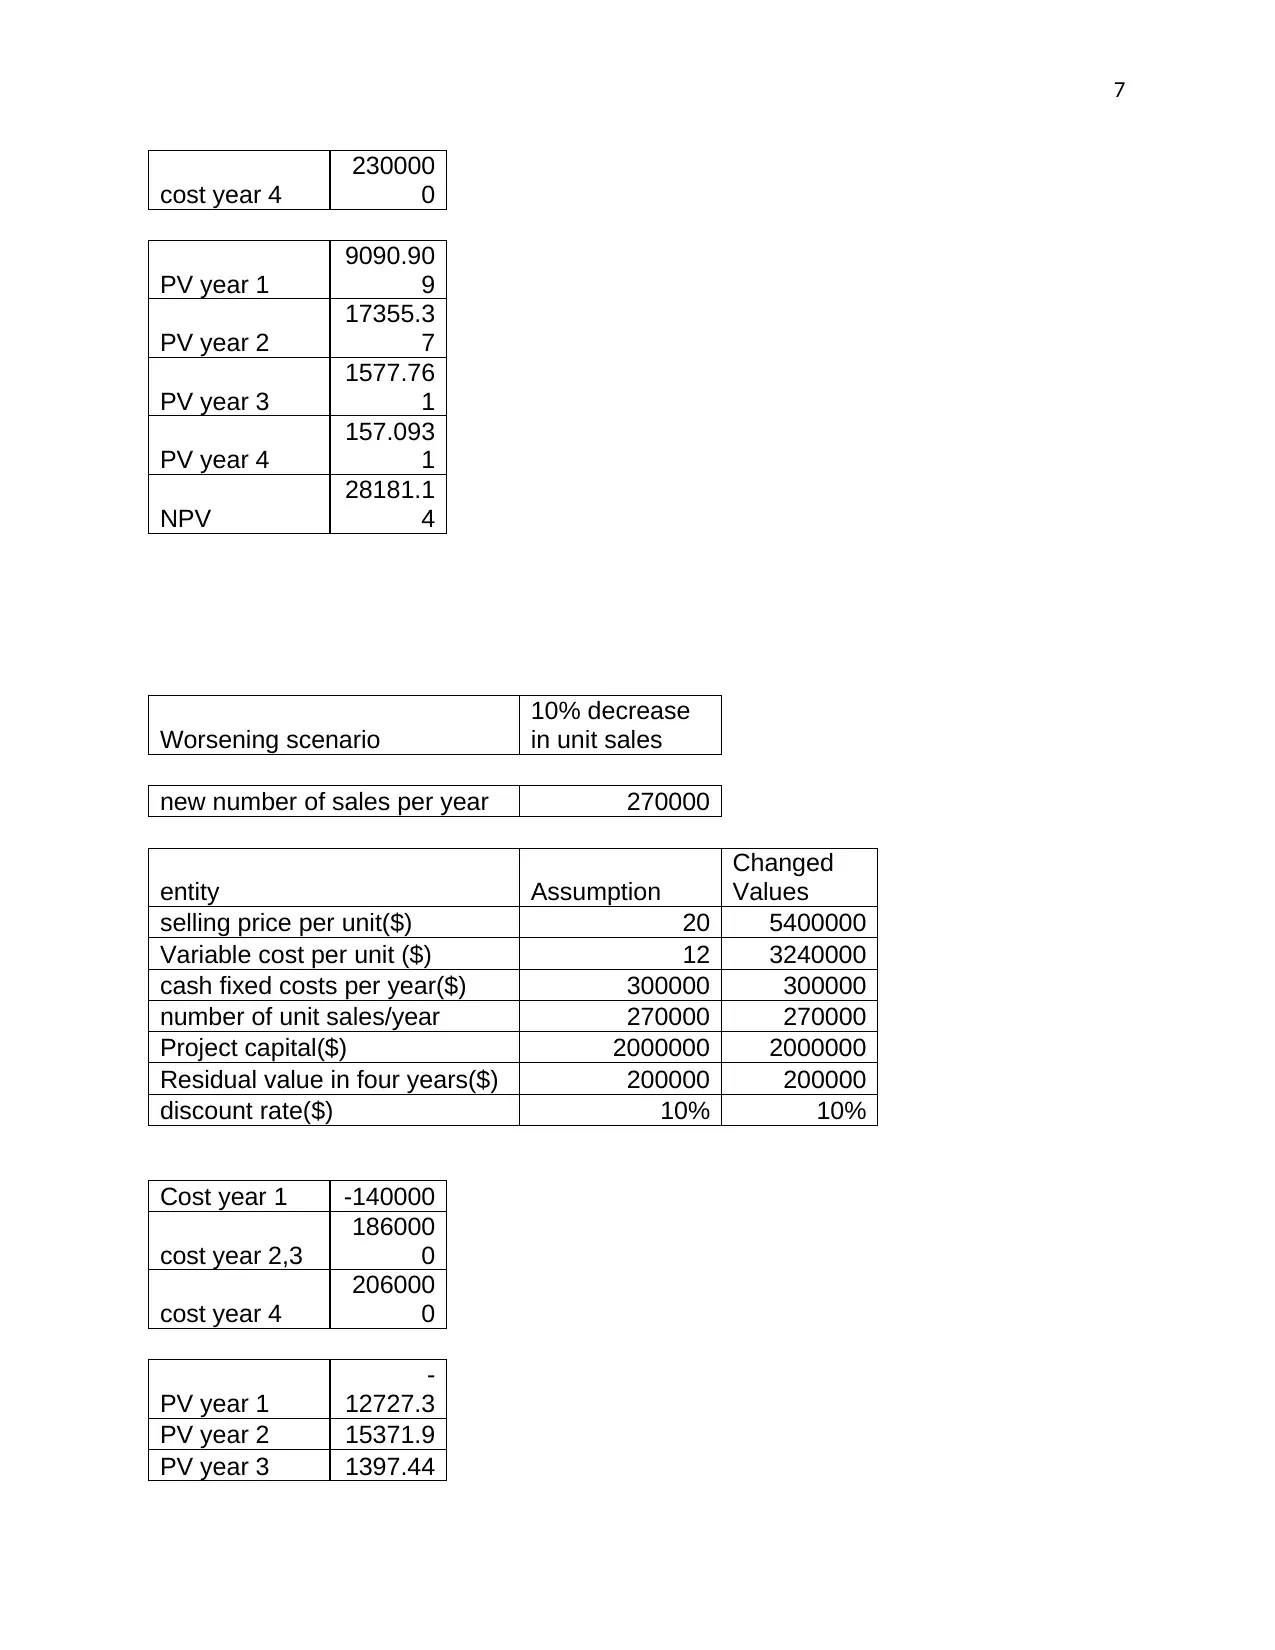
7
cost year 4
230000
0
PV year 1
9090.90
9
PV year 2
17355.3
7
PV year 3
1577.76
1
PV year 4
157.093
1
NPV
28181.1
4
Worsening scenario
10% decrease
in unit sales
new number of sales per year 270000
entity Assumption
Changed
Values
selling price per unit($) 20 5400000
Variable cost per unit ($) 12 3240000
cash fixed costs per year($) 300000 300000
number of unit sales/year 270000 270000
Project capital($) 2000000 2000000
Residual value in four years($) 200000 200000
discount rate($) 10% 10%
Cost year 1 -140000
cost year 2,3
186000
0
cost year 4
206000
0
PV year 1
-
12727.3
PV year 2 15371.9
PV year 3 1397.44
cost year 4
230000
0
PV year 1
9090.90
9
PV year 2
17355.3
7
PV year 3
1577.76
1
PV year 4
157.093
1
NPV
28181.1
4
Worsening scenario
10% decrease
in unit sales
new number of sales per year 270000
entity Assumption
Changed
Values
selling price per unit($) 20 5400000
Variable cost per unit ($) 12 3240000
cash fixed costs per year($) 300000 300000
number of unit sales/year 270000 270000
Project capital($) 2000000 2000000
Residual value in four years($) 200000 200000
discount rate($) 10% 10%
Cost year 1 -140000
cost year 2,3
186000
0
cost year 4
206000
0
PV year 1
-
12727.3
PV year 2 15371.9
PV year 3 1397.44
Paraphrase This Document
Need a fresh take? Get an instant paraphrase of this document with our AI Paraphraser
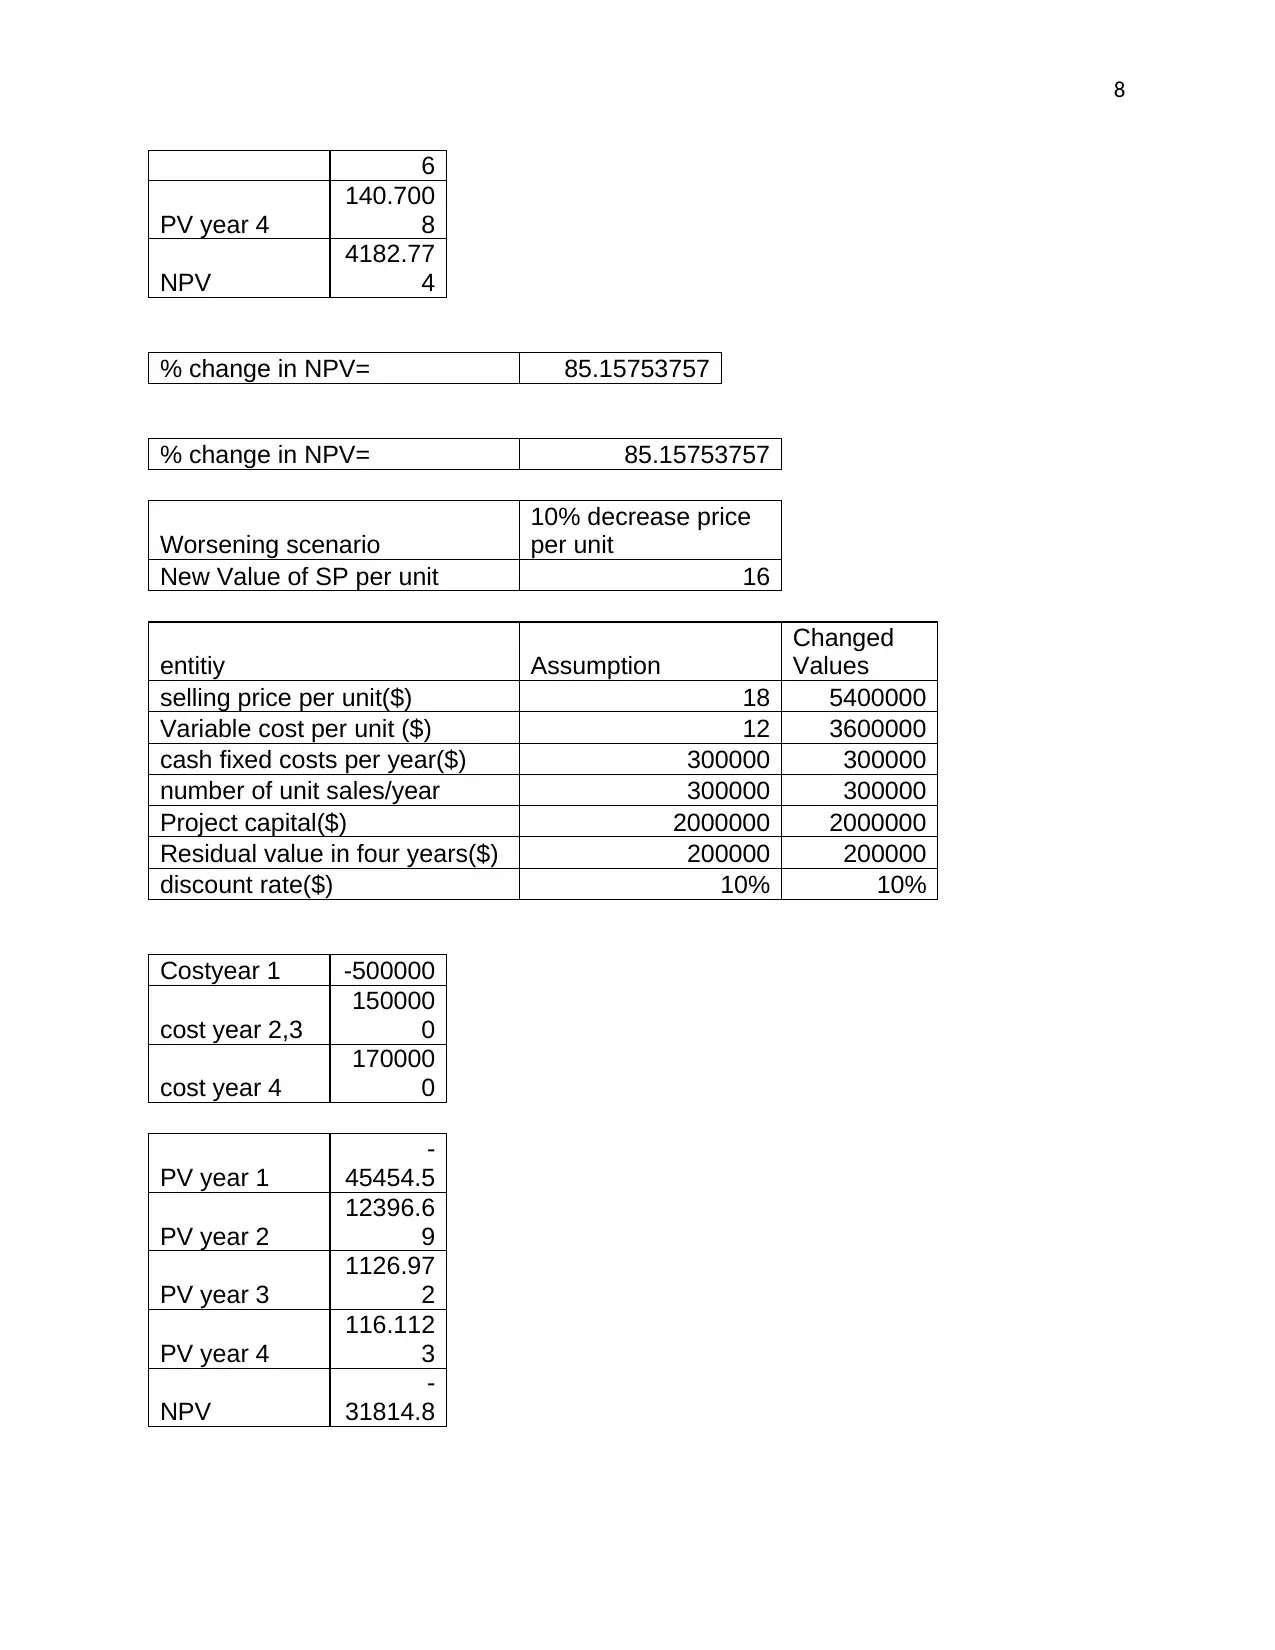
8
6
PV year 4
140.700
8
NPV
4182.77
4
% change in NPV= 85.15753757
% change in NPV= 85.15753757
Worsening scenario
10% decrease price
per unit
New Value of SP per unit 16
entitiy Assumption
Changed
Values
selling price per unit($) 18 5400000
Variable cost per unit ($) 12 3600000
cash fixed costs per year($) 300000 300000
number of unit sales/year 300000 300000
Project capital($) 2000000 2000000
Residual value in four years($) 200000 200000
discount rate($) 10% 10%
Costyear 1 -500000
cost year 2,3
150000
0
cost year 4
170000
0
PV year 1
-
45454.5
PV year 2
12396.6
9
PV year 3
1126.97
2
PV year 4
116.112
3
NPV
-
31814.8
9
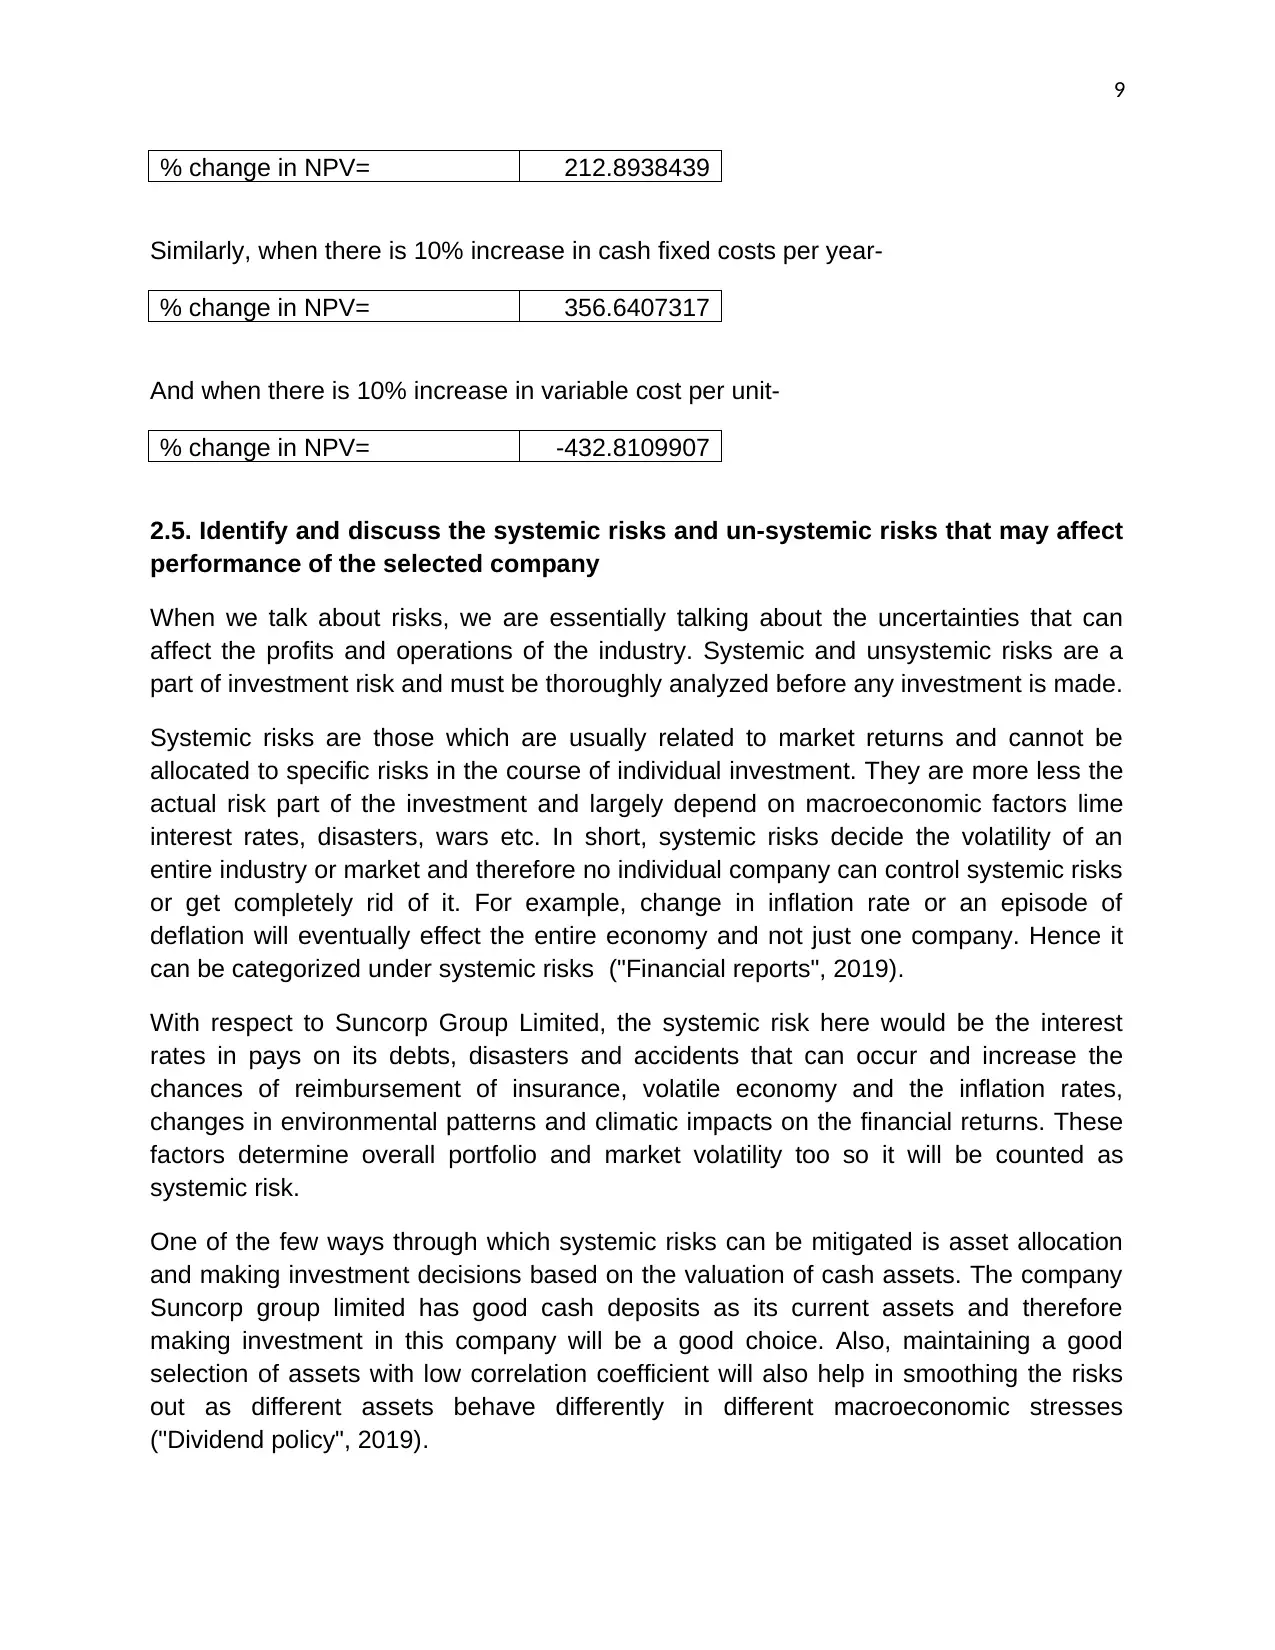
% change in NPV= 212.8938439
Similarly, when there is 10% increase in cash fixed costs per year-
% change in NPV= 356.6407317
And when there is 10% increase in variable cost per unit-
% change in NPV= -432.8109907
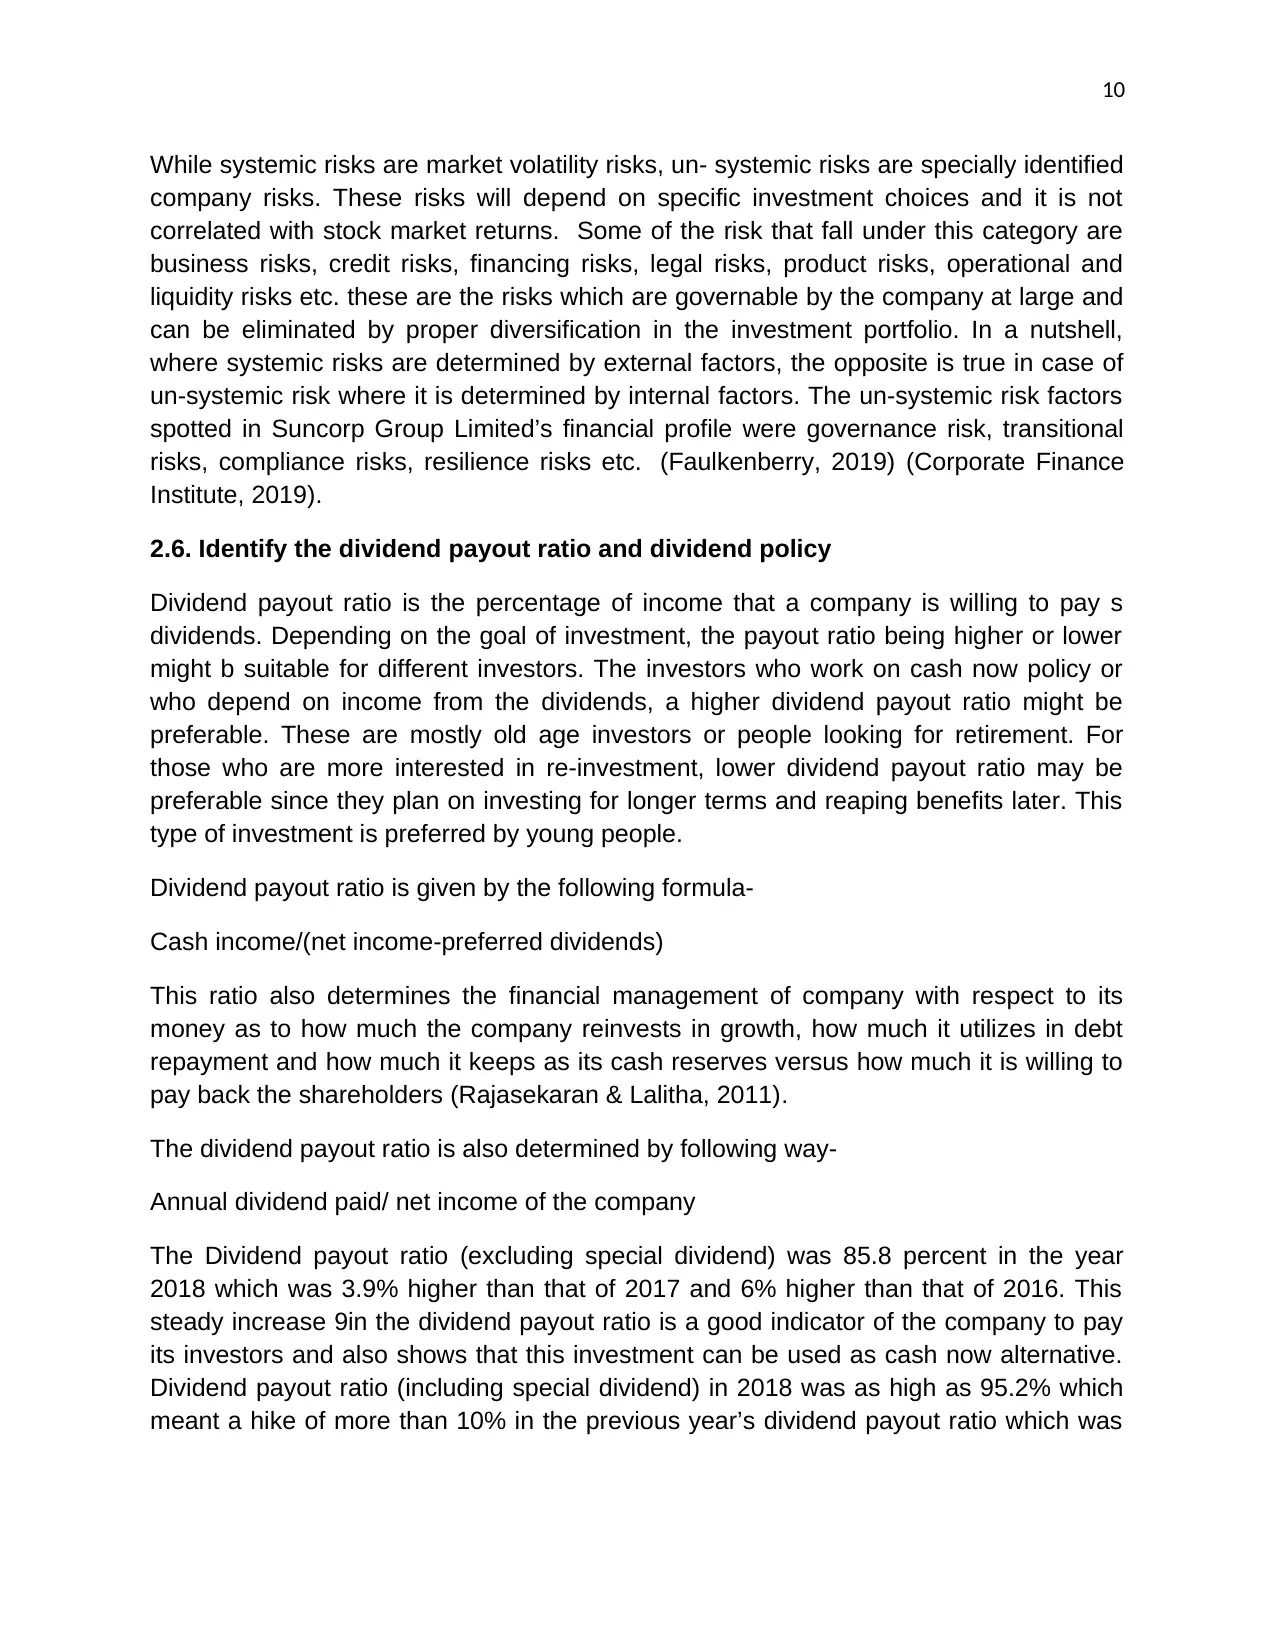
2.5. Identify and discuss the systemic risks and un-systemic risks that may affect
performance of the selected company
When we talk about risks, we are essentially talking about the uncertainties that can
affect the profits and operations of the industry. Systemic and unsystemic risks are a
part of investment risk and must be thoroughly analyzed before any investment is made.
Systemic risks are those which are usually related to market returns and cannot be
allocated to specific risks in the course of individual investment. They are more less the
actual risk part of the investment and largely depend on macroeconomic factors lime
interest rates, disasters, wars etc. In short, systemic risks decide the volatility of an
entire industry or market and therefore no individual company can control systemic risks
or get completely rid of it. For example, change in inflation rate or an episode of
deflation will eventually effect the entire economy and not just one company. Hence it
can be categorized under systemic risks ("Financial reports", 2019).
With respect to Suncorp Group Limited, the systemic risk here would be the interest
rates in pays on its debts, disasters and accidents that can occur and increase the
chances of reimbursement of insurance, volatile economy and the inflation rates,
changes in environmental patterns and climatic impacts on the financial returns. These
factors determine overall portfolio and market volatility too so it will be counted as
systemic risk.
One of the few ways through which systemic risks can be mitigated is asset allocation
and making investment decisions based on the valuation of cash assets. The company
Suncorp group limited has good cash deposits as its current assets and therefore
making investment in this company will be a good choice. Also, maintaining a good
selection of assets with low correlation coefficient will also help in smoothing the risks
out as different assets behave differently in different macroeconomic stresses
("Dividend policy", 2019).
% change in NPV= 212.8938439
Similarly, when there is 10% increase in cash fixed costs per year-
% change in NPV= 356.6407317
And when there is 10% increase in variable cost per unit-
% change in NPV= -432.8109907
2.5. Identify and discuss the systemic risks and un-systemic risks that may affect
performance of the selected company
When we talk about risks, we are essentially talking about the uncertainties that can
affect the profits and operations of the industry. Systemic and unsystemic risks are a
part of investment risk and must be thoroughly analyzed before any investment is made.
Systemic risks are those which are usually related to market returns and cannot be
allocated to specific risks in the course of individual investment. They are more less the
actual risk part of the investment and largely depend on macroeconomic factors lime
interest rates, disasters, wars etc. In short, systemic risks decide the volatility of an
entire industry or market and therefore no individual company can control systemic risks
or get completely rid of it. For example, change in inflation rate or an episode of
deflation will eventually effect the entire economy and not just one company. Hence it
can be categorized under systemic risks ("Financial reports", 2019).
With respect to Suncorp Group Limited, the systemic risk here would be the interest
rates in pays on its debts, disasters and accidents that can occur and increase the
chances of reimbursement of insurance, volatile economy and the inflation rates,
changes in environmental patterns and climatic impacts on the financial returns. These
factors determine overall portfolio and market volatility too so it will be counted as
systemic risk.
One of the few ways through which systemic risks can be mitigated is asset allocation
and making investment decisions based on the valuation of cash assets. The company
Suncorp group limited has good cash deposits as its current assets and therefore
making investment in this company will be a good choice. Also, maintaining a good
selection of assets with low correlation coefficient will also help in smoothing the risks
out as different assets behave differently in different macroeconomic stresses
("Dividend policy", 2019).
⊘ This is a preview!⊘
Do you want full access?
Subscribe today to unlock all pages.
Trusted by 1+ million students worldwide
10
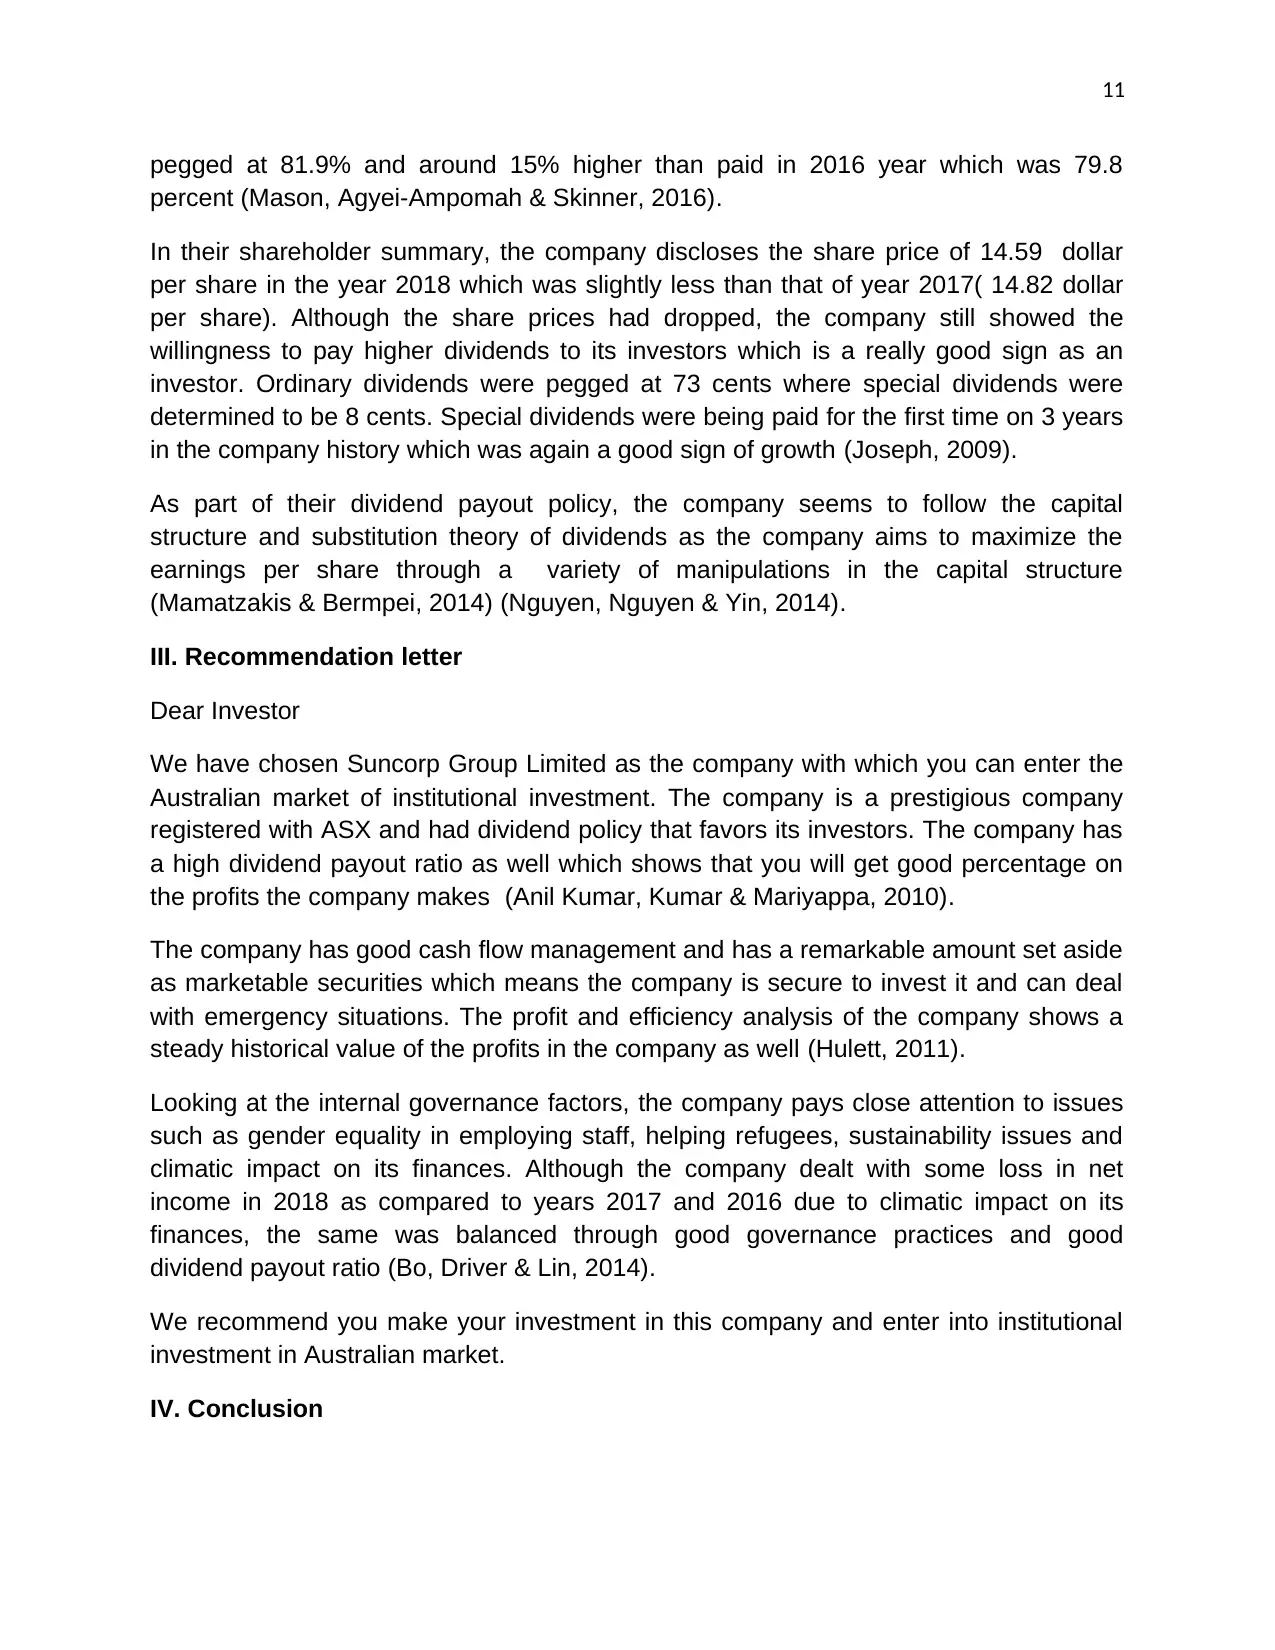
While systemic risks are market volatility risks, un- systemic risks are specially identified
company risks. These risks will depend on specific investment choices and it is not
correlated with stock market returns. Some of the risk that fall under this category are
business risks, credit risks, financing risks, legal risks, product risks, operational and
liquidity risks etc. these are the risks which are governable by the company at large and
can be eliminated by proper diversification in the investment portfolio. In a nutshell,
where systemic risks are determined by external factors, the opposite is true in case of
un-systemic risk where it is determined by internal factors. The un-systemic risk factors
spotted in Suncorp Group Limited’s financial profile were governance risk, transitional
risks, compliance risks, resilience risks etc. (Faulkenberry, 2019) (Corporate Finance
Institute, 2019).
2.6. Identify the dividend payout ratio and dividend policy
Dividend payout ratio is the percentage of income that a company is willing to pay s
dividends. Depending on the goal of investment, the payout ratio being higher or lower
might b suitable for different investors. The investors who work on cash now policy or
who depend on income from the dividends, a higher dividend payout ratio might be
preferable. These are mostly old age investors or people looking for retirement. For
those who are more interested in re-investment, lower dividend payout ratio may be
preferable since they plan on investing for longer terms and reaping benefits later. This
type of investment is preferred by young people.
Dividend payout ratio is given by the following formula-
Cash income/(net income-preferred dividends)
This ratio also determines the financial management of company with respect to its
money as to how much the company reinvests in growth, how much it utilizes in debt
repayment and how much it keeps as its cash reserves versus how much it is willing to
pay back the shareholders (Rajasekaran & Lalitha, 2011).
The dividend payout ratio is also determined by following way-
Annual dividend paid/ net income of the company
The Dividend payout ratio (excluding special dividend) was 85.8 percent in the year
2018 which was 3.9% higher than that of 2017 and 6% higher than that of 2016. This
steady increase 9in the dividend payout ratio is a good indicator of the company to pay
its investors and also shows that this investment can be used as cash now alternative.
Dividend payout ratio (including special dividend) in 2018 was as high as 95.2% which
meant a hike of more than 10% in the previous year’s dividend payout ratio which was
Paraphrase This Document
Need a fresh take? Get an instant paraphrase of this document with our AI Paraphraser
11
pegged at 81.9% and around 15% higher than paid in 2016 year which was 79.8
percent (Mason, Agyei-Ampomah & Skinner, 2016).
In their shareholder summary, the company discloses the share price of 14.59 dollar
per share in the year 2018 which was slightly less than that of year 2017( 14.82 dollar
per share). Although the share prices had dropped, the company still showed the
willingness to pay higher dividends to its investors which is a really good sign as an
investor. Ordinary dividends were pegged at 73 cents where special dividends were
determined to be 8 cents. Special dividends were being paid for the first time on 3 years
in the company history which was again a good sign of growth (Joseph, 2009).
As part of their dividend payout policy, the company seems to follow the capital
structure and substitution theory of dividends as the company aims to maximize the
earnings per share through a variety of manipulations in the capital structure
(Mamatzakis & Bermpei, 2014) (Nguyen, Nguyen & Yin, 2014).
III. Recommendation letter
Dear Investor
We have chosen Suncorp Group Limited as the company with which you can enter the
Australian market of institutional investment. The company is a prestigious company
registered with ASX and had dividend policy that favors its investors. The company has
a high dividend payout ratio as well which shows that you will get good percentage on
the profits the company makes (Anil Kumar, Kumar & Mariyappa, 2010).
The company has good cash flow management and has a remarkable amount set aside
as marketable securities which means the company is secure to invest it and can deal
with emergency situations. The profit and efficiency analysis of the company shows a
steady historical value of the profits in the company as well (Hulett, 2011).
Looking at the internal governance factors, the company pays close attention to issues
such as gender equality in employing staff, helping refugees, sustainability issues and
climatic impact on its finances. Although the company dealt with some loss in net
income in 2018 as compared to years 2017 and 2016 due to climatic impact on its
finances, the same was balanced through good governance practices and good
dividend payout ratio (Bo, Driver & Lin, 2014).
We recommend you make your investment in this company and enter into institutional
investment in Australian market.
IV. Conclusion
12
Suncorp Group Limited is a publicly registered company and it is based off in Australia.
The head office lies in Brisbane. Suncorp is primarily involved in banking and insurance
along with additional services of wealth management. We analysed the portfolio of
Sunvcorp Group Limited and identified that Suncorp Group limited is a good company to
invest into and can act as a good entry point in the market for investors interested in
entering into Australian markets. For maximum security, since the company deals with
systemic and un-systemic risks too, it would be beneficial if the client could diversify
their investment portfolio and not invest in just one single company. This will ensure that
your returns are positive even though the returns of some companies might be negative
(Annual review 2018, 2019).
References
Anil Kumar, S., Kumar, V., & Mariyappa, B. (2010). Corporate accounting. Mumbai
[India]: Himalaya Pub. House.
Annual review 2018. (2019). Retrieved from
https://www.suncorpgroup.com.au/uploads/FY18-Annual-Review.pdf
Bo, H., Driver, C., & Lin, H. (2014). Corporate investment during the financial crisis:
Evidence from China. International Review Of Financial Analysis, 35, 1-12. doi:
10.1016/j.irfa.2014.07.002
Corporate Finance Institute. (2019). Operating Profit Margin - Learn to Calculate
Operating Profit Margin. Retrieved from
https://corporatefinanceinstitute.com/resources/knowledge/finance/operating-profit-
margin/
Dividend policy. (2019). Retrieved from https://en.wikipedia.org/wiki/Dividend_policy
Faulkenberry, K. (2019). Systematic Risk, Unsystematic Risk, Probability, and Expected
Value - Arbor Asset Allocation Model Portfolio (AAAMP) Value Blog. Retrieved from
http://www.arborinvestmentplanner.com/systematic-and-unsystematic-risk-
probability-and-expected-value-4/
Financial reports. (2019). Retrieved from
https://www.suncorpgroup.com.au/investors/reports?
FY 2015-16 report. (2019). Retrieved from
https://www.suncorpgroup.com.au/uploads/fm/AGM%202016/2015-16%20Annual
%20Review.pdf
FY 2017 Sungroup. (2019). Retrieved from
https://www.suncorpgroup.com.au/uploads/pdf/reports/FY17%20Directors
%20Report%20and%20Consolidated%20Financial%20Report.pdf
⊘ This is a preview!⊘
Do you want full access?
Subscribe today to unlock all pages.
Trusted by 1+ million students worldwide
1 out of 13
Related Documents


Your All-in-One AI-Powered Toolkit for Academic Success.
+13062052269
info@desklib.com
Available 24*7 on WhatsApp / Email
![[object Object]](/_next/static/media/star-bottom.7253800d.svg)
Unlock your academic potential
Copyright © 2020–2026 A2Z Services. All Rights Reserved. Developed and managed by ZUCOL.