Financial Resources Analysis Report for Swipe Wire Production Company
VerifiedAdded on 2021/02/19
|13
|3204
|117
Report
AI Summary
This report provides a financial analysis of Swipe Wire, a small production company planning for expansion. It explores management and financial accounting techniques, comparing their differences and respective users. The report utilizes capital budgeting techniques like NPV, ARR, and IRR to evaluate investment options and calculate various financial ratios to assess the company's performance. Recommendations are made regarding the utilization of external funding sources to improve the debt ratio. The analysis includes a cost-benefit analysis, payback period calculation, accounting rate of return, net present value, and internal rate of return for different projects. Finally, the report calculates and compares financial ratios, offering suggestions for improvement and concluding with a recommendation for the most beneficial project for Swipe Wire. This analysis helps in making informed investment decisions and understanding the financial health of the company.

Financial Resources
Paraphrase This Document
Need a fresh take? Get an instant paraphrase of this document with our AI Paraphraser
EXECUTIVE SUMMARY
The following report is based upon a small production company Swipe Wire which is
planning for expansion. For the purpose of analysis management and financial accounting
techniques with their difference and respective users are discussed in this project. With the help
of different capital budgeting techniques such as NPV, ARR, IRR etc. the organisation can make
investment in best option. In order to evaluate performance of the company different ratios are
calculated in present report. The enterprise is recommended to formulate strategies for utilising
external sources more than internal funds for business execution so that debt ratio could be
increased.
Table of Contents
EXECUTIVE SUMMARY.............................................................................................................2
INTRODUCTION...........................................................................................................................1
QUESTION 1...................................................................................................................................1
Explanation of management and financial accounting................................................................1
Difference between management and financial accounting with respective users......................1
QUESTION2....................................................................................................................................2
Cost benefit analysis....................................................................................................................2
Payback period.............................................................................................................................3
Accounting rate of return.............................................................................................................4
Net present value and internal rate of return................................................................................5
Analysis and conclusion..............................................................................................................6
QUESTION 3...................................................................................................................................7
Calculation of ratios.....................................................................................................................7
Comparison of ratios....................................................................................................................8
Suggestions for improvement......................................................................................................9
CONCLUSION................................................................................................................................9
REFRENCES.................................................................................................................................10
⊘ This is a preview!⊘
Do you want full access?
Subscribe today to unlock all pages.
Trusted by 1+ million students worldwide
INTRODUCTION
Financial resources can be defined as the funds which are required by all the
organisations to execute all the operational activities in systematic manner. If an enterprise is not
having sufficient finance to conduct business processes then it will be difficult for it to reach
predetermined organisation (Anselmi, Lagarde and Hanson, 2014). This report is based upon the
entity Swipe Wire which is a small production company and set up by James. Currently the
organisation is planning for expansion and incorporation of the business. This assignment covers
various topics such as management and financial accounting, their functions, respective user,
differences, calculation of payback period, NPV, IRR, ARR etc. Along with this, in order to
determine performance of the business different ratios are also calculated.
QUESTION 1
Explanation of management and financial accounting
Management accounting: It can be defined as the process of monitoring, analysing,
evaluating and controlling organisational processes so that strategic decisions could be
formulated according to actual situation of business. Main purpose of it is to determine that the
operational activities which were performed by company in a specific time period are resulting
positively or negatively. In Swipe Wire it is conducted every year to determine that the plan
which were formulated are being executed properly or not. It's primary function is to assist
managing officials in planning, controlling, organising and decision-making.
Financial accounting: The process which is followed by business entities to formulate
final accounts such as income statement, balance sheet and cash flow statement is known as
financial accounting. It helps to analyse that organisation is able to meet the finance related
objectives or not. Financial analyst of Swipe Wire focuses on it to evaluate financial status of the
company and formulate strategic decisions for future (Guerra, Magni and Stefanini, 2014). It's
core function is recording, summarising, classifying, communicating and interpreting financial
data.
Difference between management and financial accounting with respective users
Difference between financial and management accounting:
Basis Management accounting Financial accounting
1
Paraphrase This Document
Need a fresh take? Get an instant paraphrase of this document with our AI Paraphraser
Definition The process which is followed by
managers to evaluate and control
organisational performance is known as
management accounting.
It is the technique which is focused by
accounting professionals for the
purpose of analysing financial status
of business.
Compulsion For all the organisations it is not
necessary to conduct management
accounting every year.
It is vital for all business entities to
formulate final accounts every year so
that profitability, liquidity and other
aspects could be monitored.
Format There is no set format for management
accounting which is required to be
followed by companies while
generating reports of it.
While generating financial statements
accounting professionals are required
to make sure that they follow a
specific format for financial
accounting.
Auditing For business entities it is not important
to conduct auditing for management
reports.
For all the companies it is vital to
make sure that all the financial
statements gets audited every year.
Users All the external stakeholders are the
users of financial accounting because
they analyse all the final accounts for
the purpose of making strategic
decisions. These are investors,
customers, creditors, suppliers,
government etc. They evaluate financial
statements to make judgements such as
making investment, providing credit,
buying products, supplying material
and organisation is performing
operations under law or not.
The internal stakeholders such as
employees, managers, shareholders
etc. are users of management
accounting. Shareholders by using
information generated from
management accounting processes and
methods ensures about a potential
return from company's securities and
to know about how well the company
is operating in the market. All the
reports under this technique are
analysed by them for different
purposes. These are checking actual
situation of business, formulating
2
strategic decisions for future and
making sure that they are a part of a
profitable company (Hasan and Habib,
2017)
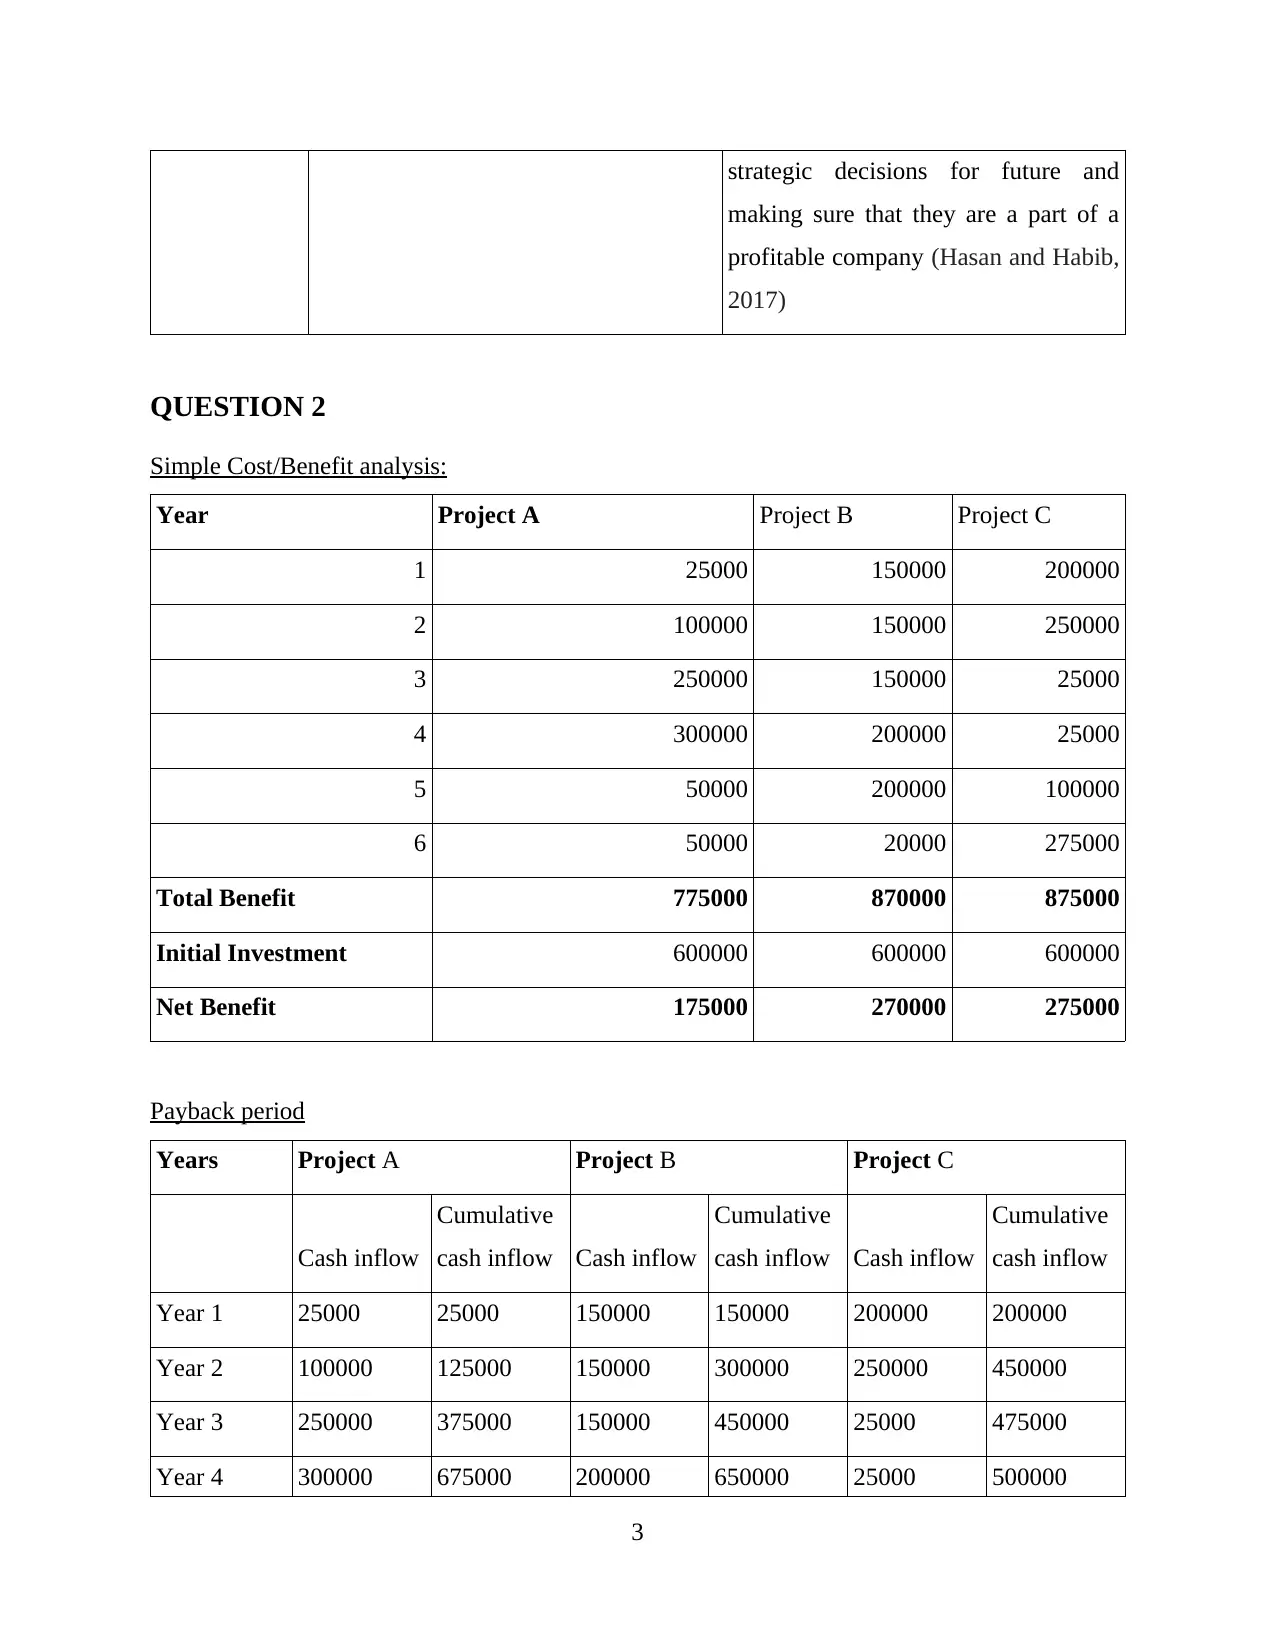
QUESTION 2
Simple Cost/Benefit analysis:
Year Project A Project B Project C
1 25000 150000 200000
2 100000 150000 250000
3 250000 150000 25000
4 300000 200000 25000
5 50000 200000 100000
6 50000 20000 275000
Total Benefit 775000 870000 875000
Initial Investment 600000 600000 600000
Net Benefit 175000 270000 275000
Payback period
Years Project A Project B Project C
Cash inflow
Cumulative
cash inflow Cash inflow
Cumulative
cash inflow Cash inflow
Cumulative
cash inflow
Year 1 25000 25000 150000 150000 200000 200000
Year 2 100000 125000 150000 300000 250000 450000
Year 3 250000 375000 150000 450000 25000 475000
Year 4 300000 675000 200000 650000 25000 500000
3
making sure that they are a part of a
profitable company (Hasan and Habib,
2017)
QUESTION 2
Simple Cost/Benefit analysis:
Year Project A Project B Project C
1 25000 150000 200000
2 100000 150000 250000
3 250000 150000 25000
4 300000 200000 25000
5 50000 200000 100000
6 50000 20000 275000
Total Benefit 775000 870000 875000
Initial Investment 600000 600000 600000
Net Benefit 175000 270000 275000
Payback period
Years Project A Project B Project C
Cash inflow
Cumulative
cash inflow Cash inflow
Cumulative
cash inflow Cash inflow
Cumulative
cash inflow
Year 1 25000 25000 150000 150000 200000 200000
Year 2 100000 125000 150000 300000 250000 450000
Year 3 250000 375000 150000 450000 25000 475000
Year 4 300000 675000 200000 650000 25000 500000
3
⊘ This is a preview!⊘
Do you want full access?
Subscribe today to unlock all pages.
Trusted by 1+ million students worldwide
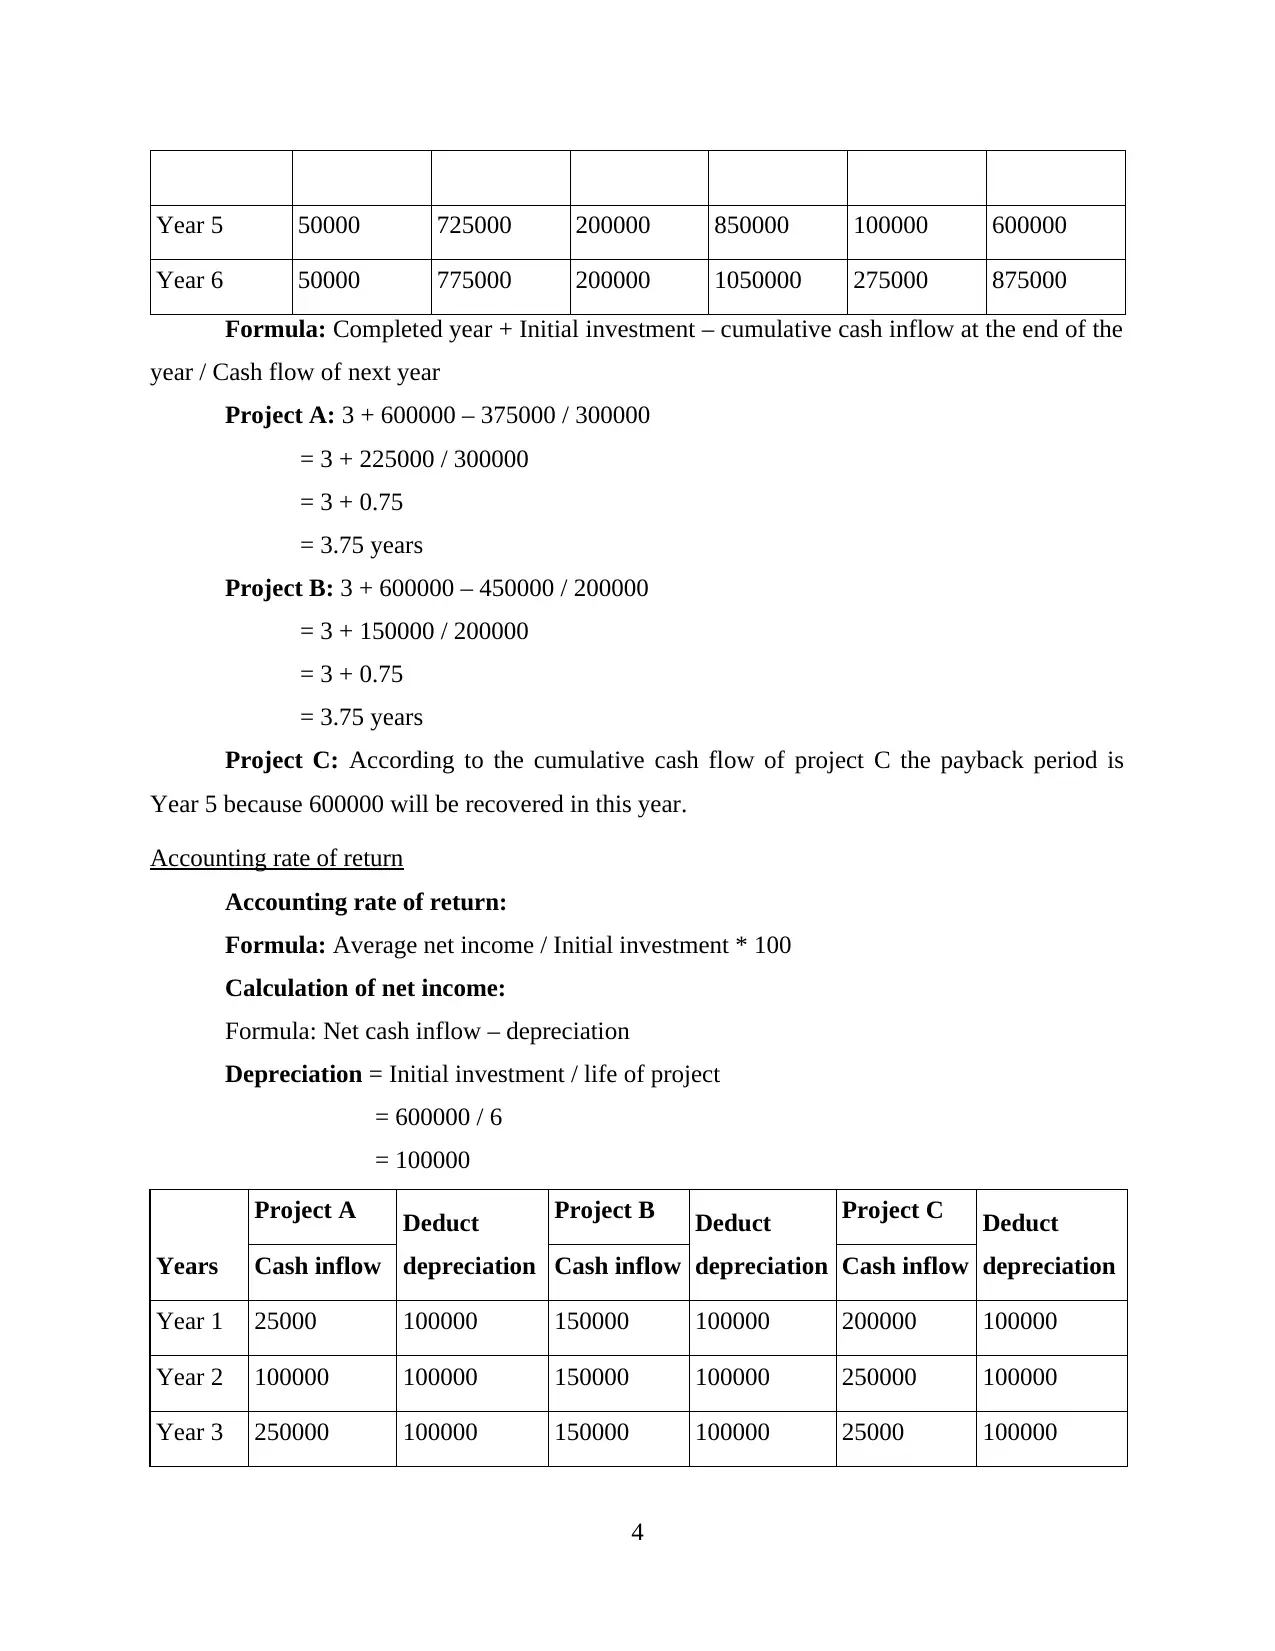
Year 5 50000 725000 200000 850000 100000 600000
Year 6 50000 775000 200000 1050000 275000 875000
Formula: Completed year + Initial investment – cumulative cash inflow at the end of the
year / Cash flow of next year
Project A: 3 + 600000 – 375000 / 300000
= 3 + 225000 / 300000
= 3 + 0.75
= 3.75 years
Project B: 3 + 600000 – 450000 / 200000
= 3 + 150000 / 200000
= 3 + 0.75
= 3.75 years
Project C: According to the cumulative cash flow of project C the payback period is
Year 5 because 600000 will be recovered in this year.
Accounting rate of return
Accounting rate of return:
Formula: Average net income / Initial investment * 100
Calculation of net income:
Formula: Net cash inflow – depreciation
Depreciation = Initial investment / life of project
= 600000 / 6
= 100000
Years
Project A Deduct
depreciation
Project B Deduct
depreciation
Project C Deduct
depreciationCash inflow Cash inflow Cash inflow
Year 1 25000 100000 150000 100000 200000 100000
Year 2 100000 100000 150000 100000 250000 100000
Year 3 250000 100000 150000 100000 25000 100000
4
Paraphrase This Document
Need a fresh take? Get an instant paraphrase of this document with our AI Paraphraser
Year 4 300000 100000 200000 100000 25000 100000
Year 5 50000 100000 200000 100000 100000 100000
Year 6 50000 100000 200000 100000 275000 100000
Net income:
Years Project A Project B Project C
Year 1 -75000 50000 100000
Year 2 0 50000 150000
Year 3 150000 50000 -75000
Year 4 200000 100000 -75000
Year 5 -50000 100000 0
Year 6 -50000 100000 175000
Calculation of average net income:
Project A: Average Income = (-75000) + 0 + 150000 + 200000 + (-50000) + (-50000)
= 175000
= 29167
ARR = 29167 / 600000 *100
= 0.0486 * 100
= 4.86%
Project B: Average Income = 50000 + 50000 + 50000 + 100000 + 100000 + 100000
= 450000 / 6
= 75000
ARR = 75000 / 600000 *100
= 0.125 * 100
= 12.5%
Project C: Average Income = 100000 + 150000 + (-75000) + (-75000) + 0 +175000
= 275000 / 6
= 45833
5
ARR = 45833 / 600000 * 100
= 0.0764 * 100
= 7.64%
Net present value and internal rate of return
Net present value:
Formula = Total cash inflow – Initial investment
Step 1:
Years PV @ 10%
Cash Inflow
Project A Project B Project C
Year 1 0.909 25000 150000 200000
Year 2 0.826 100000 150000 250000
Year 3 0.751 250000 150000 25000
Year 4 0.683 300000 200000 25000
Year 5 0.621 50000 200000 100000
Year 6 0.564 50000 200000 275000
Step 2:
Years
Discounted Cash Inflow
Project A Project B Project C
Year 1 22725 136350 181800
Year 2 82600 123900 206500
Year 3 187750 112650 18775
Year 4 204900 136600 17075
Year 5 31050 124200 62100
Year 6 28200 112800 155100
6
⊘ This is a preview!⊘
Do you want full access?
Subscribe today to unlock all pages.
Trusted by 1+ million students worldwide
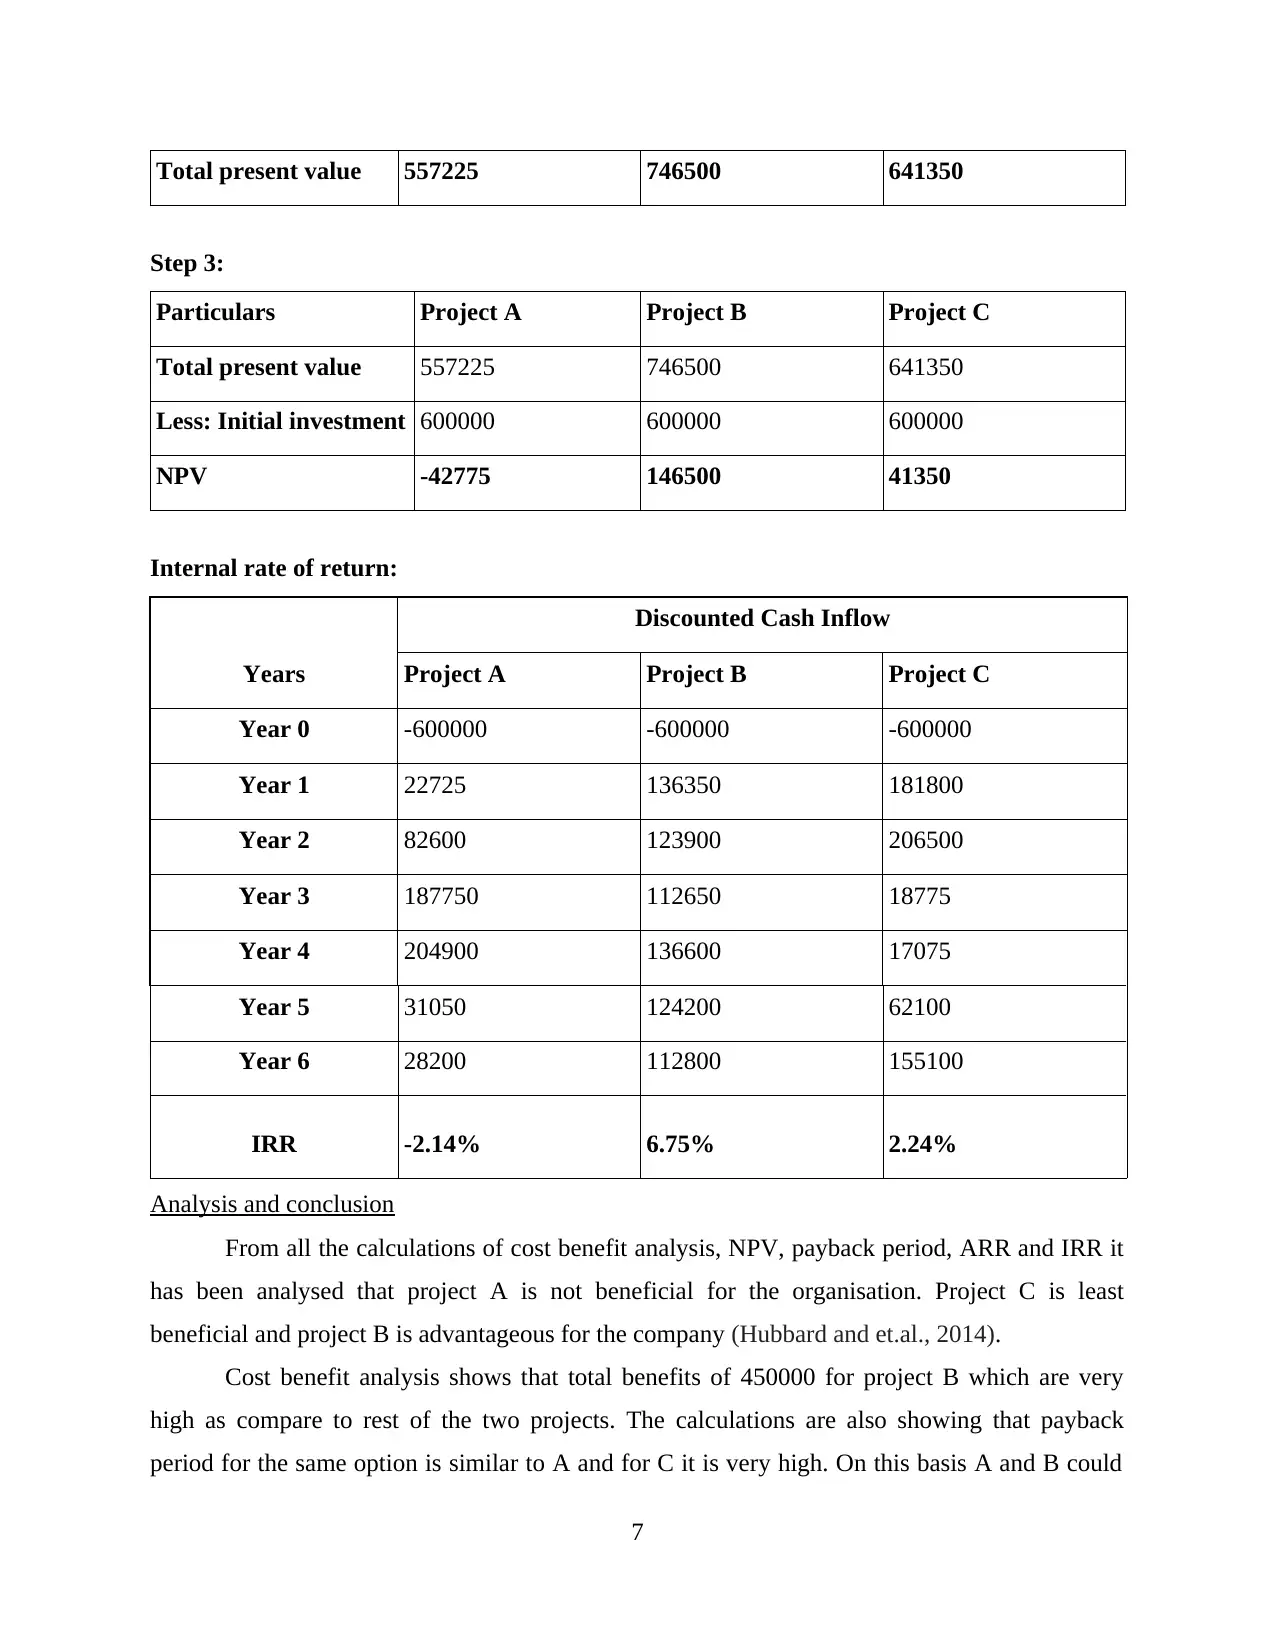
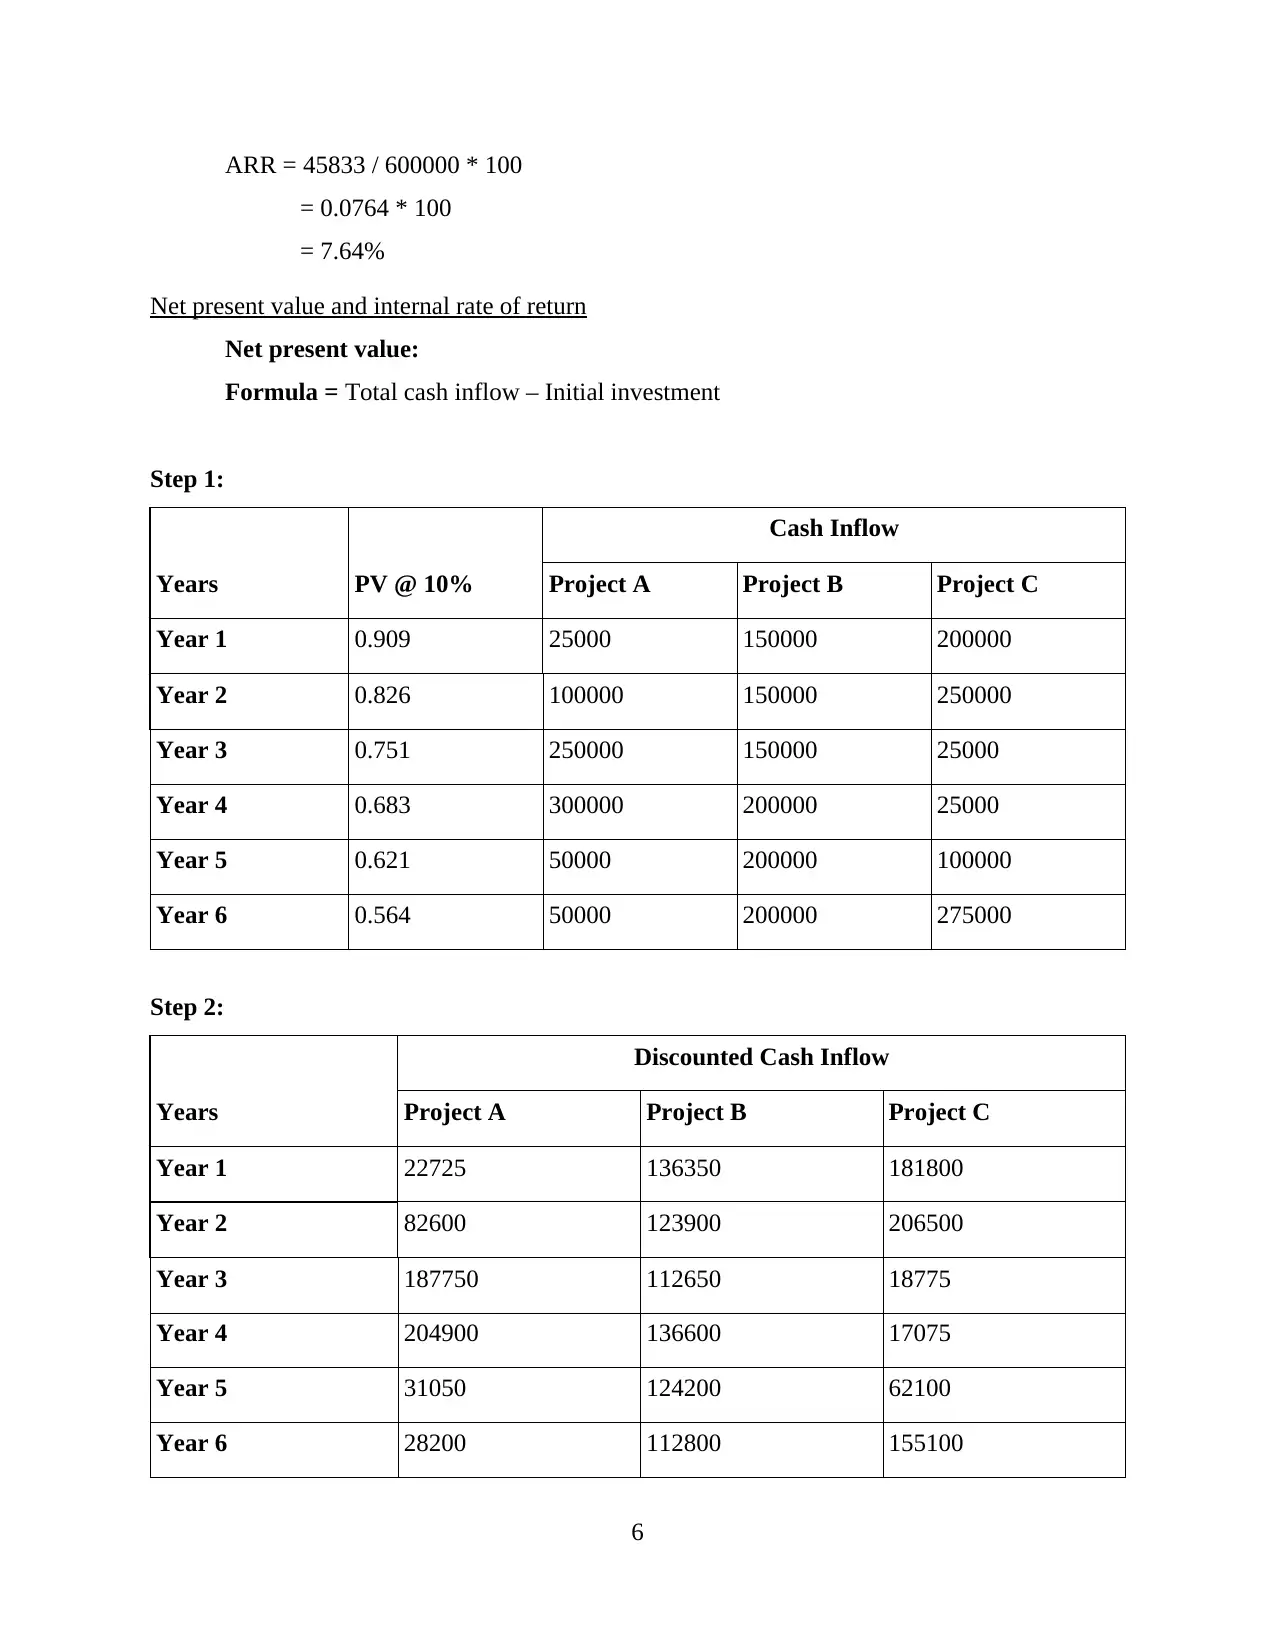
Total present value 557225 746500 641350
Step 3:
Particulars Project A Project B Project C
Total present value 557225 746500 641350
Less: Initial investment 600000 600000 600000
NPV -42775 146500 41350
Internal rate of return:
Years
Discounted Cash Inflow
Project A Project B Project C
Year 0 -600000 -600000 -600000
Year 1 22725 136350 181800
Year 2 82600 123900 206500
Year 3 187750 112650 18775
Year 4 204900 136600 17075
Year 5 31050 124200 62100
Year 6 28200 112800 155100
IRR -2.14% 6.75% 2.24%
Analysis and conclusion
From all the calculations of cost benefit analysis, NPV, payback period, ARR and IRR it
has been analysed that project A is not beneficial for the organisation. Project C is least
beneficial and project B is advantageous for the company (Hubbard and et.al., 2014).
Cost benefit analysis shows that total benefits of 450000 for project B which are very
high as compare to rest of the two projects. The calculations are also showing that payback
period for the same option is similar to A and for C it is very high. On this basis A and B could
7
Paraphrase This Document
Need a fresh take? Get an instant paraphrase of this document with our AI Paraphraser
be selected for recovering the investment in a short period. The calculations of accounting rate of
return are showing that the ARR for A, B and C are 4.86%, 12.5% and 7.64% respectively. From
all of them the rate for project B is very high and if investment is made in this project then it will
provide higher returns to the business.
Net present value shows current market value of a project which helps business entities to
select best suitable option to make investment. From the calculations of it, it has been assessed
that project B is having highest NPV as compare to other projects. By making investment in this
project the organisation will be able to attain success. Internal rate of returns for all the projects
are -2.14%, 6.75% and 2.24%. The highest IRR shows higher returns from project in which
investment is made (FKarltorp, 2016).
From the above analysis it has been concluded that by from all the tree project the most
beneficial option for Swipe Wire is project B because in all the calculations it has been identified
that it is the best suitable alternative for the business. On the basis of the analysis it has been
advised to the management that project B should be adopted by the company.
QUESTION 3
Calculation of ratios
Ratio Formula Particulars 2017 2018
Gross profit
margin
Gross profit /
net sales *100
Gross profit 250000 280000
Net sales 650000 700000
Gross profit margin ratio 38.46 40
Net profit
margin ratio
Net profit / net
sales *100
Net profit 30000 45000
Net sales 650000 700000
Net profit ratio 4.62 6.43
Mark up
ratio
(Sales – Cost of
good sold)/ cost
Sales – Cost of good sold 250000 280000
Cost of goods sold 400000 420000
8
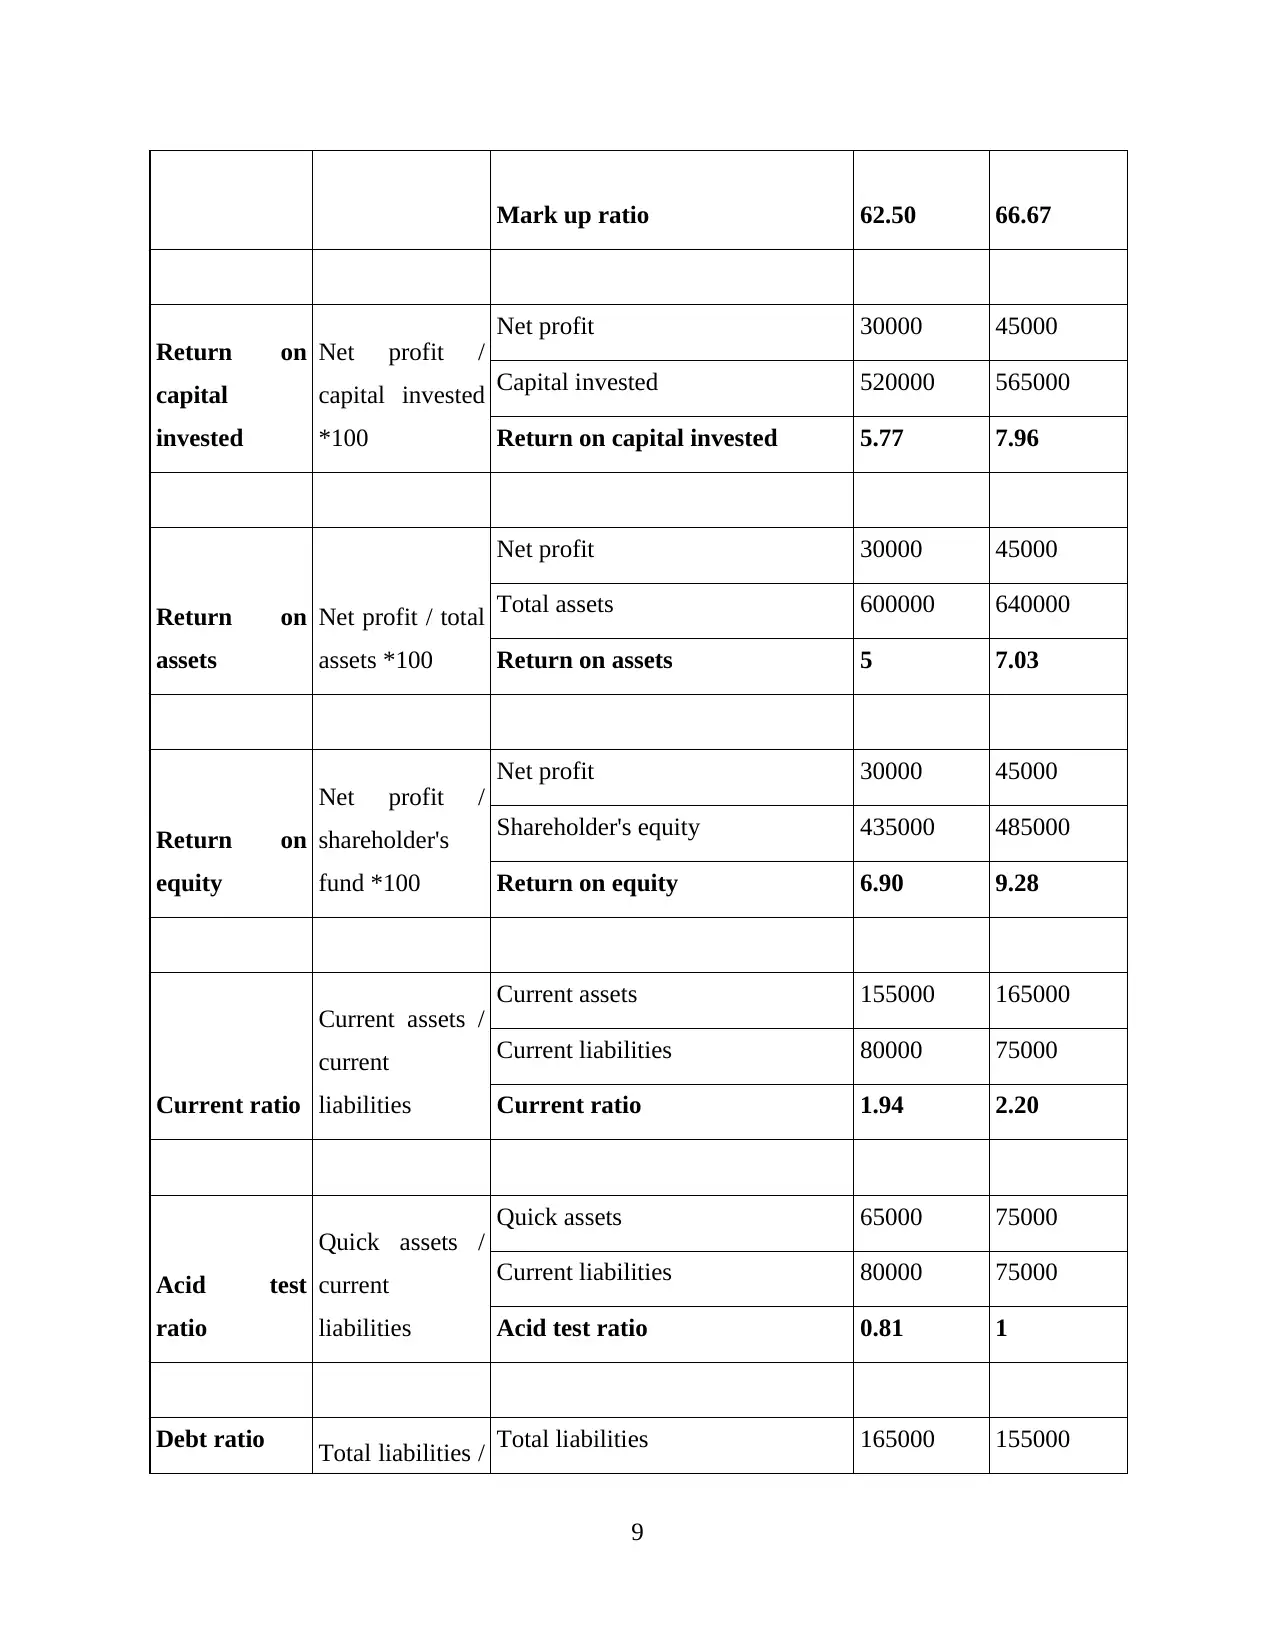
Mark up ratio 62.50 66.67
Return on
capital
invested
Net profit /
capital invested
*100
Net profit 30000 45000
Capital invested 520000 565000
Return on capital invested 5.77 7.96
Return on
assets
Net profit / total
assets *100
Net profit 30000 45000
Total assets 600000 640000
Return on assets 5 7.03
Return on
equity
Net profit /
shareholder's
fund *100
Net profit 30000 45000
Shareholder's equity 435000 485000
Return on equity 6.90 9.28
Current ratio
Current assets /
current
liabilities
Current assets 155000 165000
Current liabilities 80000 75000
Current ratio 1.94 2.20
Acid test
ratio
Quick assets /
current
liabilities
Quick assets 65000 75000
Current liabilities 80000 75000
Acid test ratio 0.81 1
Debt ratio Total liabilities / Total liabilities 165000 155000
9
Return on
capital
invested
Net profit /
capital invested
*100
Net profit 30000 45000
Capital invested 520000 565000
Return on capital invested 5.77 7.96
Return on
assets
Net profit / total
assets *100
Net profit 30000 45000
Total assets 600000 640000
Return on assets 5 7.03
Return on
equity
Net profit /
shareholder's
fund *100
Net profit 30000 45000
Shareholder's equity 435000 485000
Return on equity 6.90 9.28
Current ratio
Current assets /
current
liabilities
Current assets 155000 165000
Current liabilities 80000 75000
Current ratio 1.94 2.20
Acid test
ratio
Quick assets /
current
liabilities
Quick assets 65000 75000
Current liabilities 80000 75000
Acid test ratio 0.81 1
Debt ratio Total liabilities / Total liabilities 165000 155000
9
⊘ This is a preview!⊘
Do you want full access?
Subscribe today to unlock all pages.
Trusted by 1+ million students worldwide
1 out of 13
Related Documents


Your All-in-One AI-Powered Toolkit for Academic Success.
+13062052269
info@desklib.com
Available 24*7 on WhatsApp / Email
![[object Object]](/_next/static/media/star-bottom.7253800d.svg)
Unlock your academic potential
Copyright © 2020–2026 A2Z Services. All Rights Reserved. Developed and managed by ZUCOL.