Financial Performance Report: An Investment Analysis of T plc
VerifiedAdded on 2023/06/18
|7
|1547
|212
Report
AI Summary
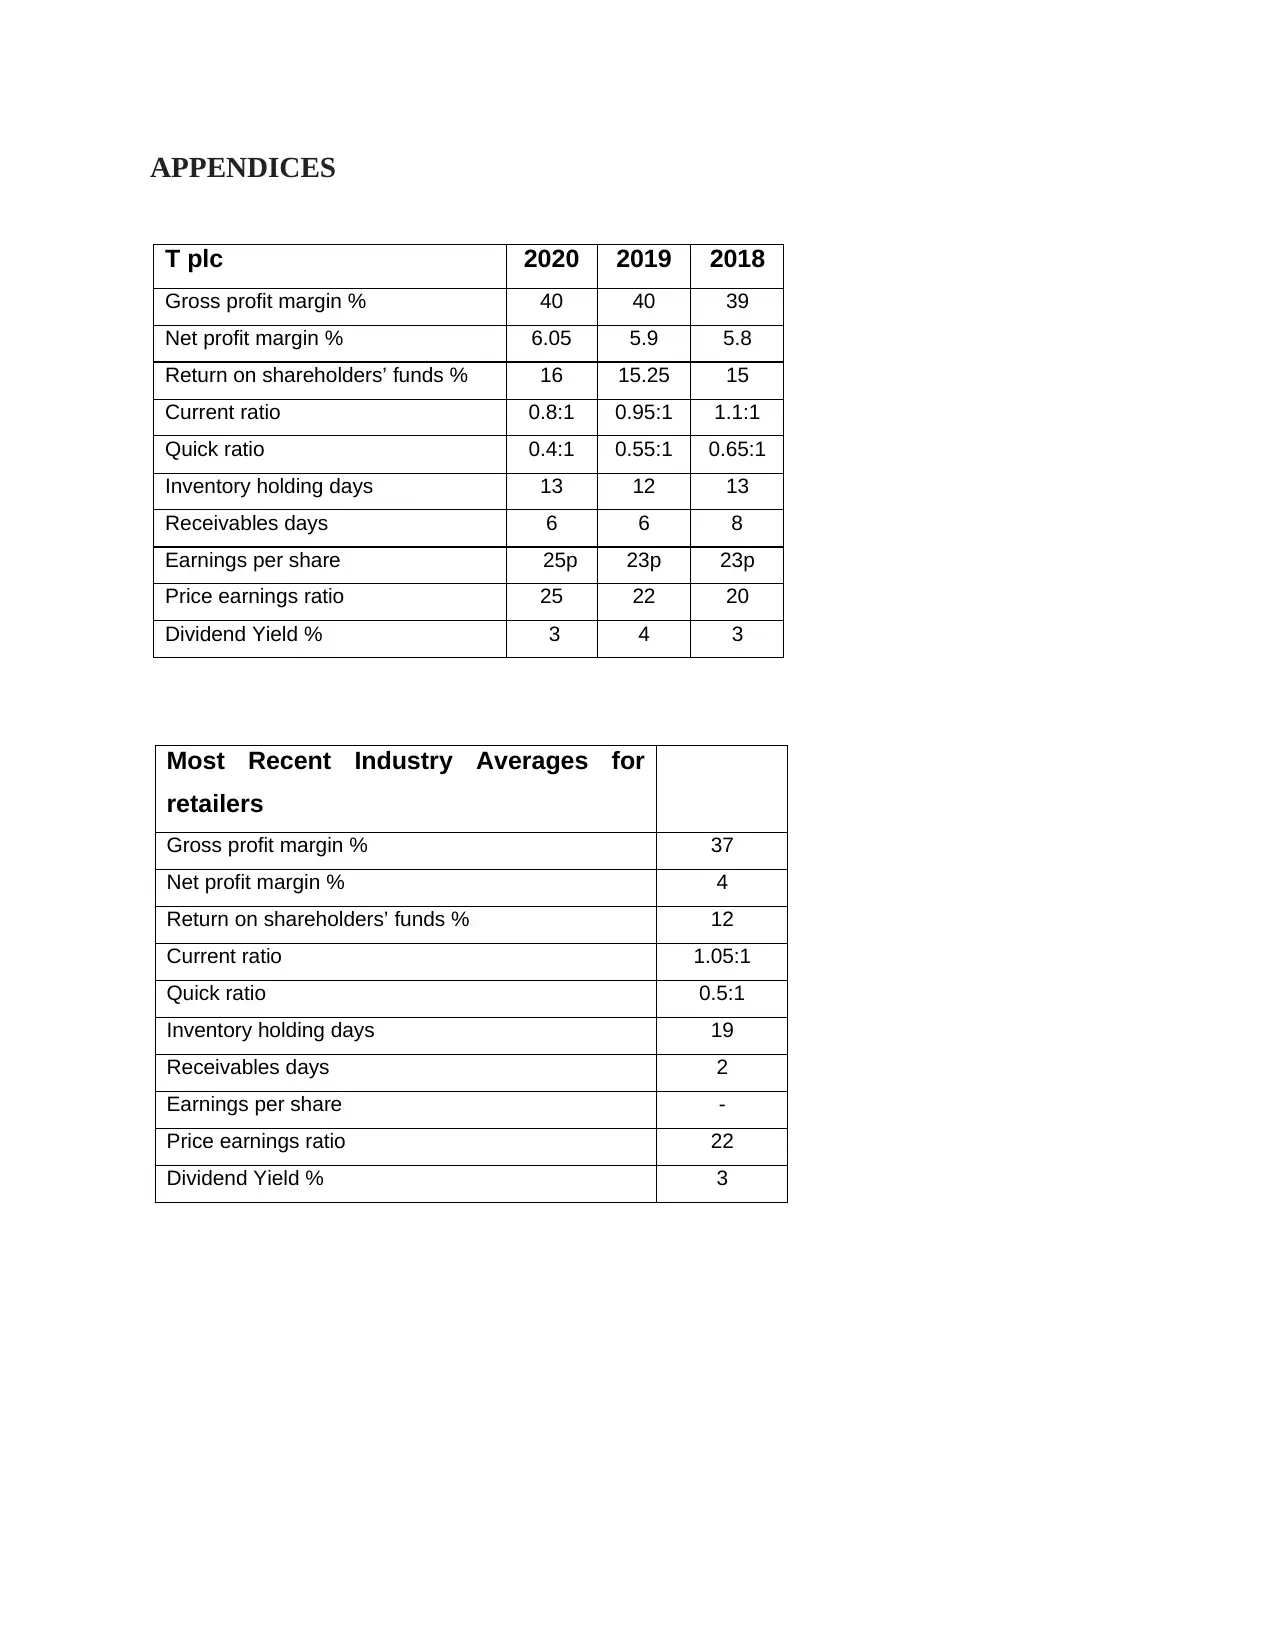
This report provides a comprehensive financial analysis of T plc company, evaluating its performance in terms of liquidity, profitability, and working capital management. It compares the company's financial ratios, such as return on equity, earnings per share, current ratio, and quick ratio, over a three-year period (2018-2020) and benchmarks them against industry averages to inform investment decisions. The analysis reveals that T plc has shown improvements in profitability and stock market performance, particularly in gross profit margin and return on equity, which are higher than industry averages. However, its liquidity ratios are lower than the industry average, indicating potential challenges in meeting short-term obligations. The report concludes that despite some liquidity concerns, T plc presents a favorable long-term investment opportunity due to its strong profitability, efficient working capital management, and overall positive financial performance compared to its peers, suggesting less risky and highly profitable prospects for investors. Desklib provides access to similar solved assignments and resources for students.

BUSINESS
FINANCE
FINANCE
Paraphrase This Document
Need a fresh take? Get an instant paraphrase of this document with our AI Paraphraser

TABLE OF CONTENTS
INTRODUCTION...........................................................................................................................3
MAIN BODY...................................................................................................................................3
Profitability ratio....................................................................................................................3
Liquidity ratio.........................................................................................................................3
Working capital management.................................................................................................4
Stock market performance......................................................................................................4
Investment decision- for investing in T plc company............................................................4
CONCLUSION................................................................................................................................5
REFERENCES................................................................................................................................6
APPENDICES.................................................................................................................................7

INTRODUCTION
Business finance means the procurement and deployment of fund by the company in their
business. This report will show the performance of T plc company in term of liquidity,
profitability and working capital management. Further, this report will also compare company
performance to industry performance for taking investment decision. This report will also
analyse the investment opportunity in T plc company by taking the base of financial tools.
MAIN BODY
Profitability ratio
Return on equity ratio evaluates how much company is generating return on the
investment. From the above table, data has been interpreted that return on equity ratio of T plc
company is constantly increasing. From the year 2018 to 2019 and 2019 to 2020 the ratio is
increased by 0.25% or 0.75% respectively (Ngetich, 2020). Earning per share shows how much
company is earning money on each share. It is increased from 2019 to 2020 by 2p. Dividend per
share is the amount declared as a dividend by the company for its shareholder. Divided yield
ratio is increased from 2018 to 2019 by 1% but after that it became constant. Price earning ratio
(P/E) is used to analyse the share price of the company is over-valued or under- valued. This
ratio is constantly increasing year-on-year basis. From the year 2018 to 2019 and 2019 to 2020 it
is increased by 20 to 22 and 22 to 25. Moreover, gross profit of the company is increased from
2018 to 2019 by 1% then after it became constant. Net profit of the company is increased by
0.15% from the year 2019 to 2020 (Kennickell, Kwast and Pogach, 2017).
Liquidity ratio
Current ratio is the part of liquidity ratio which shows how much company is capable in
paying its current obligations. The standard current ratio is 2:1. From the above table, it has been
interpreted that the current ratio of the company is decreasing from 1.1:1 to 0.95:1 and 0.95:1 to
0.8:1. Quick ratio measure the short term liquidity position of the company. This ratio decreasing
from 2018 to 2019 and 2019 to 2020 by 0.65:1 to 0.55:1 and 0.55:1 to 0.4:1.
⊘ This is a preview!⊘
Do you want full access?
Subscribe today to unlock all pages.

Trusted by 1+ million students worldwide

Working capital management
Working capital management is required for the company to evaluate assets and liabilities
for maintaining sufficient cash flow to meet short term obligation. Inventory holding days shows
how long the inventory has been hold by the company in its warehouse. The inventory holding
days is decreased from 2018 to 2019 by 13 to 12 days. Further, it is increased from the year 2019
to 2020 by 12 to 13 days (Mian and Sufi, 2018). Receivables days shows how long company is
taking to recover invoice amount. Account receivables days is decreased from 2018 to 2019 by
8 to 6 days. Further, it became constant from 2019 to 2020.
Stock market performance
Stock market performance (investment ratio) shows the performance of company's share
price. Investors use this ratio to evaluate the T plc company's potential to generate the return on
their investments. The investment ratio include earning per share, price to earning ratio, dividend
yield ratio etc. From the above table, investment ratios have been interpreted that P/E ratio and
earning on shareholder's fund is increased from 2018 to 2019 and 2019 to 2020. Moreover,
earning per share became constant from 2018 to 2019 and then it increased from 2019 to 2020 by
23p to 25p (Hosaka, 2019). In addition to, dividend yield ratio is increased from 2018 to 2019 by
3% to 4%. Further, it is decreased from 2019 to 2020 by 4% to 3%. The investment ratio helps
the investor to take a decision related to the investment in the T plc company. All the investment
ratios of the T plc company is performing well except the dividend yield ratio.
Investment decision- for investing in T plc company
Investors take decision to invest in share after comparing the T plc company performance
to the industry performance. From the above table, it can be interpreted that gross profit margin
of the T plc company is higher than industry average. This ratio shows the company has high
potential to grow as compare to the other company in the same industry. Further, if net profit
margin of the T plc company is higher than the industry ratio by 4% to 6.05%. Moreover, return
on equity share ratio of the company is higher than the industry ratio by 12% to 16% (Zorn and
et.al., 2018). Current ratio of the company is lower than the industry average ratio which means
company has less liquidity to meet its short term obligations. Further, if quick ratio is analysed
while taking investment decision than industry ratio is higher than compare to the T plc company
by 0.5:1 to 0.4:1. Company's working capital management can be identified through inventory
Paraphrase This Document
Need a fresh take? Get an instant paraphrase of this document with our AI Paraphraser

holding days and receivables days. Inventory holding ratio of the company is lesser than industry
ratio by 19 to 13 days (Naseem And et.al., 2019). Receivables days ratio of the company is
higher than the industry ratio by 2 to 6 days.
Moreover, if company's earning per share, price to equity and dividend yield ratio are compared
then it shows that company is at the higher level then its peers in the same industry.
Investor should invest in the T plc company because from the above analyses it has been
interpreted that company is performing well as compare to other peer companies. Moreover,
company has high liquidity, profitability and well managed working capital. Investor has a right
chance to invest for the long term in the T plc company. Moreover, company has high profit
margin which is showing that T plc company has well maintained it operating activity and
revenue generation. Moreover, company has less dead stock and efficient cash flow cycle which
helps to analyse the future bad debt. Investment in T plc company is less risky and highly
profitable.
CONCLUSION
Company has performed well as compared to its past record. Further, it has been
evaluated that company has better liquidity and profitability as compare to its peer companies.
Moreover, those investors who are looking for long term investment opportunities then it is the
right place to invest in T plc share. T plc company has high potential to grow in the future.

REFERENCES
Books and journal
Hosaka, T., 2019. Bankruptcy prediction using imaged financial ratios and convolutional neural
networks. Expert systems with applications. 117. pp.287-299.
Kennickell, A. B., Kwast, M. L. and Pogach, J., 2017. 7. Small Businesses and Small Business
Finance during the Financial Crisis and the Great Recession (pp. 291-350). University of
Chicago Press.
Mian, A. and Sufi, A., 2018. Finance and business cycles: the credit-driven household demand
channel. Journal of Economic Perspectives. 32(3). pp.31-58.
Naseem, M.A. And et.al., 2019. Moderating role of financial ratios in corporate social
responsibility disclosure and firm value. Plos one. 14(4). p.e0215430.
Ngetich, B., 2020. Access to business information, business finance, managerial skills and
performance of SMES in Kenya.
Zorn, A. and et.al., 2018. Financial ratios as indicators of economic sustainability: A quantitative
analysis for Swiss dairy farms. Sustainability. 10(8). p.2942.
Definition of 'Earning per share (eps)'. 2021. [Online] Available
through:<https://economictimes.indiatimes.com/definition/earnings-per-share-eps>
⊘ This is a preview!⊘
Do you want full access?
Subscribe today to unlock all pages.

Trusted by 1+ million students worldwide

APPENDICES
T plc 2020 2019 2018
Gross profit margin % 40 40 39
Net profit margin % 6.05 5.9 5.8
Return on shareholders’ funds % 16 15.25 15
Current ratio 0.8:1 0.95:1 1.1:1
Quick ratio 0.4:1 0.55:1 0.65:1
Inventory holding days 13 12 13
Receivables days 6 6 8
Earnings per share 25p 23p 23p
Price earnings ratio 25 22 20
Dividend Yield % 3 4 3
Most Recent Industry Averages for
retailers
Gross profit margin % 37
Net profit margin % 4
Return on shareholders’ funds % 12
Current ratio 1.05:1
Quick ratio 0.5:1
Inventory holding days 19
Receivables days 2
Earnings per share -
Price earnings ratio 22
Dividend Yield % 3
1 out of 7
Related Documents

Your All-in-One AI-Powered Toolkit for Academic Success.
+13062052269
info@desklib.com
Available 24*7 on WhatsApp / Email
Unlock your academic potential
Copyright © 2020–2025 A2Z Services. All Rights Reserved. Developed and managed by ZUCOL.