Financial Analysis Report: TAB Automobile Limited Performance

Verified

Added on  2021/09/21

|7
|1162
|78
Report
AI Summary
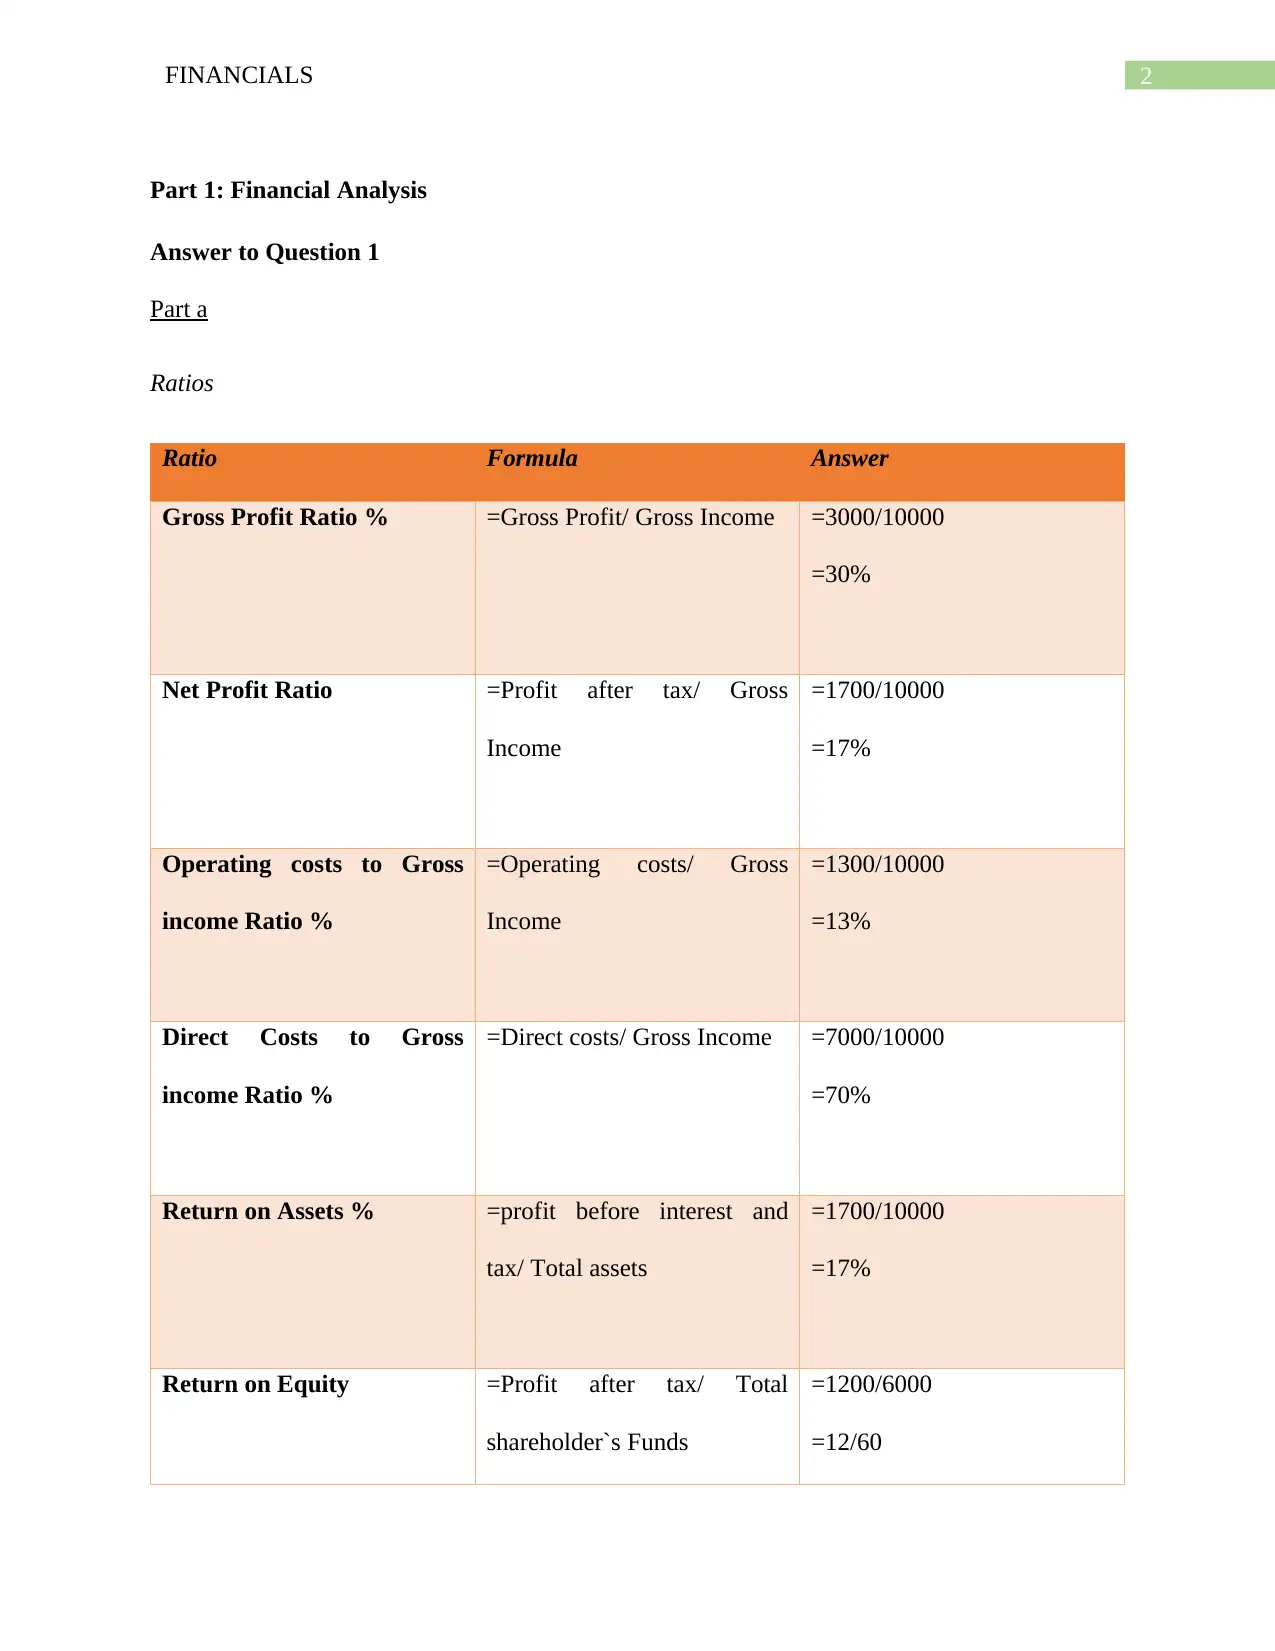
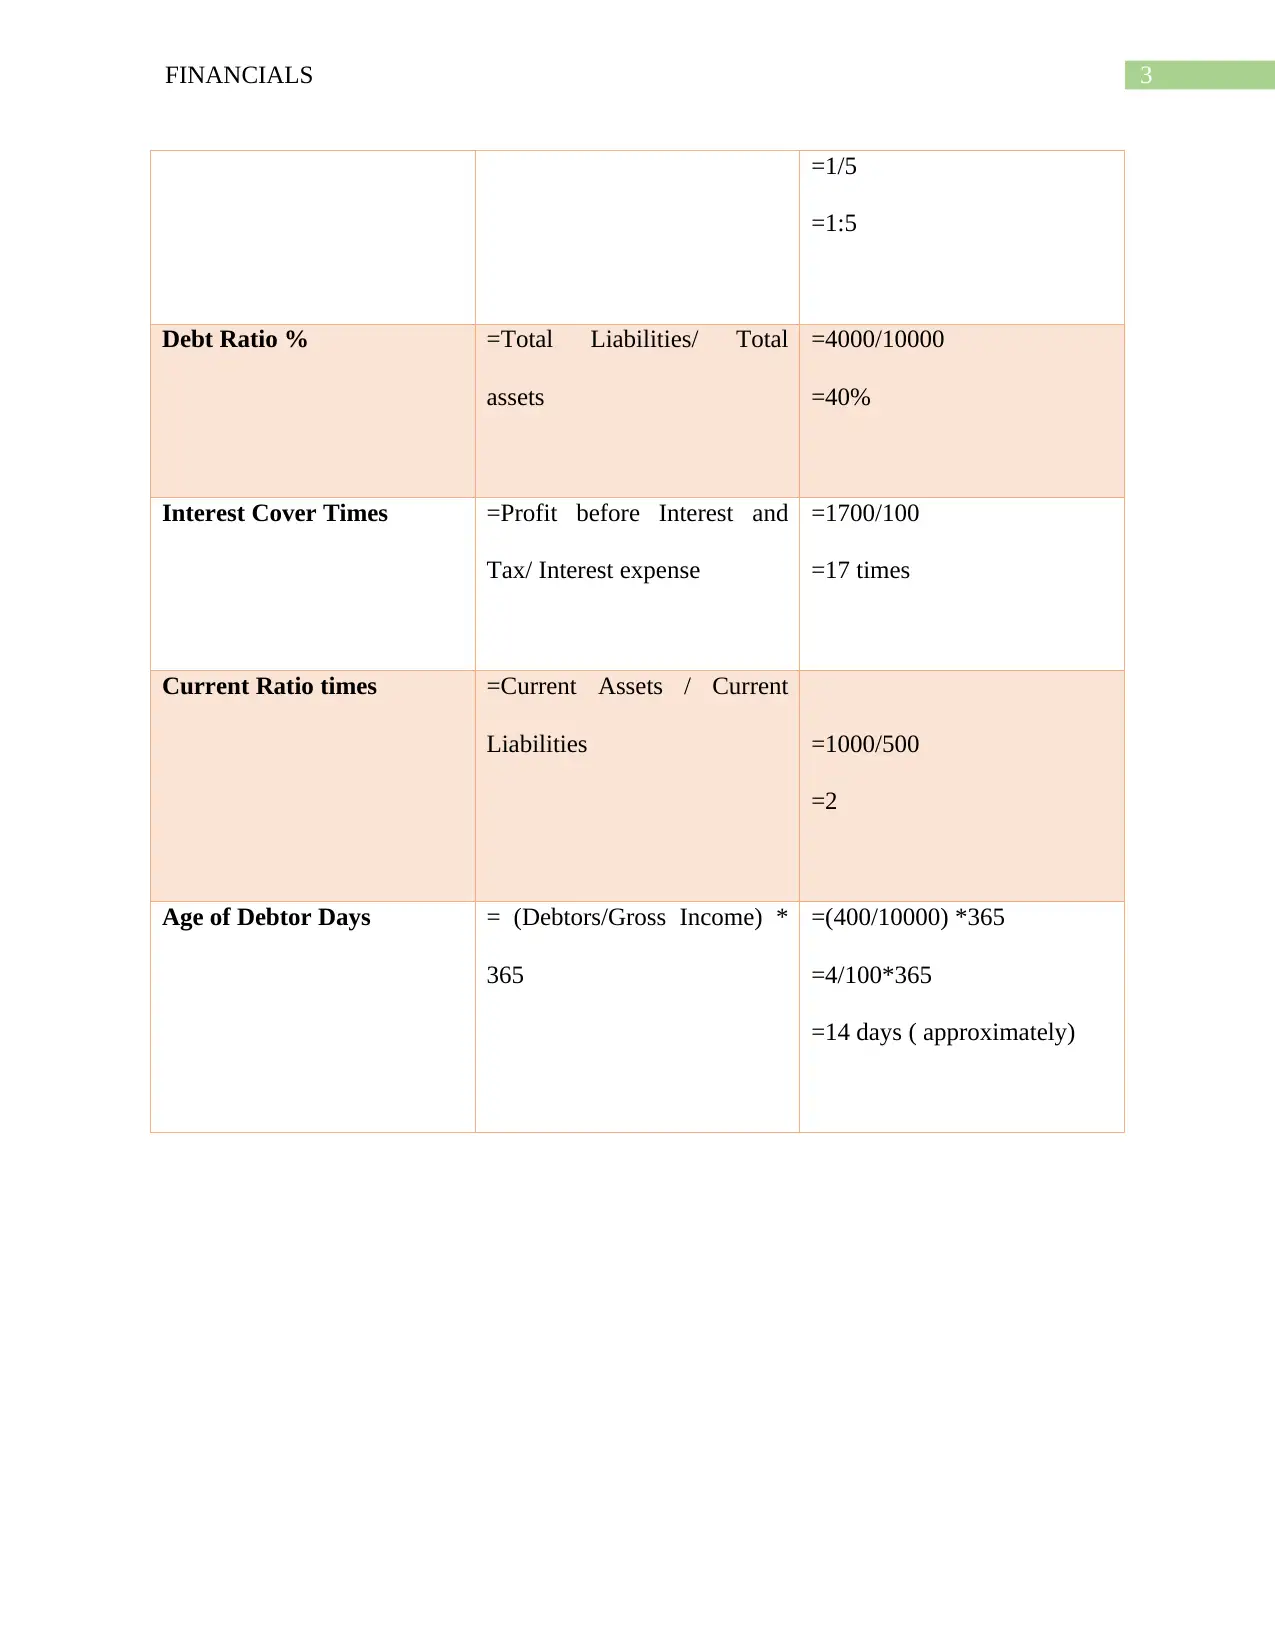
This report presents a comprehensive financial analysis of TAB Automobile Limited, evaluating its performance through various financial ratios. The analysis includes the calculation and interpretation of profitability ratios (Gross Profit Ratio, Net Profit Ratio, Return on Assets), liquidity ratios (Current Ratio, Debtors Day ratio), and stability ratios (Return on Equity, Interest Coverage Ratio). The report assesses the company's operating performance, highlighting areas of strength and weakness. It concludes with an overall evaluation of the company's financial health, offering insights into its potential for investment and recommendations for improvement, particularly in managing debt and achieving the desired return on equity. The analysis is based on the provided financial data and includes a discussion of the company's performance relative to industry standards.
tabler-icon-diamond-filled.svg

Contribute Materials

Your contribution can guide someone’s learning journey. Share your documents today.
Document Page
Running head: FINANCIALS
FINANCIALS
Name of the Student
Name of the University
Author Note
tabler-icon-diamond-filled.svg

Secure Best Marks with AI Grader

Need help grading? Try our AI Grader for instant feedback on your assignments.
Document Page
1FINANCIALS
Table of Contents
Part 1: Financial Analysis................................................................................................................2
Answer to Question 1..................................................................................................................2
References and Bibliography...........................................................................................................7
Document Page
2FINANCIALS
Part 1: Financial Analysis
Answer to Question 1
Part a
Ratios
Ratio Formula Answer
Gross Profit Ratio % =Gross Profit/ Gross Income =3000/10000
=30%
Net Profit Ratio =Profit after tax/ Gross
Income
=1700/10000
=17%
Operating costs to Gross
income Ratio %
=Operating costs/ Gross
Income
=1300/10000
=13%
Direct Costs to Gross
income Ratio %
=Direct costs/ Gross Income =7000/10000
=70%
Return on Assets % =profit before interest and
tax/ Total assets
=1700/10000
=17%
Return on Equity =Profit after tax/ Total
shareholder`s Funds
=1200/6000
=12/60
Document Page
3FINANCIALS
=1/5
=1:5
Debt Ratio % =Total Liabilities/ Total
assets
=4000/10000
=40%
Interest Cover Times =Profit before Interest and
Tax/ Interest expense
=1700/100
=17 times
Current Ratio times =Current Assets / Current
Liabilities =1000/500
=2
Age of Debtor Days = (Debtors/Gross Income) *
365
=(400/10000) *365
=4/100*365
=14 days ( approximately)
tabler-icon-diamond-filled.svg

Secure Best Marks with AI Grader

Need help grading? Try our AI Grader for instant feedback on your assignments.
Document Page
4FINANCIALS
Part b
TAB Automobile Limited
Operating Performance
It can be stated that the TAB Automobile Limited has been performing considerably well.
This statement has been given in lieu of its financial statements. In order to test the Operating
Performance of the firm, the ratios like Operating Costs to Gross Income ratio along with Direct
Costs to Gross Income ratio. The Operating costs ratio gives an idea about the costs to operate a
particular piece of business with respect to the income that operation brings in. This measure is
usually used for comparing the expenses of familiar properties. The given ratio of the firm is
13% which is a considerably good figure. Another measure used to estimate the operating
performance is the direct costs on Gross Income ratio. This ratio presents the costs incurred by
the firm in relation to the income earned and helps in understanding the efficiency of the firm`s
operations. For TAB this is 70% and needs to be improved. Hence, it can be stated that in an
overall manner, the operating performance of TAB can be stated to be considerable good.
Profitability
The profitability performance of a firm can be determined by the analysis of the
Profitability ratios (Matthew, 2017). The profitability ratios are ratios like Gross profit ratio, net
profit ratio and the Return on Assets. The Gross profit ratio is estimated by calculating the gross
profit and dividing it by the Gross Income. For TAB, this estimate is 30% which can be taken to
be considerable good. Moreover, the Net Profit Ratio for the firm has come up to 17% which can
be considered to a good figure. The Return on Asset also helps to understand the return or the
profits achieved on the assets and whether the business has an earning capacity or not. For TAB
Document Page
5FINANCIALS
the ratio is 17% which can be considered to be relatively good and hence, with respect to
performing, the firm has been doing considerably well.
Liquidity
The liquidity performance of the firm can be measured with the help of the company`s
ability to use its assets as well as cash quickly in order to pay off the debts which it owes. This
performance of the company can be measured with the help of the Current ratio and the Debtors
Day ratio (Karadag, 2015). The current ratio measures the firm`s capability to pay short term
debts. The current ratio of the firm is 2 which is a considerable figure. On the other hand, the
Debtors day ratio is approximately 2 weeks which can be said to be a fair number. Hence, TAB
is performing quite well in the aspect.
Stability
The stability is generally used to measure the long term counterpart of liquidity. It helps
in the measurement of the amount of debt which can be supported by the firm at large and
whether the debt and the equity can be balance or not. For TAB this measurement can be done
using the Return on equity and Interest Coverage ratio (Bekaert & Hodrick, 2017).The Return on
Equity measures the profitability and stability of the business in the long run. The Return Equity
of the business is 1:5 which can be taken to be a good figure. On the other hand, the Interest
Coverage Ratio is measures the earnings of the firm before taxes or any interest for the same
period of time. The lower the ratio, the better it is for the firm at large. The interest coverage
ratio 17 times which can be taken to be a high ratio. Hence, the company needs to take
considerable measures to ensure success in the long run.
Document Page
6FINANCIALS
Part c
Hence, from the given analysis on the particular company has done using the Ratio
Analysis, it can be rightfully stated that the company is performing considerably well. The
venture is a profitable one with good profitability as well as operating ratios. However, one
aspect that the firm needs to take care of is the liquidity ratio and ensure that it is able to pay
back the different debts on time. Irrespective of this, the business can be stated to be worth
purchasing given that it operators in Auckland. With a few changes in the debt policy, the
business shall function well.
Part d
The present rate of return on equity of the business is 20%, however as mentioned, BAT
expects its operating companies to earn a return on equity of 30% which means that the current
business has not been performing as per the standards of BAT. Hence, for BAT a suitable price
to purchase the business would be anything less than $16000 which can be stated to be the value
of the business including the funds of the shareholders.
chevron_up_icon
1 out of 7
circle_padding
hide_on_mobile
zoom_out_icon
logo.png

Your All-in-One AI-Powered Toolkit for Academic Success.

Available 24*7 on WhatsApp / Email

[object Object]