Financial Performance Analysis Report: Tassal Group Limited (BUS106)
VerifiedAdded on 2022/11/10
|10
|2003
|155
Report
AI Summary
This report presents a financial analysis of Tassal Group Limited, evaluating its performance through vertical and ratio analysis. The executive summary provides an overview of the company's financial position, assessing key areas using various financial tools. The analysis includes vertical analysis of the income statement, identifying the proportion of each element relative to sales. Ratio analysis is also performed, covering liquidity, profitability, efficiency, and capital structure. The report reveals that the company maintains a satisfactory financial position, with recommendations for improvement, particularly in asset efficiency. The analysis utilizes data from 2016 and 2017, providing insights into the company's performance over that period. The conclusion summarizes the key findings, emphasizing the company's overall positive financial health and areas for potential enhancement.

1
Accounting for Business
Accounting for Business
Paraphrase This Document
Need a fresh take? Get an instant paraphrase of this document with our AI Paraphraser
2
Executive summary
The report has been prepared and in that analysis of the financial position of the tassel group
limited is carried. In that, all of the areas have been evaluated and for that there is the use of the
various available tools. The situation has been analyzed and vertical analysis is carried for the
income statement of the company. All the areas which cover the major portion of the sales have
been determined by the help of that. The position of the business has further been evaluated by
the ration analysis and in that liquidity, profitability, efficiency and capital structure have been
analyzed. It is identified that the company is maintaining the position and performance in
appropriate manner.
3
Table of Contents
Executive summary.........................................................................................................................2
Introduction......................................................................................................................................4
Company overview..........................................................................................................................4
Vertical analysis...............................................................................................................................4
Ratio analysis...................................................................................................................................6
Return on equity...........................................................................................................................6
Asset turnover..............................................................................................................................6
Quick ratio....................................................................................................................................7
Debt to equity...............................................................................................................................7
Conclusion.......................................................................................................................................7
Recommendation.............................................................................................................................8
References........................................................................................................................................9
⊘ This is a preview!⊘
Do you want full access?
Subscribe today to unlock all pages.
Trusted by 1+ million students worldwide
4
Introduction
In the business, it is required that analyzation of the financial information shall be performed.
For that all of the available data will be collected and then the calculation will be made on that
basis. The company can use various types of analysis to perform all of these activities which are
available. The report will be covering the evaluation of Tassal group limited and for the same
there will be performance of the vertical and ratio analysis. They will be calculated and then with
the help of them there will be performance evaluation which will be made. The
recommendations will be made by analyzing the findings made with the undertaking of the
required process.
Company overview
Tassal group is the company which is involved in various activities in relation to the Atlantic
salmon and they include farming, sale, and marketing, processing and hatching. It covers all the
activities in relation to the Salmon (Tassel group limited, 2019). The company has been
segmented into two parts which are export market and domestic market. The main products
which are produced by the company include canned and frozen Tasmanian grown salmon
products which are distributed by the company in the wholesale and retail segments in complete
Australia and other exports market (Reuters, 2019). The brands which are there for the company
are superior gold, Tasmanian smokehouse, and Tassal.
Vertical analysis
The financial analysis is undertaken with the help of various financial tools which are available
and vertical analysis is one of them. In this, all of the items of the financial statements are shown
as the percentage of the total amount. In the income statement this is used by taking the sales as
the base and then the required calculations are made on the basis of the same (Warren, Reeve and
Duchac, 2013). It is important for the financial analysis as with the help of this there will be
identification of the proportion of each element in the total value. It will be ascertained that
which of the items are relevant and which will be required to be taken on the priority. The
importance of all the items will be represented and that will be used to analyze the position of the
Paraphrase This Document
Need a fresh take? Get an instant paraphrase of this document with our AI Paraphraser
5
business. It will also be helpful in the undertaking of the decisions for the coming period by
which the expenses which are incurred in excess will be controlled. By the help of this the
overall performance will be improved as the profits will be increasing which is the ultimate goal
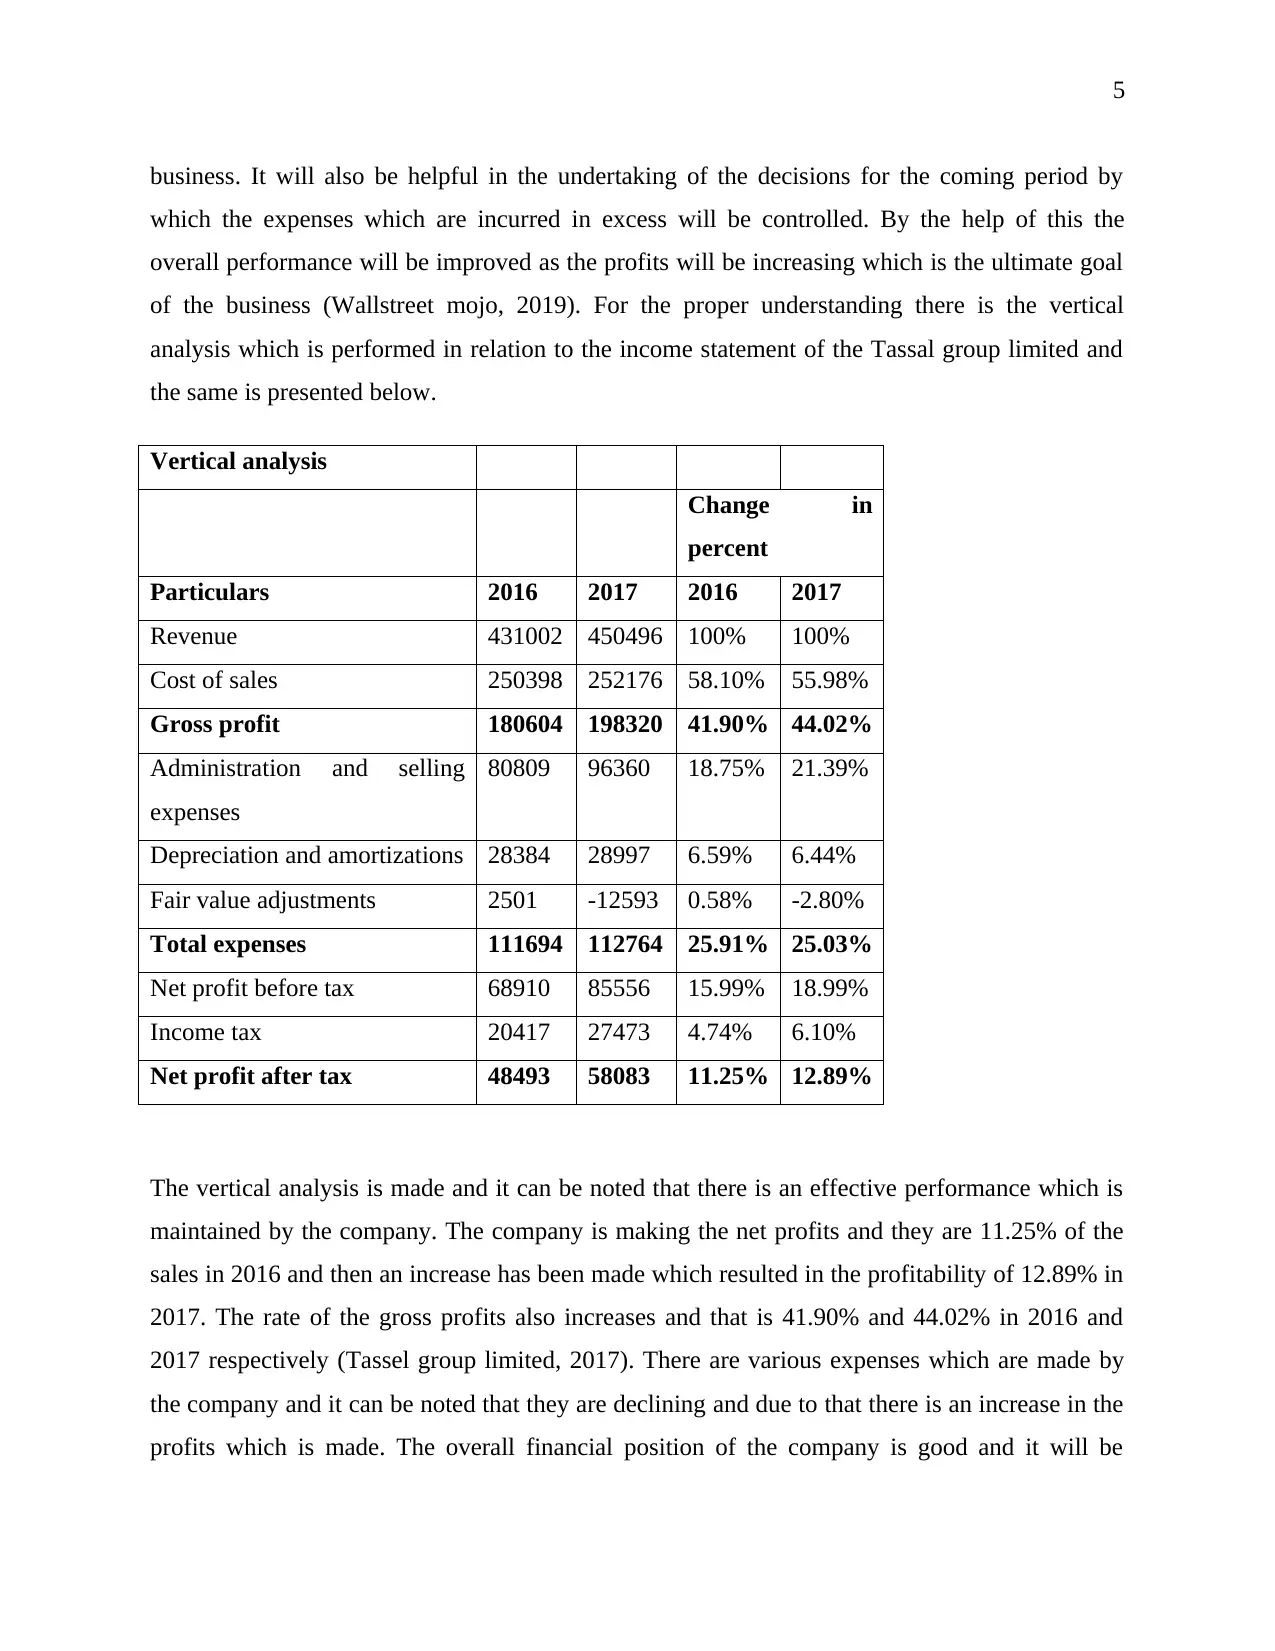
of the business (Wallstreet mojo, 2019). For the proper understanding there is the vertical
analysis which is performed in relation to the income statement of the Tassal group limited and
the same is presented below.
Vertical analysis
Change in
percent
Particulars 2016 2017 2016 2017
Revenue 431002 450496 100% 100%
Cost of sales 250398 252176 58.10% 55.98%
Gross profit 180604 198320 41.90% 44.02%
Administration and selling
expenses
80809 96360 18.75% 21.39%
Depreciation and amortizations 28384 28997 6.59% 6.44%
Fair value adjustments 2501 -12593 0.58% -2.80%
Total expenses 111694 112764 25.91% 25.03%
Net profit before tax 68910 85556 15.99% 18.99%
Income tax 20417 27473 4.74% 6.10%
Net profit after tax 48493 58083 11.25% 12.89%
The vertical analysis is made and it can be noted that there is an effective performance which is
maintained by the company. The company is making the net profits and they are 11.25% of the
sales in 2016 and then an increase has been made which resulted in the profitability of 12.89% in
2017. The rate of the gross profits also increases and that is 41.90% and 44.02% in 2016 and
2017 respectively (Tassel group limited, 2017). There are various expenses which are made by
the company and it can be noted that they are declining and due to that there is an increase in the
profits which is made. The overall financial position of the company is good and it will be
business. It will also be helpful in the undertaking of the decisions for the coming period by
which the expenses which are incurred in excess will be controlled. By the help of this the
overall performance will be improved as the profits will be increasing which is the ultimate goal
of the business (Wallstreet mojo, 2019). For the proper understanding there is the vertical
analysis which is performed in relation to the income statement of the Tassal group limited and
the same is presented below.
Vertical analysis
Change in
percent
Particulars 2016 2017 2016 2017
Revenue 431002 450496 100% 100%
Cost of sales 250398 252176 58.10% 55.98%
Gross profit 180604 198320 41.90% 44.02%
Administration and selling
expenses
80809 96360 18.75% 21.39%
Depreciation and amortizations 28384 28997 6.59% 6.44%
Fair value adjustments 2501 -12593 0.58% -2.80%
Total expenses 111694 112764 25.91% 25.03%
Net profit before tax 68910 85556 15.99% 18.99%
Income tax 20417 27473 4.74% 6.10%
Net profit after tax 48493 58083 11.25% 12.89%
The vertical analysis is made and it can be noted that there is an effective performance which is
maintained by the company. The company is making the net profits and they are 11.25% of the
sales in 2016 and then an increase has been made which resulted in the profitability of 12.89% in
2017. The rate of the gross profits also increases and that is 41.90% and 44.02% in 2016 and
2017 respectively (Tassel group limited, 2017). There are various expenses which are made by
the company and it can be noted that they are declining and due to that there is an increase in the
profits which is made. The overall financial position of the company is good and it will be
6
increased further if the company continues to perform in the same manner in the coming period.
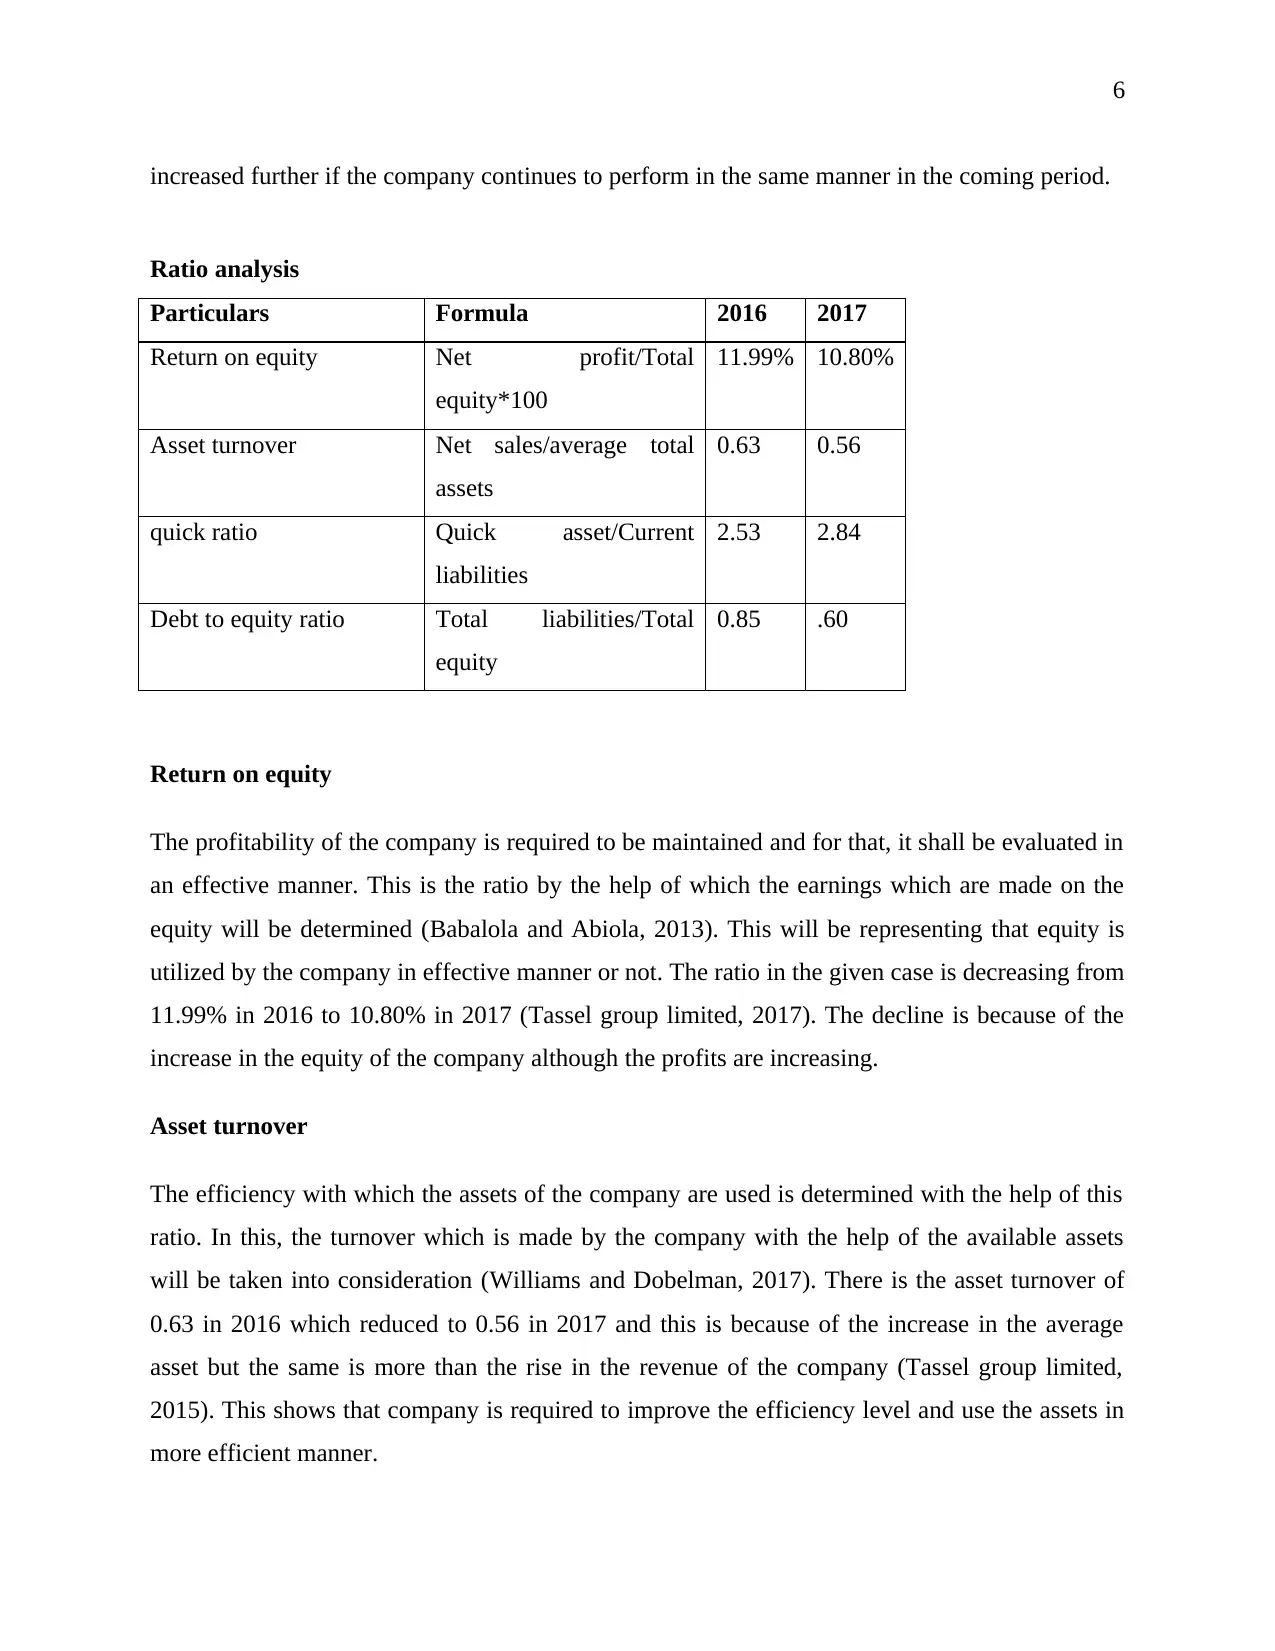
Ratio analysis
Particulars Formula 2016 2017
Return on equity Net profit/Total
equity*100
11.99% 10.80%
Asset turnover Net sales/average total
assets
0.63 0.56
quick ratio Quick asset/Current
liabilities
2.53 2.84
Debt to equity ratio Total liabilities/Total
equity
0.85 .60
Return on equity
The profitability of the company is required to be maintained and for that, it shall be evaluated in
an effective manner. This is the ratio by the help of which the earnings which are made on the
equity will be determined (Babalola and Abiola, 2013). This will be representing that equity is
utilized by the company in effective manner or not. The ratio in the given case is decreasing from
11.99% in 2016 to 10.80% in 2017 (Tassel group limited, 2017). The decline is because of the
increase in the equity of the company although the profits are increasing.
Asset turnover
The efficiency with which the assets of the company are used is determined with the help of this
ratio. In this, the turnover which is made by the company with the help of the available assets
will be taken into consideration (Williams and Dobelman, 2017). There is the asset turnover of
0.63 in 2016 which reduced to 0.56 in 2017 and this is because of the increase in the average
asset but the same is more than the rise in the revenue of the company (Tassel group limited,
2015). This shows that company is required to improve the efficiency level and use the assets in
more efficient manner.
increased further if the company continues to perform in the same manner in the coming period.
Ratio analysis
Particulars Formula 2016 2017
Return on equity Net profit/Total
equity*100
11.99% 10.80%
Asset turnover Net sales/average total
assets
0.63 0.56
quick ratio Quick asset/Current
liabilities
2.53 2.84
Debt to equity ratio Total liabilities/Total
equity
0.85 .60
Return on equity
The profitability of the company is required to be maintained and for that, it shall be evaluated in
an effective manner. This is the ratio by the help of which the earnings which are made on the
equity will be determined (Babalola and Abiola, 2013). This will be representing that equity is
utilized by the company in effective manner or not. The ratio in the given case is decreasing from
11.99% in 2016 to 10.80% in 2017 (Tassel group limited, 2017). The decline is because of the
increase in the equity of the company although the profits are increasing.
Asset turnover
The efficiency with which the assets of the company are used is determined with the help of this
ratio. In this, the turnover which is made by the company with the help of the available assets
will be taken into consideration (Williams and Dobelman, 2017). There is the asset turnover of
0.63 in 2016 which reduced to 0.56 in 2017 and this is because of the increase in the average
asset but the same is more than the rise in the revenue of the company (Tassel group limited,
2015). This shows that company is required to improve the efficiency level and use the assets in
more efficient manner.
⊘ This is a preview!⊘
Do you want full access?
Subscribe today to unlock all pages.
Trusted by 1+ million students worldwide
7
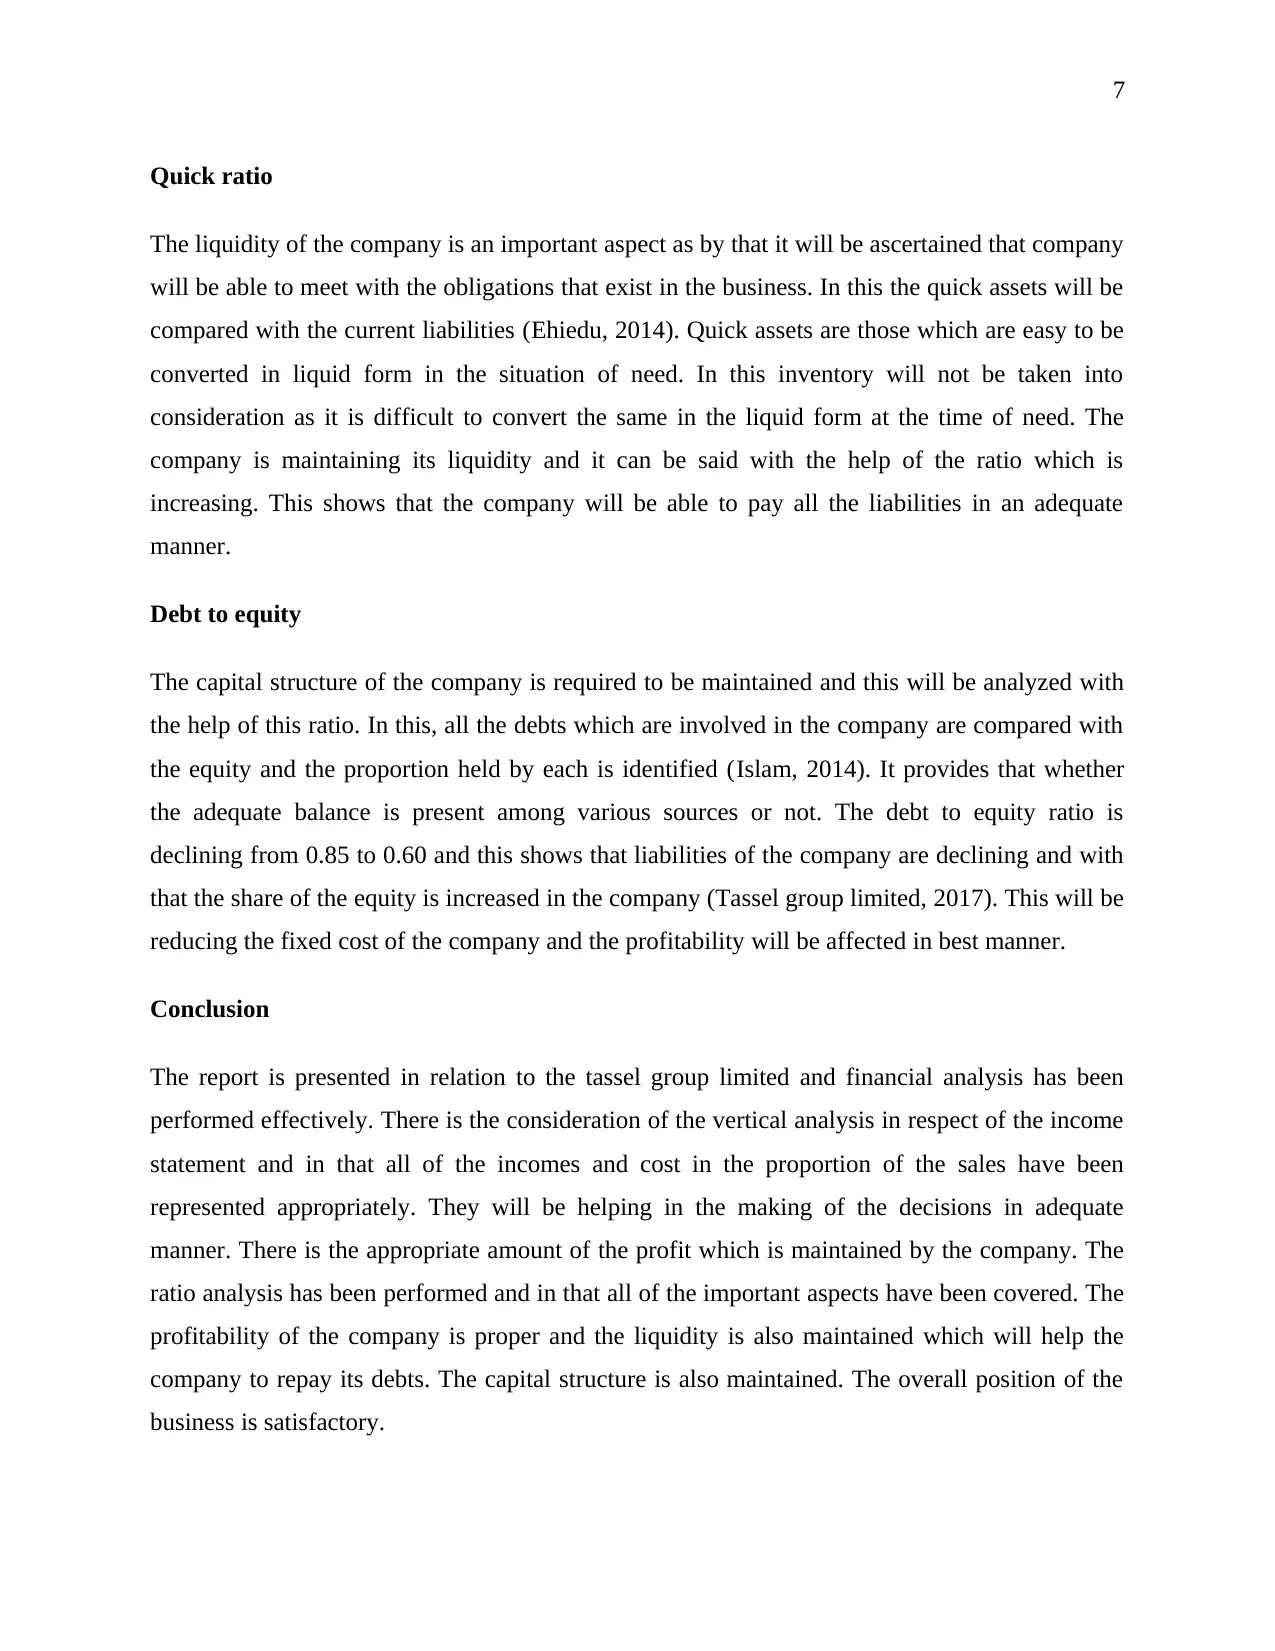
Quick ratio
The liquidity of the company is an important aspect as by that it will be ascertained that company
will be able to meet with the obligations that exist in the business. In this the quick assets will be
compared with the current liabilities (Ehiedu, 2014). Quick assets are those which are easy to be
converted in liquid form in the situation of need. In this inventory will not be taken into
consideration as it is difficult to convert the same in the liquid form at the time of need. The
company is maintaining its liquidity and it can be said with the help of the ratio which is
increasing. This shows that the company will be able to pay all the liabilities in an adequate
manner.
Debt to equity
The capital structure of the company is required to be maintained and this will be analyzed with
the help of this ratio. In this, all the debts which are involved in the company are compared with
the equity and the proportion held by each is identified (Islam, 2014). It provides that whether
the adequate balance is present among various sources or not. The debt to equity ratio is
declining from 0.85 to 0.60 and this shows that liabilities of the company are declining and with
that the share of the equity is increased in the company (Tassel group limited, 2017). This will be
reducing the fixed cost of the company and the profitability will be affected in best manner.
Conclusion
The report is presented in relation to the tassel group limited and financial analysis has been
performed effectively. There is the consideration of the vertical analysis in respect of the income
statement and in that all of the incomes and cost in the proportion of the sales have been
represented appropriately. They will be helping in the making of the decisions in adequate
manner. There is the appropriate amount of the profit which is maintained by the company. The
ratio analysis has been performed and in that all of the important aspects have been covered. The
profitability of the company is proper and the liquidity is also maintained which will help the
company to repay its debts. The capital structure is also maintained. The overall position of the
business is satisfactory.
Paraphrase This Document
Need a fresh take? Get an instant paraphrase of this document with our AI Paraphraser
8
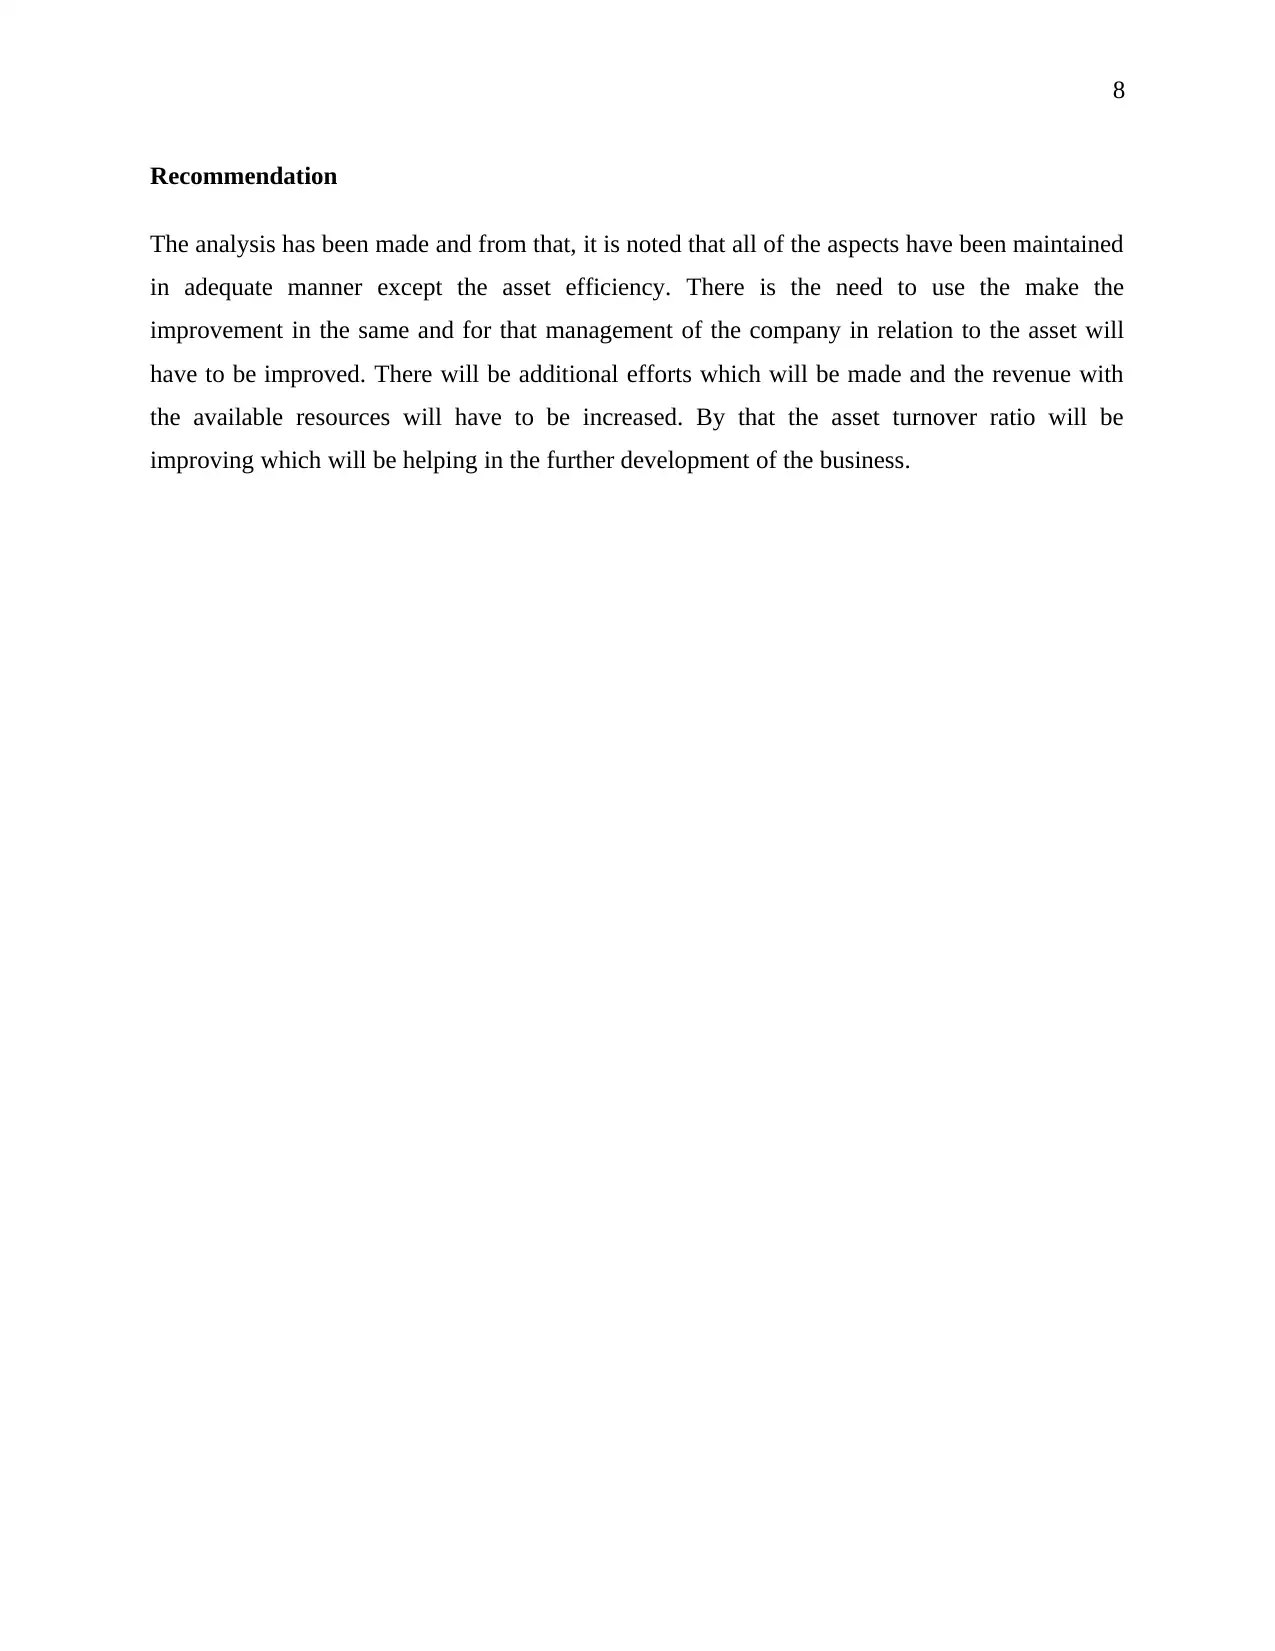
Recommendation
The analysis has been made and from that, it is noted that all of the aspects have been maintained
in adequate manner except the asset efficiency. There is the need to use the make the
improvement in the same and for that management of the company in relation to the asset will
have to be improved. There will be additional efforts which will be made and the revenue with
the available resources will have to be increased. By that the asset turnover ratio will be
improving which will be helping in the further development of the business.
9
References
Babalola, Y.A. and Abiola, F.R. (2013) Financial ratio analysis of firms: A tool for decision
making. International journal of management sciences, 1(4), pp.132-137.
Ehiedu, V.C. (2014) The impact of liquidity on profitability of some selected companies: The
financial statement analysis (FSA) approach. Research Journal of Finance and Accounting, 5(5),
pp.81-90.
Islam, M.A. (2014) An analysis of the financial performance of national bank limited using
financial ratio. Journal of Behavioural Economics, Finance, Entrepreneurship, Accounting and
Transport, 2(5), pp.121-129.
Reuters. (2019) Profile:Tassal Group Ltd (TGR.AX). [Online] Available at:
https://in.reuters.com/finance/stocks/company-profile/TGR.AX [Accessed 18 September 2019]
Tassel group limited. (2015) Annual report. [Online] Available at:
http://www.annualreports.com/HostedData/AnnualReportArchive/T/ASX_TGR_2015.pdf
[Accessed 18 September 2019]
Tassel group limited. (2017) Annual report. [Online] Available at:
http://www.annualreports.com/HostedData/AnnualReportArchive/T/ASX_TGR_2017.pdf
[Accessed 18 September 2019]
Tassel group limited. (2019) About us. [Online] Available at: http://tassalgroup.com.au/about-us/
[Accessed 18 September 2019]
Wallstreet mojo. (2019) Vertical Analysis Common Size. [Online] Available at:
https://www.wallstreetmojo.com/vertical-analysis-common-size/ [Accessed 18 September 2019]
Warren, C., Reeve, J.M. and Duchac, J. (2013) Financial & managerial accounting. Cengage
learning.
Williams, E.E. and Dobelman, J.A. (2017) Financial statement analysis. World Scientific Book
Chapters, pp.109-169.
⊘ This is a preview!⊘
Do you want full access?
Subscribe today to unlock all pages.
Trusted by 1+ million students worldwide

10
1 out of 10
Related Documents


Your All-in-One AI-Powered Toolkit for Academic Success.
+13062052269
info@desklib.com
Available 24*7 on WhatsApp / Email
![[object Object]](/_next/static/media/star-bottom.7253800d.svg)
Unlock your academic potential
Copyright © 2020–2026 A2Z Services. All Rights Reserved. Developed and managed by ZUCOL.