Detailed Business Valuation and Analysis of Tassal Group Limited
VerifiedAdded on 2023/06/12
|17
|3409
|371
Report
AI Summary
This report provides a comprehensive business valuation and financial analysis of Tassal Group Limited. It includes a reformatted financial statement, ratio analysis covering return on equity, return on net operating profit, profit margin, asset turnover ratio, financial leverage, and net borrowing cost. Additionally, the report features cash flow analysis, liquidity ratio, solvency ratio, and cash flow ratio assessments to evaluate the company's financial health and performance over the past five years. This document is available on Desklib, a platform providing study tools for students.

Running Head: Business valuation and analysis
1
1
Paraphrase This Document
Need a fresh take? Get an instant paraphrase of this document with our AI Paraphraser
Business valuation and analysis 2
Contents
Introduction.......................................................................................................................4
Reformatted financial statement.......................................................................................4
Ratio analysis....................................................................................................................5
Return on equity...........................................................................................................5
Return on net operating profit.......................................................................................6
Profit margin.................................................................................................................7
Asset turnover ratio.......................................................................................................8
Financial leverage.........................................................................................................9
Net borrowing cost.....................................................................................................10
Cash flow analysis..........................................................................................................11
Liquidity ratio.............................................................................................................11
Solvency ratio.............................................................................................................12
Cash flow ratio............................................................................................................13
References.......................................................................................................................14
Appendix.........................................................................................................................15
Business valuation and analysis 3
Figure 1: Return on equity................................................................................................6
Figure 2 Return on non operating assets...........................................................................7
Figure 3: Profit margin.....................................................................................................8
Figure 4: Asset turnover ratio...........................................................................................9
Figure 5: Financial leverage...........................................................................................10
Figure 6: Net borrowing cost..........................................................................................11
Figure 7: Liquidity ratios................................................................................................12
Figure 8: Cash flow ratios...............................................................................................13
⊘ This is a preview!⊘
Do you want full access?
Subscribe today to unlock all pages.
Trusted by 1+ million students worldwide
Business valuation and analysis 4
Introduction:
The report has been prepared on Tassal group limited. The report concentrates on the
markets and the financial statement of the company to evaluate the performance of the
company. It has been observed that the financial performance of the company has been
affected through various internal and external changes. Being a financial analyst, the first
work which has been done is the reformatting of the financial statement of the company
which has been putted in appendix. Secondly, the trend of the company in last 5 years has
been evaluated on the basis of ratio analysis of the company. The ratio analysis has been
conducted on the basis of reformatted financial statement of the company. The analysis has
been done on the ratios and it has been valuated that why these changes have taken place into
the performance of the company. Lastly, cash flow of the company has been analyzed
through using the liquidity, cash flow ratios and solvency position of the company.
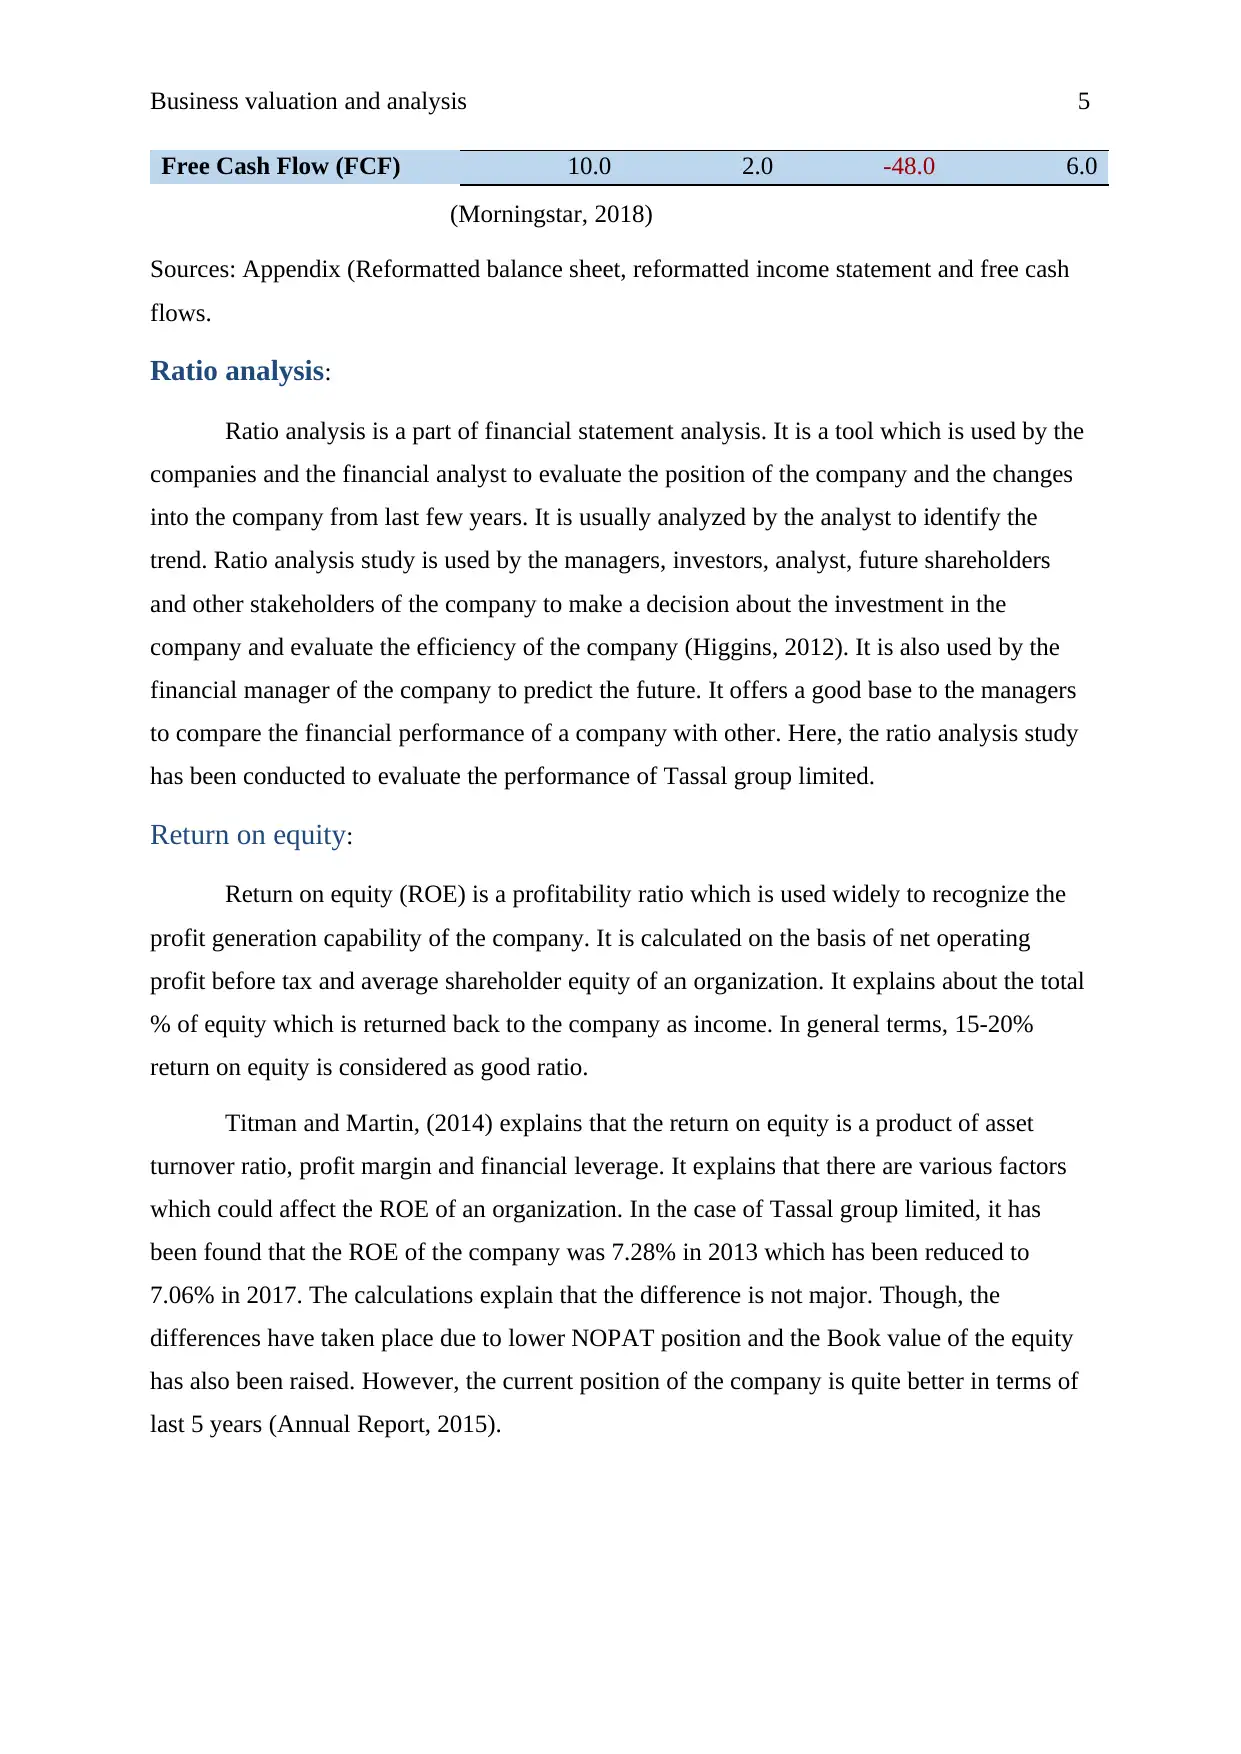
Reformatted financial statement:
The financial statement of the company has been reformatted by using the last 5
years’ final financial statement of the company which includes income statement, balance
sheet, changes in equity shareholder of the company and the cash flow statement of the
company (Madhura, 2011). The main items and the figures of the financial statement of the
company are as follows:
2017 2016 2015 2014
AUD $ (m) AUD $ (m) AUD $ (m) AUD $ (m)
Net Operating Assets
(NOA)
481.0 429.0 398.0 356.0
Net Financing Obligation
(NFO)
-57.0 25.0 26.0 14.0
Book Value (Common
Shareholder Equity)
538.0 404.0 372.0 342.0
2017 2016 2015 2014
AUD $ (m) AUD $ (m) AUD $ (m) AUD $ (m)
Net Operating Profit After
Tax (NOPAT)
38.0 30.0 35.0 30.0
Net Financing Expense
(NFEat)
10.5 9.1 8.4 6.3
Net Income (Clean
Surplus Profit)
27.5 20.9 26.6 23.7
Introduction:
The report has been prepared on Tassal group limited. The report concentrates on the
markets and the financial statement of the company to evaluate the performance of the
company. It has been observed that the financial performance of the company has been
affected through various internal and external changes. Being a financial analyst, the first
work which has been done is the reformatting of the financial statement of the company
which has been putted in appendix. Secondly, the trend of the company in last 5 years has
been evaluated on the basis of ratio analysis of the company. The ratio analysis has been
conducted on the basis of reformatted financial statement of the company. The analysis has
been done on the ratios and it has been valuated that why these changes have taken place into
the performance of the company. Lastly, cash flow of the company has been analyzed
through using the liquidity, cash flow ratios and solvency position of the company.
Reformatted financial statement:
The financial statement of the company has been reformatted by using the last 5
years’ final financial statement of the company which includes income statement, balance
sheet, changes in equity shareholder of the company and the cash flow statement of the
company (Madhura, 2011). The main items and the figures of the financial statement of the
company are as follows:
2017 2016 2015 2014
AUD $ (m) AUD $ (m) AUD $ (m) AUD $ (m)
Net Operating Assets
(NOA)
481.0 429.0 398.0 356.0
Net Financing Obligation
(NFO)
-57.0 25.0 26.0 14.0
Book Value (Common
Shareholder Equity)
538.0 404.0 372.0 342.0
2017 2016 2015 2014
AUD $ (m) AUD $ (m) AUD $ (m) AUD $ (m)
Net Operating Profit After
Tax (NOPAT)
38.0 30.0 35.0 30.0
Net Financing Expense
(NFEat)
10.5 9.1 8.4 6.3
Net Income (Clean
Surplus Profit)
27.5 20.9 26.6 23.7
Paraphrase This Document
Need a fresh take? Get an instant paraphrase of this document with our AI Paraphraser
Business valuation and analysis 5
Free Cash Flow (FCF) 10.0 2.0 -48.0 6.0
(Morningstar, 2018)
Sources: Appendix (Reformatted balance sheet, reformatted income statement and free cash
flows.
Ratio analysis:
Ratio analysis is a part of financial statement analysis. It is a tool which is used by the
companies and the financial analyst to evaluate the position of the company and the changes
into the company from last few years. It is usually analyzed by the analyst to identify the
trend. Ratio analysis study is used by the managers, investors, analyst, future shareholders
and other stakeholders of the company to make a decision about the investment in the
company and evaluate the efficiency of the company (Higgins, 2012). It is also used by the
financial manager of the company to predict the future. It offers a good base to the managers
to compare the financial performance of a company with other. Here, the ratio analysis study
has been conducted to evaluate the performance of Tassal group limited.
Return on equity:
Return on equity (ROE) is a profitability ratio which is used widely to recognize the
profit generation capability of the company. It is calculated on the basis of net operating
profit before tax and average shareholder equity of an organization. It explains about the total
% of equity which is returned back to the company as income. In general terms, 15-20%
return on equity is considered as good ratio.
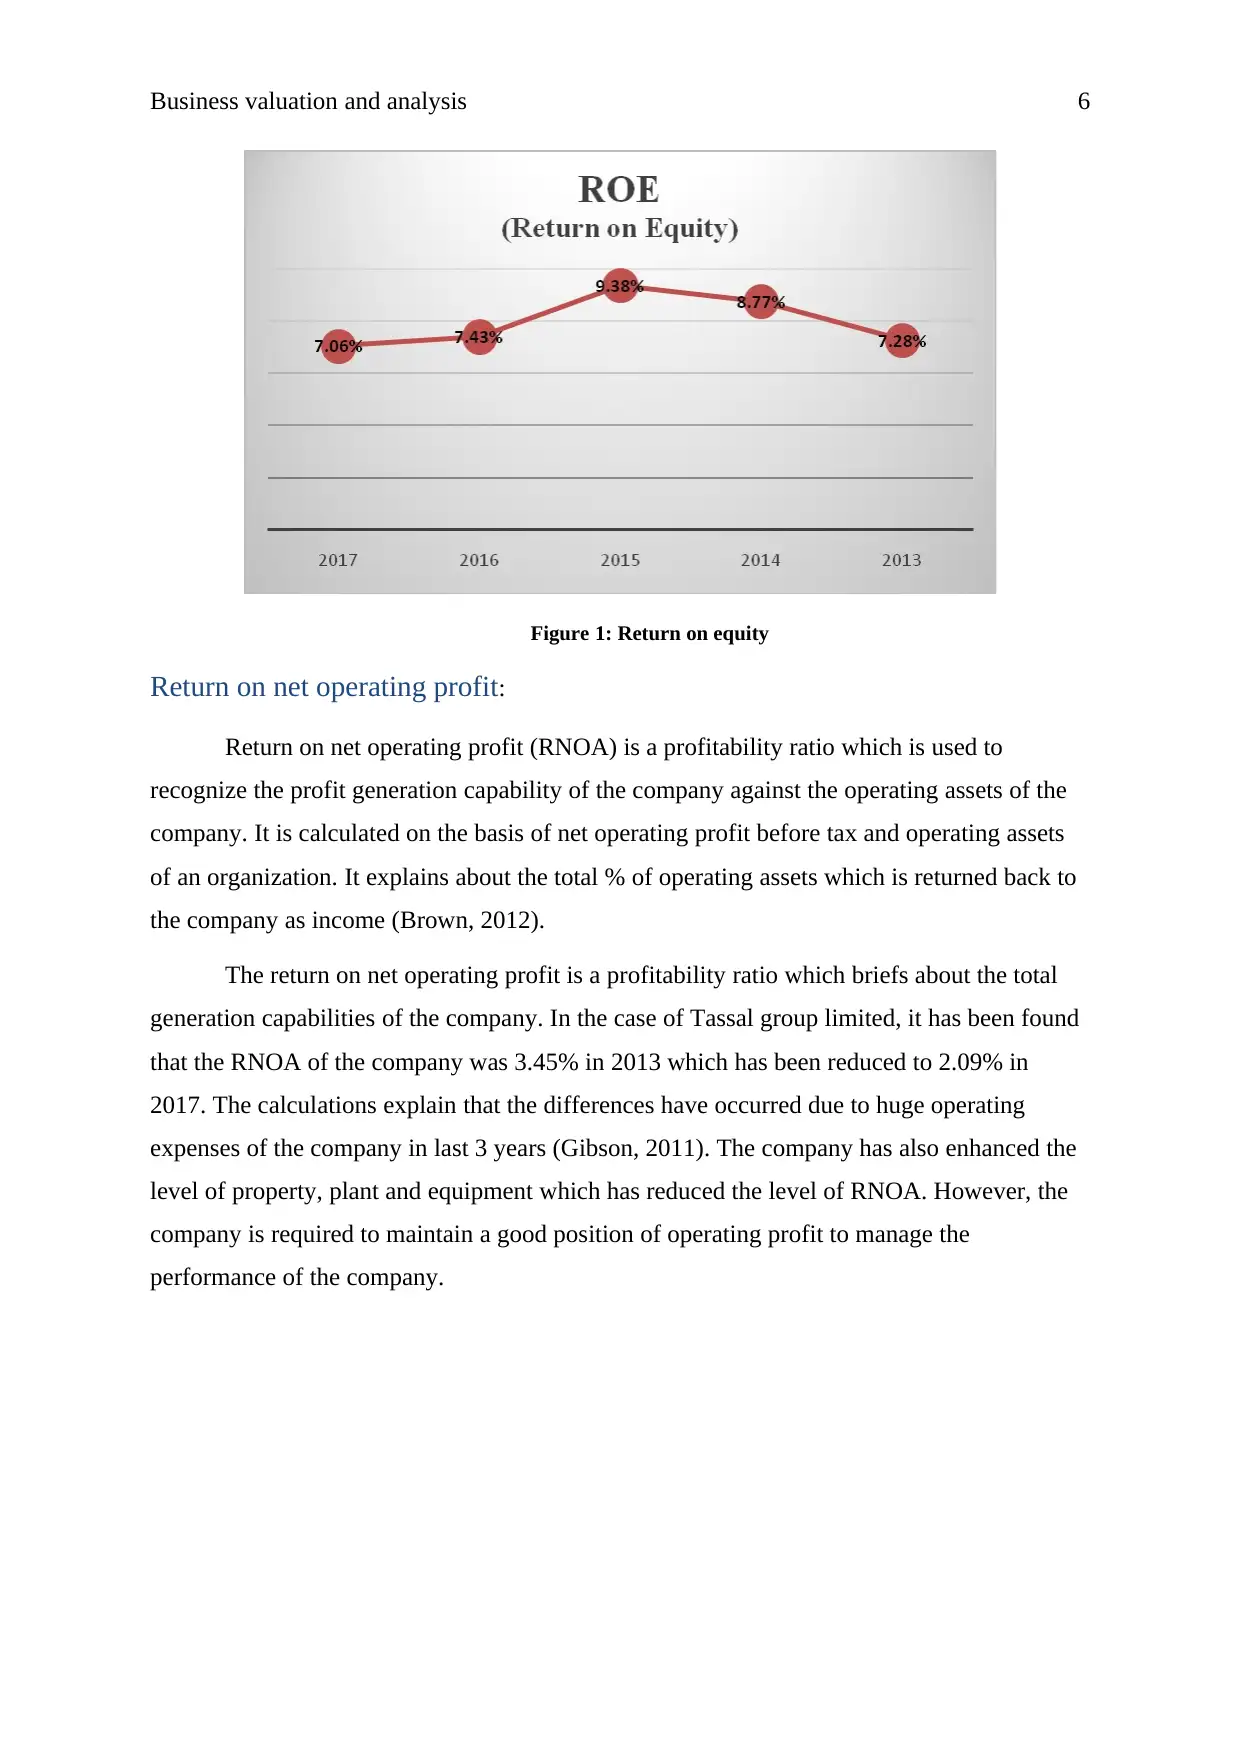
Titman and Martin, (2014) explains that the return on equity is a product of asset
turnover ratio, profit margin and financial leverage. It explains that there are various factors
which could affect the ROE of an organization. In the case of Tassal group limited, it has
been found that the ROE of the company was 7.28% in 2013 which has been reduced to
7.06% in 2017. The calculations explain that the difference is not major. Though, the
differences have taken place due to lower NOPAT position and the Book value of the equity
has also been raised. However, the current position of the company is quite better in terms of
last 5 years (Annual Report, 2015).
Free Cash Flow (FCF) 10.0 2.0 -48.0 6.0
(Morningstar, 2018)
Sources: Appendix (Reformatted balance sheet, reformatted income statement and free cash
flows.
Ratio analysis:
Ratio analysis is a part of financial statement analysis. It is a tool which is used by the
companies and the financial analyst to evaluate the position of the company and the changes
into the company from last few years. It is usually analyzed by the analyst to identify the
trend. Ratio analysis study is used by the managers, investors, analyst, future shareholders
and other stakeholders of the company to make a decision about the investment in the
company and evaluate the efficiency of the company (Higgins, 2012). It is also used by the
financial manager of the company to predict the future. It offers a good base to the managers
to compare the financial performance of a company with other. Here, the ratio analysis study
has been conducted to evaluate the performance of Tassal group limited.
Return on equity:
Return on equity (ROE) is a profitability ratio which is used widely to recognize the
profit generation capability of the company. It is calculated on the basis of net operating
profit before tax and average shareholder equity of an organization. It explains about the total
% of equity which is returned back to the company as income. In general terms, 15-20%
return on equity is considered as good ratio.
Titman and Martin, (2014) explains that the return on equity is a product of asset
turnover ratio, profit margin and financial leverage. It explains that there are various factors
which could affect the ROE of an organization. In the case of Tassal group limited, it has
been found that the ROE of the company was 7.28% in 2013 which has been reduced to
7.06% in 2017. The calculations explain that the difference is not major. Though, the
differences have taken place due to lower NOPAT position and the Book value of the equity
has also been raised. However, the current position of the company is quite better in terms of
last 5 years (Annual Report, 2015).
Business valuation and analysis 6
Figure 1: Return on equity
Return on net operating profit:
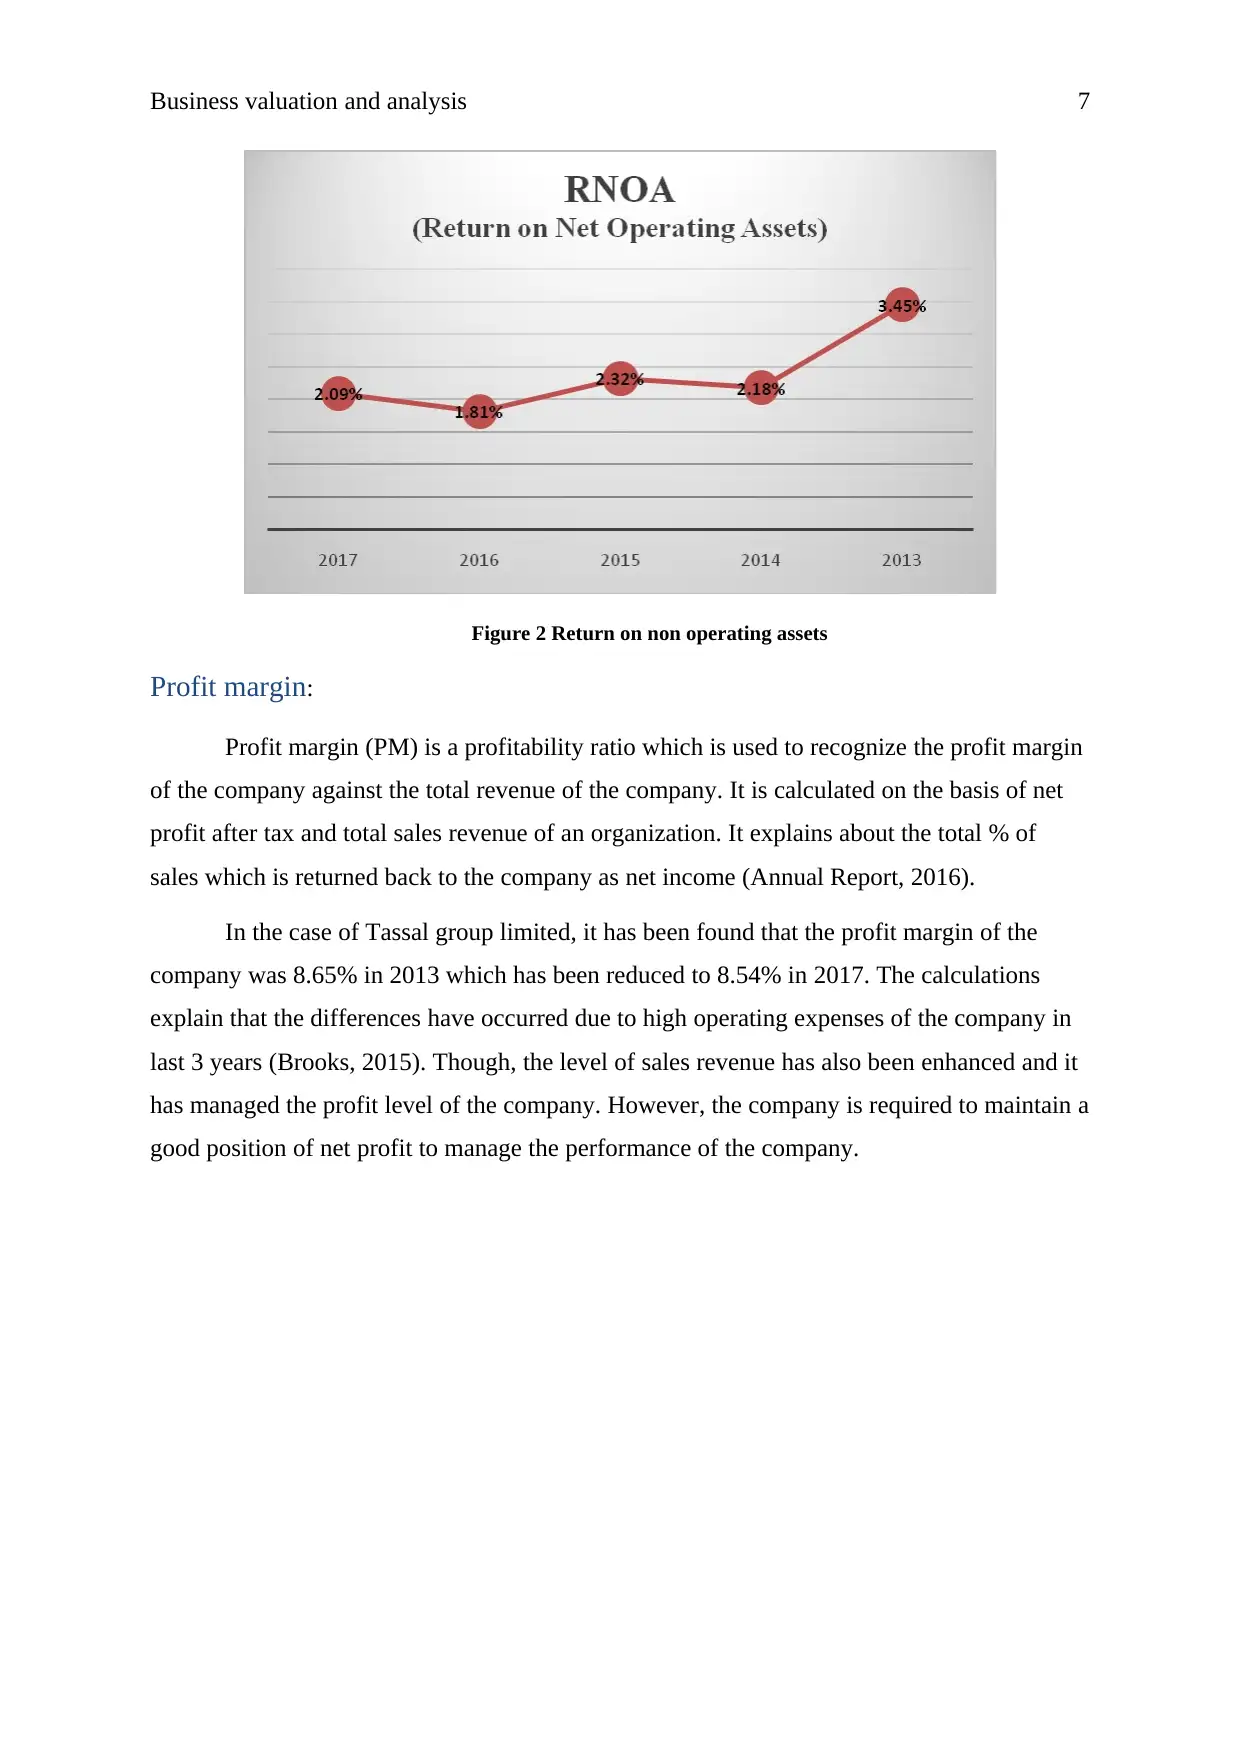
Return on net operating profit (RNOA) is a profitability ratio which is used to
recognize the profit generation capability of the company against the operating assets of the
company. It is calculated on the basis of net operating profit before tax and operating assets
of an organization. It explains about the total % of operating assets which is returned back to
the company as income (Brown, 2012).
The return on net operating profit is a profitability ratio which briefs about the total
generation capabilities of the company. In the case of Tassal group limited, it has been found
that the RNOA of the company was 3.45% in 2013 which has been reduced to 2.09% in
2017. The calculations explain that the differences have occurred due to huge operating
expenses of the company in last 3 years (Gibson, 2011). The company has also enhanced the
level of property, plant and equipment which has reduced the level of RNOA. However, the
company is required to maintain a good position of operating profit to manage the
performance of the company.
Figure 1: Return on equity
Return on net operating profit:
Return on net operating profit (RNOA) is a profitability ratio which is used to
recognize the profit generation capability of the company against the operating assets of the
company. It is calculated on the basis of net operating profit before tax and operating assets
of an organization. It explains about the total % of operating assets which is returned back to
the company as income (Brown, 2012).
The return on net operating profit is a profitability ratio which briefs about the total
generation capabilities of the company. In the case of Tassal group limited, it has been found
that the RNOA of the company was 3.45% in 2013 which has been reduced to 2.09% in
2017. The calculations explain that the differences have occurred due to huge operating
expenses of the company in last 3 years (Gibson, 2011). The company has also enhanced the
level of property, plant and equipment which has reduced the level of RNOA. However, the
company is required to maintain a good position of operating profit to manage the
performance of the company.
⊘ This is a preview!⊘
Do you want full access?
Subscribe today to unlock all pages.
Trusted by 1+ million students worldwide
Business valuation and analysis 7
Figure 2 Return on non operating assets
Profit margin:
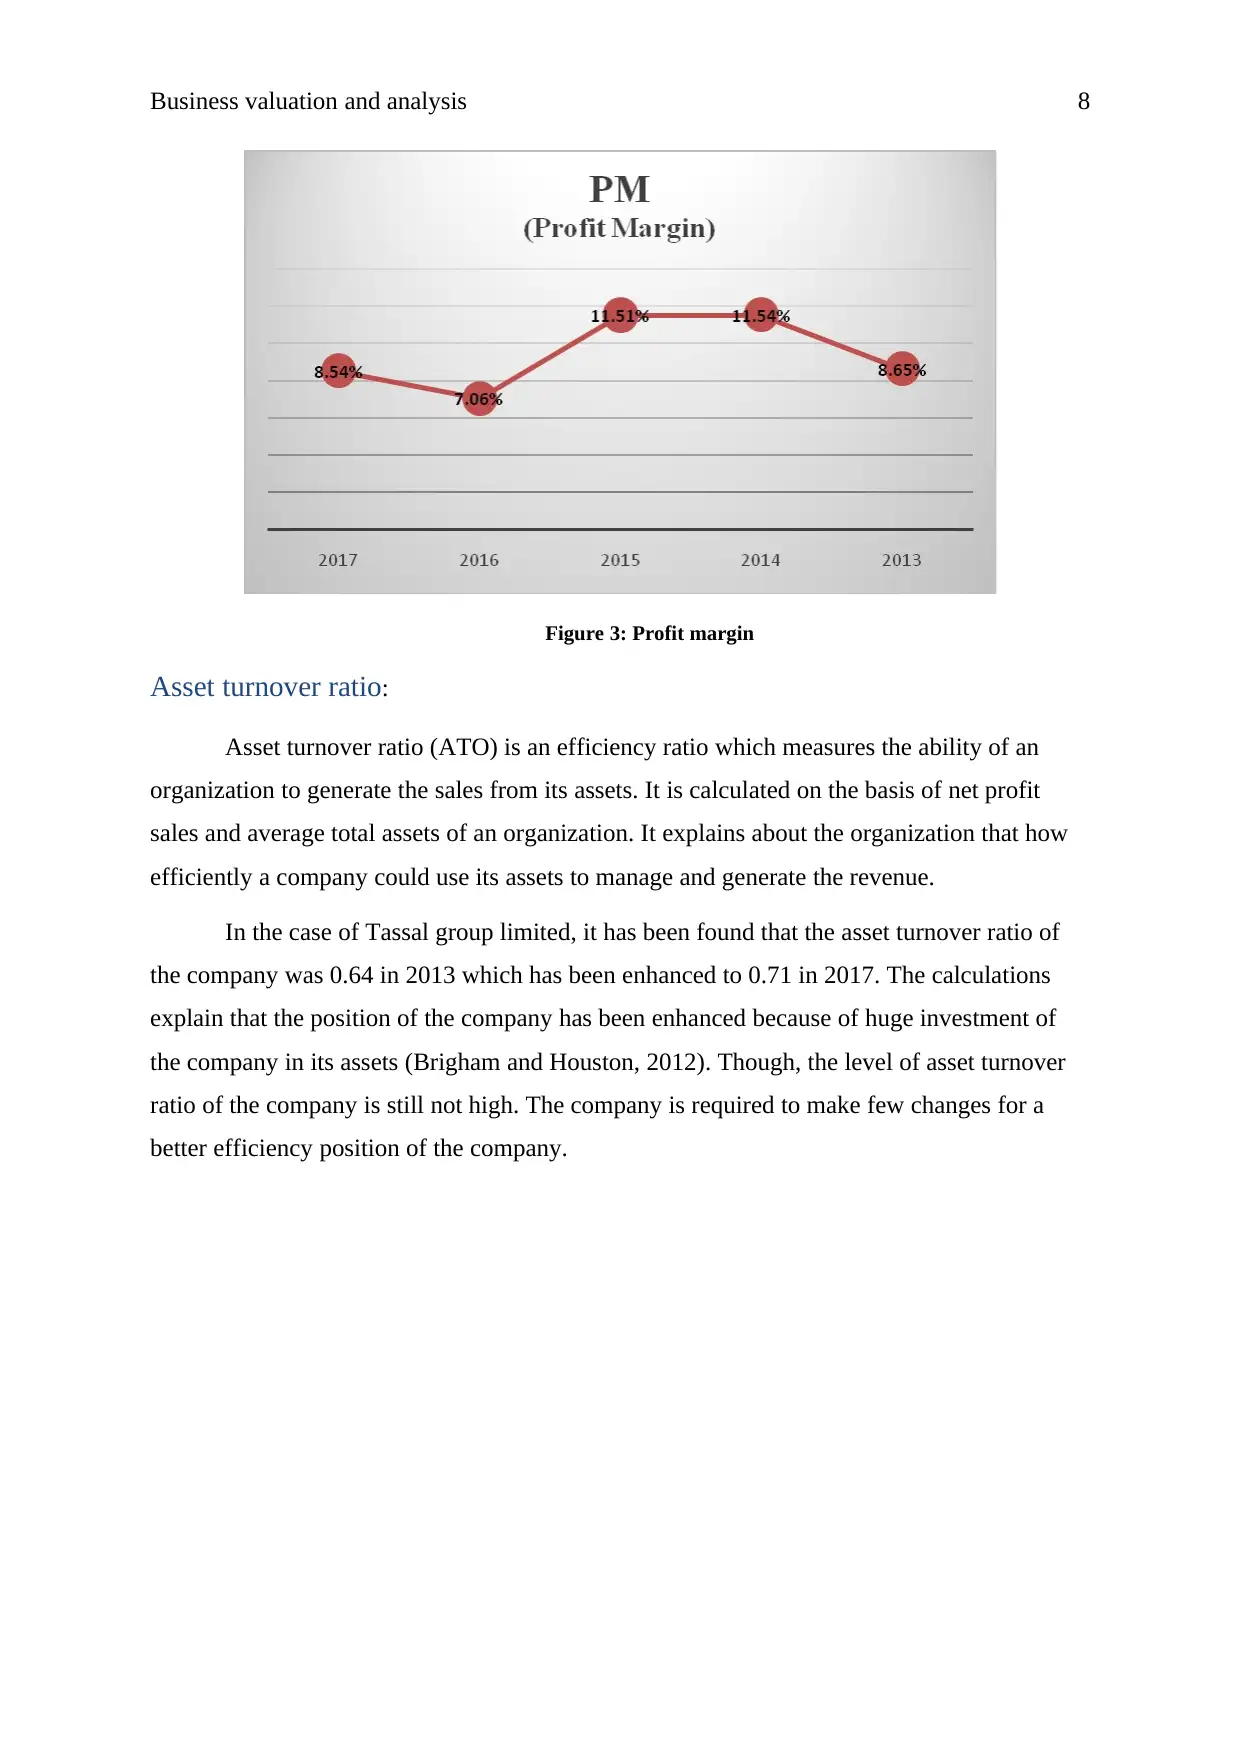
Profit margin (PM) is a profitability ratio which is used to recognize the profit margin
of the company against the total revenue of the company. It is calculated on the basis of net
profit after tax and total sales revenue of an organization. It explains about the total % of
sales which is returned back to the company as net income (Annual Report, 2016).
In the case of Tassal group limited, it has been found that the profit margin of the
company was 8.65% in 2013 which has been reduced to 8.54% in 2017. The calculations
explain that the differences have occurred due to high operating expenses of the company in
last 3 years (Brooks, 2015). Though, the level of sales revenue has also been enhanced and it
has managed the profit level of the company. However, the company is required to maintain a
good position of net profit to manage the performance of the company.
Figure 2 Return on non operating assets
Profit margin:
Profit margin (PM) is a profitability ratio which is used to recognize the profit margin
of the company against the total revenue of the company. It is calculated on the basis of net
profit after tax and total sales revenue of an organization. It explains about the total % of
sales which is returned back to the company as net income (Annual Report, 2016).
In the case of Tassal group limited, it has been found that the profit margin of the
company was 8.65% in 2013 which has been reduced to 8.54% in 2017. The calculations
explain that the differences have occurred due to high operating expenses of the company in
last 3 years (Brooks, 2015). Though, the level of sales revenue has also been enhanced and it
has managed the profit level of the company. However, the company is required to maintain a
good position of net profit to manage the performance of the company.
Paraphrase This Document
Need a fresh take? Get an instant paraphrase of this document with our AI Paraphraser
Business valuation and analysis 8
Figure 3: Profit margin
Asset turnover ratio:
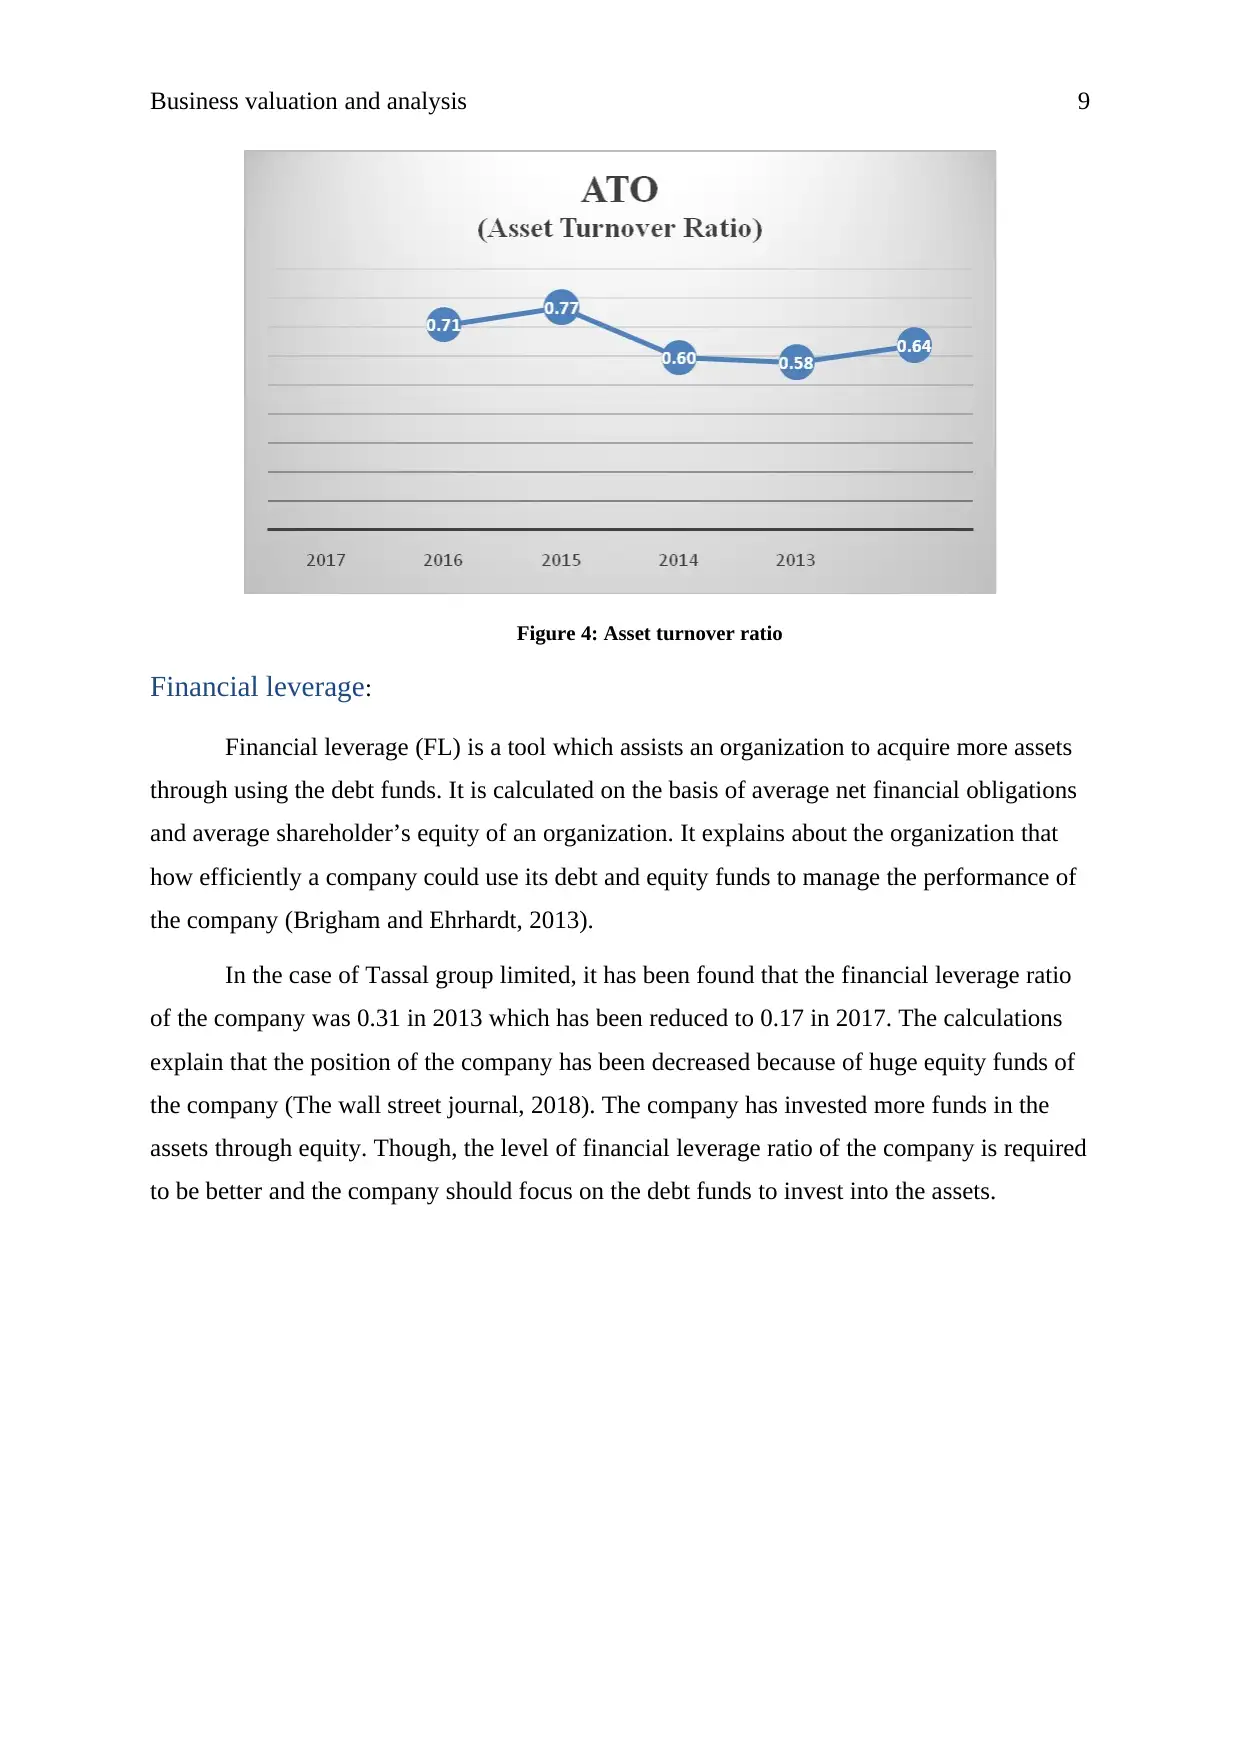
Asset turnover ratio (ATO) is an efficiency ratio which measures the ability of an
organization to generate the sales from its assets. It is calculated on the basis of net profit
sales and average total assets of an organization. It explains about the organization that how
efficiently a company could use its assets to manage and generate the revenue.
In the case of Tassal group limited, it has been found that the asset turnover ratio of
the company was 0.64 in 2013 which has been enhanced to 0.71 in 2017. The calculations
explain that the position of the company has been enhanced because of huge investment of
the company in its assets (Brigham and Houston, 2012). Though, the level of asset turnover
ratio of the company is still not high. The company is required to make few changes for a
better efficiency position of the company.
Figure 3: Profit margin
Asset turnover ratio:
Asset turnover ratio (ATO) is an efficiency ratio which measures the ability of an
organization to generate the sales from its assets. It is calculated on the basis of net profit
sales and average total assets of an organization. It explains about the organization that how
efficiently a company could use its assets to manage and generate the revenue.
In the case of Tassal group limited, it has been found that the asset turnover ratio of
the company was 0.64 in 2013 which has been enhanced to 0.71 in 2017. The calculations
explain that the position of the company has been enhanced because of huge investment of
the company in its assets (Brigham and Houston, 2012). Though, the level of asset turnover
ratio of the company is still not high. The company is required to make few changes for a
better efficiency position of the company.
Business valuation and analysis 9
Figure 4: Asset turnover ratio
Financial leverage:
Financial leverage (FL) is a tool which assists an organization to acquire more assets
through using the debt funds. It is calculated on the basis of average net financial obligations
and average shareholder’s equity of an organization. It explains about the organization that
how efficiently a company could use its debt and equity funds to manage the performance of
the company (Brigham and Ehrhardt, 2013).
In the case of Tassal group limited, it has been found that the financial leverage ratio
of the company was 0.31 in 2013 which has been reduced to 0.17 in 2017. The calculations
explain that the position of the company has been decreased because of huge equity funds of
the company (The wall street journal, 2018). The company has invested more funds in the
assets through equity. Though, the level of financial leverage ratio of the company is required
to be better and the company should focus on the debt funds to invest into the assets.
⊘ This is a preview!⊘
Do you want full access?
Subscribe today to unlock all pages.
Trusted by 1+ million students worldwide
Business valuation and analysis 10
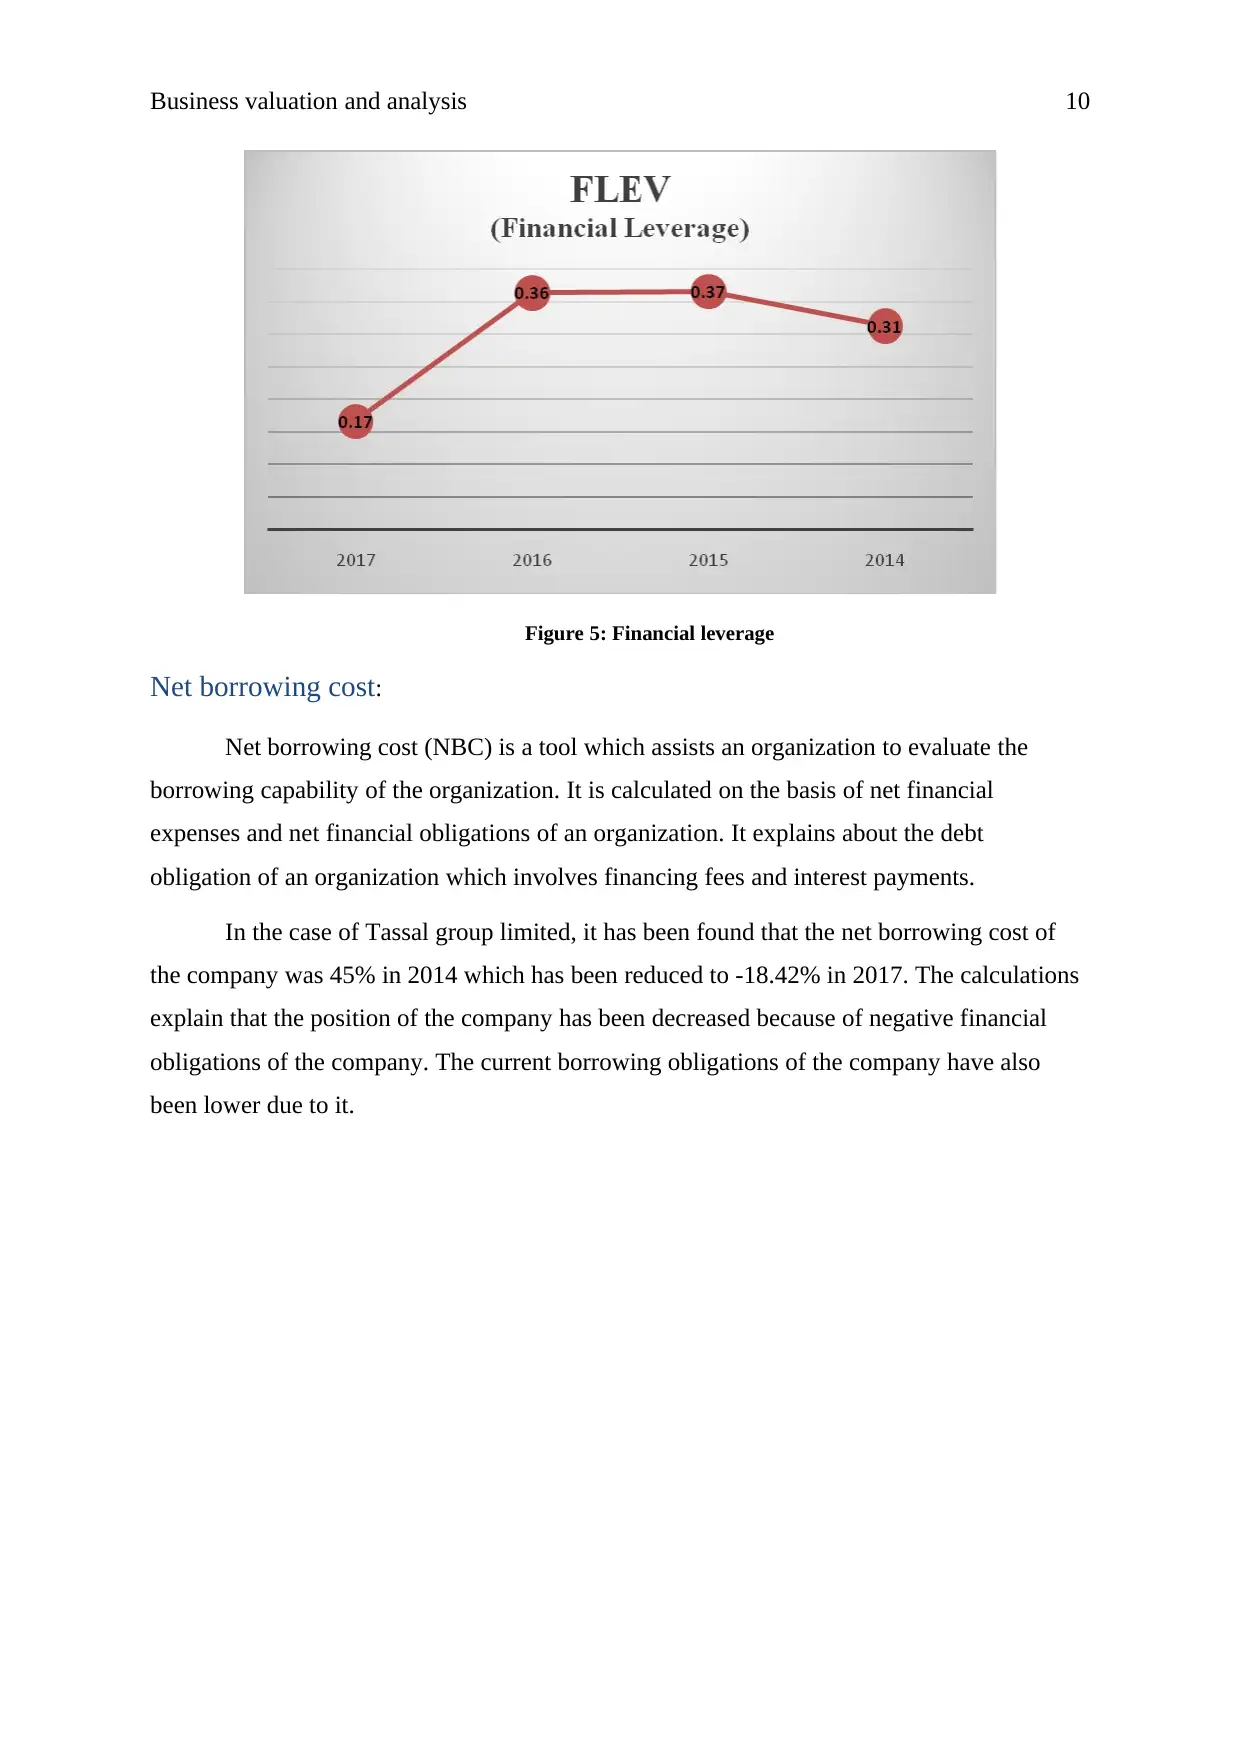
Figure 5: Financial leverage
Net borrowing cost:
Net borrowing cost (NBC) is a tool which assists an organization to evaluate the
borrowing capability of the organization. It is calculated on the basis of net financial
expenses and net financial obligations of an organization. It explains about the debt
obligation of an organization which involves financing fees and interest payments.
In the case of Tassal group limited, it has been found that the net borrowing cost of
the company was 45% in 2014 which has been reduced to -18.42% in 2017. The calculations
explain that the position of the company has been decreased because of negative financial
obligations of the company. The current borrowing obligations of the company have also
been lower due to it.
Figure 5: Financial leverage
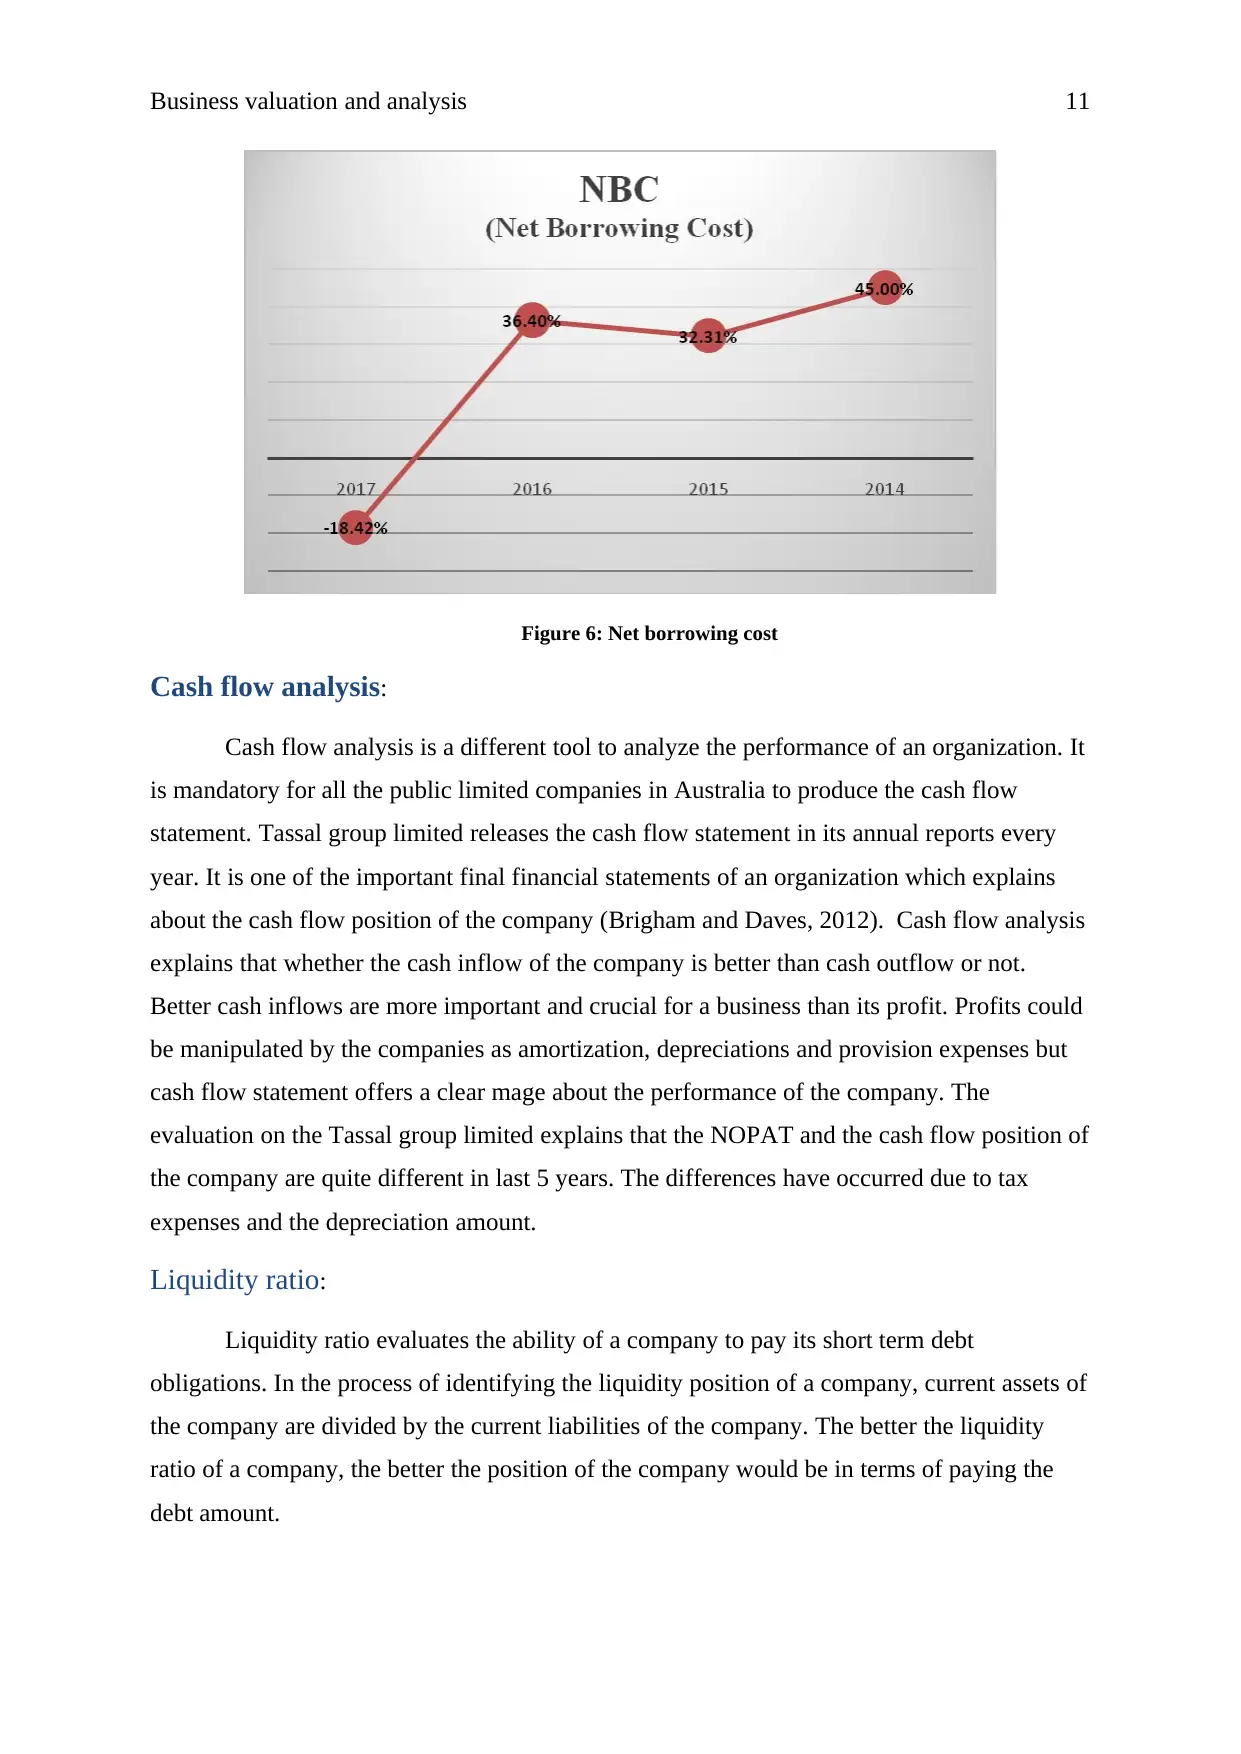
Net borrowing cost:
Net borrowing cost (NBC) is a tool which assists an organization to evaluate the
borrowing capability of the organization. It is calculated on the basis of net financial
expenses and net financial obligations of an organization. It explains about the debt
obligation of an organization which involves financing fees and interest payments.
In the case of Tassal group limited, it has been found that the net borrowing cost of
the company was 45% in 2014 which has been reduced to -18.42% in 2017. The calculations
explain that the position of the company has been decreased because of negative financial
obligations of the company. The current borrowing obligations of the company have also
been lower due to it.
Paraphrase This Document
Need a fresh take? Get an instant paraphrase of this document with our AI Paraphraser
Business valuation and analysis 11
Figure 6: Net borrowing cost
Cash flow analysis:
Cash flow analysis is a different tool to analyze the performance of an organization. It
is mandatory for all the public limited companies in Australia to produce the cash flow
statement. Tassal group limited releases the cash flow statement in its annual reports every
year. It is one of the important final financial statements of an organization which explains
about the cash flow position of the company (Brigham and Daves, 2012). Cash flow analysis
explains that whether the cash inflow of the company is better than cash outflow or not.
Better cash inflows are more important and crucial for a business than its profit. Profits could
be manipulated by the companies as amortization, depreciations and provision expenses but
cash flow statement offers a clear mage about the performance of the company. The
evaluation on the Tassal group limited explains that the NOPAT and the cash flow position of
the company are quite different in last 5 years. The differences have occurred due to tax
expenses and the depreciation amount.
Liquidity ratio:
Liquidity ratio evaluates the ability of a company to pay its short term debt
obligations. In the process of identifying the liquidity position of a company, current assets of
the company are divided by the current liabilities of the company. The better the liquidity
ratio of a company, the better the position of the company would be in terms of paying the
debt amount.
Business valuation and analysis 12
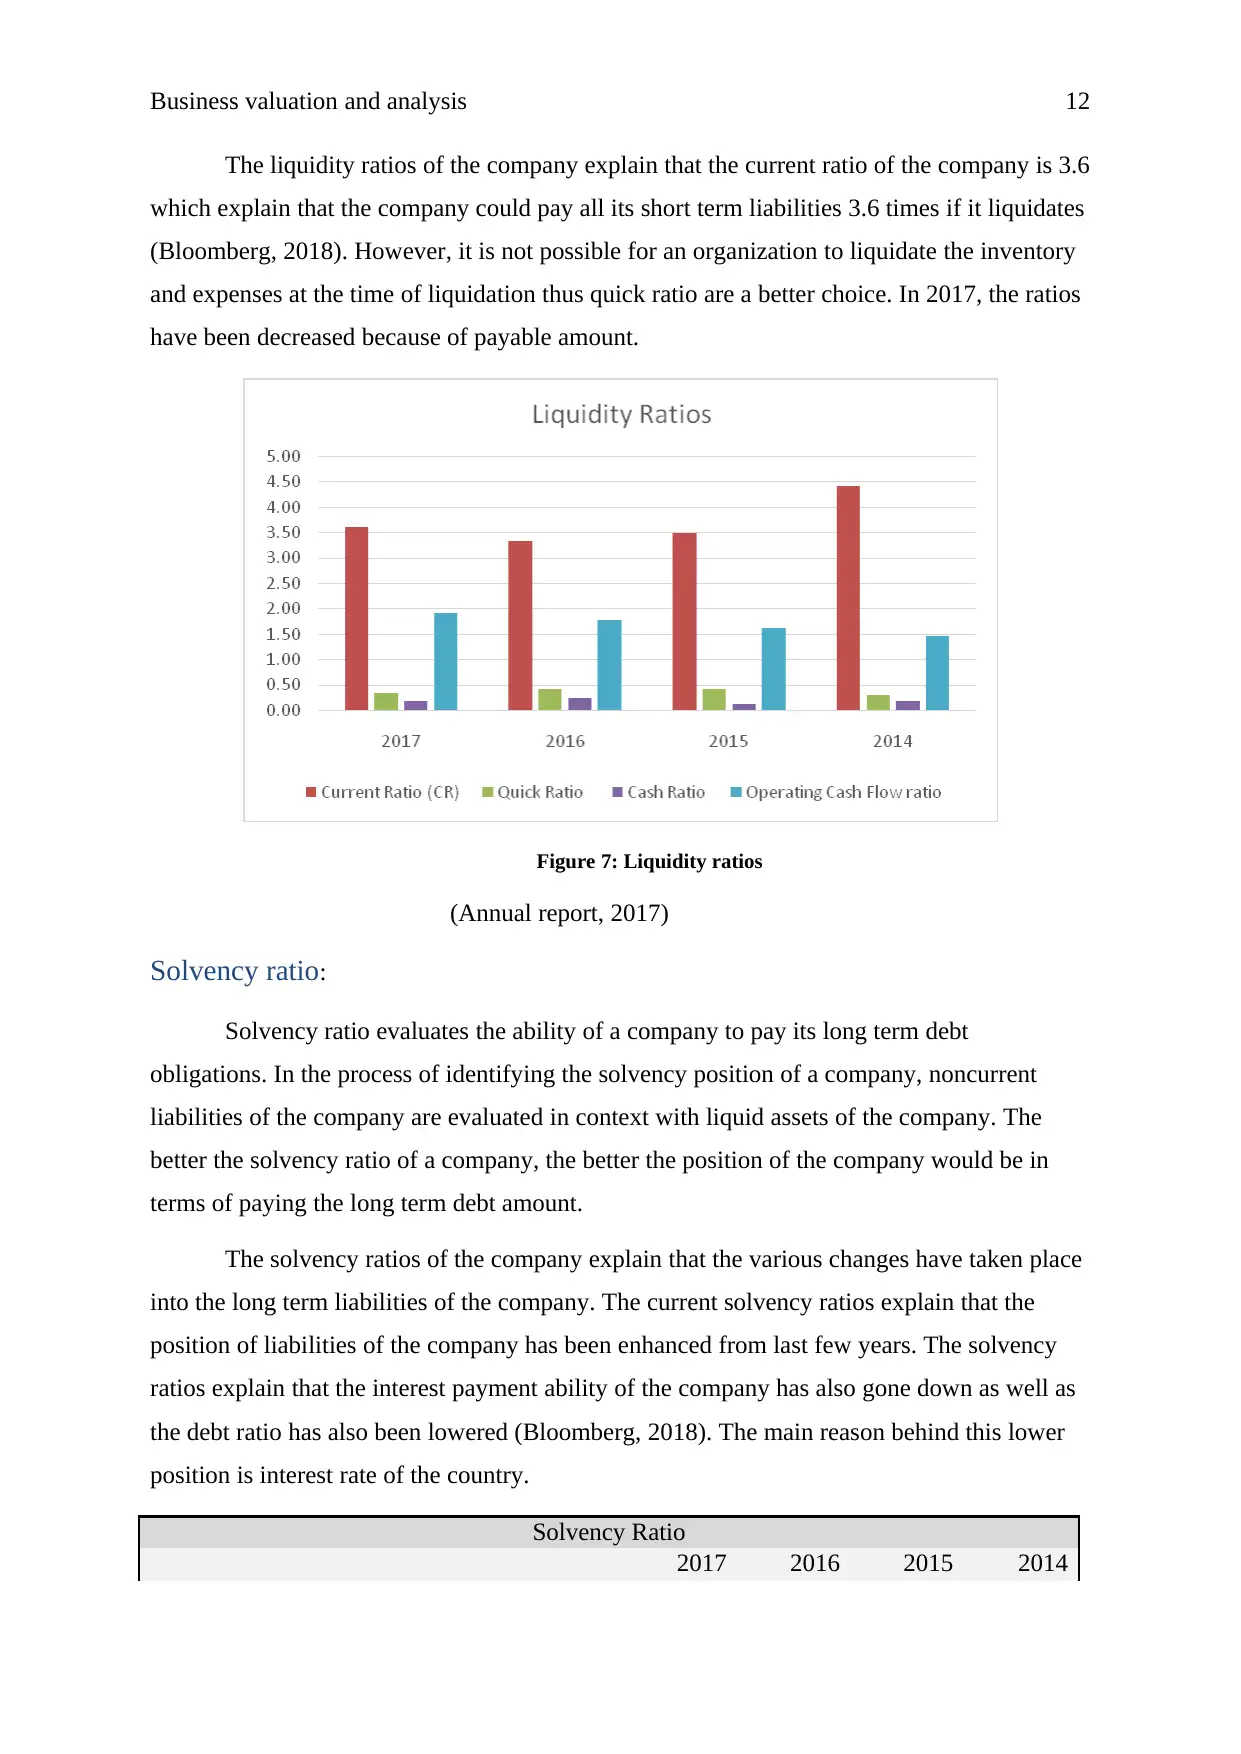
The liquidity ratios of the company explain that the current ratio of the company is 3.6
which explain that the company could pay all its short term liabilities 3.6 times if it liquidates
(Bloomberg, 2018). However, it is not possible for an organization to liquidate the inventory
and expenses at the time of liquidation thus quick ratio are a better choice. In 2017, the ratios
have been decreased because of payable amount.
Figure 7: Liquidity ratios
(Annual report, 2017)
Solvency ratio:
Solvency ratio evaluates the ability of a company to pay its long term debt
obligations. In the process of identifying the solvency position of a company, noncurrent
liabilities of the company are evaluated in context with liquid assets of the company. The
better the solvency ratio of a company, the better the position of the company would be in
terms of paying the long term debt amount.
The solvency ratios of the company explain that the various changes have taken place
into the long term liabilities of the company. The current solvency ratios explain that the
position of liabilities of the company has been enhanced from last few years. The solvency
ratios explain that the interest payment ability of the company has also gone down as well as
the debt ratio has also been lowered (Bloomberg, 2018). The main reason behind this lower
position is interest rate of the country.
Solvency Ratio
2017 2016 2015 2014
⊘ This is a preview!⊘
Do you want full access?
Subscribe today to unlock all pages.
Trusted by 1+ million students worldwide
1 out of 17
Related Documents


Your All-in-One AI-Powered Toolkit for Academic Success.
+13062052269
info@desklib.com
Available 24*7 on WhatsApp / Email
![[object Object]](/_next/static/media/star-bottom.7253800d.svg)
Unlock your academic potential
Copyright © 2020–2026 A2Z Services. All Rights Reserved. Developed and managed by ZUCOL.