Financial Analysis Report: Telstra Corporation Limited Evaluation
VerifiedAdded on 2020/05/11
|17
|3644
|64
Project
AI Summary
This project report provides a financial analysis of Telstra Corporation Limited, a major telecommunications company in Australia. The report examines Telstra's financial performance through various lenses, including debt valuation, share valuation, and cost of capital. It delves into the company's debt structure, comparing it to industry averages and calculating the cost of debt. The share valuation section assesses the cost of equity and explores intrinsic value using dividend discount and PE multiple models, offering insights into the company's stock valuation. Furthermore, the report calculates the Weighted Average Cost of Capital (WACC), considering both debt and equity, and analyzes the company's capital structure. Finally, the report concludes with a market analysis, highlighting Telstra's leadership position in the telecommunications industry and providing recommendations for optimal capital structure to enhance financial performance and attract investors.
Running Head: Accounting and Finance
1
Project Report: Introduction to Accounting and Finance
1
Project Report: Introduction to Accounting and Finance
Paraphrase This Document
Need a fresh take? Get an instant paraphrase of this document with our AI Paraphraser
Accounting and Finance
2
Contents
Introduction.......................................................................................................................3
TELSTRA CORPORATION Limited..............................................................................3
Debt valuation...................................................................................................................3
Share valuation.................................................................................................................5
Cost of capital...................................................................................................................6
Market analysis.................................................................................................................8
References.......................................................................................................................10
Appendix.........................................................................................................................11
Accounting and Finance
3
Introduction:
It is obligatory for every human being, character and shareholder to evaluate the
condition of the market and deposit the money into the security or financial market according
to the various changes such as fluctuations in the market, company’s internal position and
external position, performance of the comapny in terms of finance, state of the stability of the
comapny, comapny various micro and macro factors etc. For identifying the above explained
elements, an entity must take the assistance of financial analyst. Being a consultant, Telstra
Corporation limited has been evaluated to express the investor or individual about the
company’s performance and the opportunity of investment in the TELSTRA
CORPORATION LIMITED. This analysis and paper expresses the result on the basis of
various tools such as debt valuation, securities valuation, analysis of the market, cost of
capital etc. the paper has been made to express the investment prospect in TELSTRA
CORPORATION LIMITED to the share holders and debt holders.
TELSTRA CORPORATION Limited:
This report depicts the investors about the TELSTRA CORPORATION. This
company is recognized as the biggest companies in the Australian market in the industry of
telecommunication and Media. This company develops and runs its activities in the business
of mobile network, internet access, telecommunication networks and numerous other services
of entertainment. The main office of the company is at Melbourne, Australia. Comapny runs
its activities and main operations from there only. The main objective of TELSTRA
CORPORATION is to extend the position of company’s services and products as the biggest
service and products provider of IT (information and technology) in the Australian market
(Our Company.2017). In 1901, this business has come into existence. This company is
frequently increasing its functions and operations through various practices and activities.
Debt valuation:
TELSTRA CORPORATION LIMITED has been examined in terms of finance on the
basis of the debts in this study. Debt valuations study depicts the investor about the
performance and the financial strength of the comapny. The study over the debt valuation of
TELSTRA CORPORATION LIMITED depict that the short term of the comapny is $ 2369
million which has been raised through the bank overdraft and by issuing some debts for the
short term whereas the long term debt has been raised through issuing the debts for a long
⊘ This is a preview!⊘
Do you want full access?
Subscribe today to unlock all pages.
Trusted by 1+ million students worldwide
Accounting and Finance
4
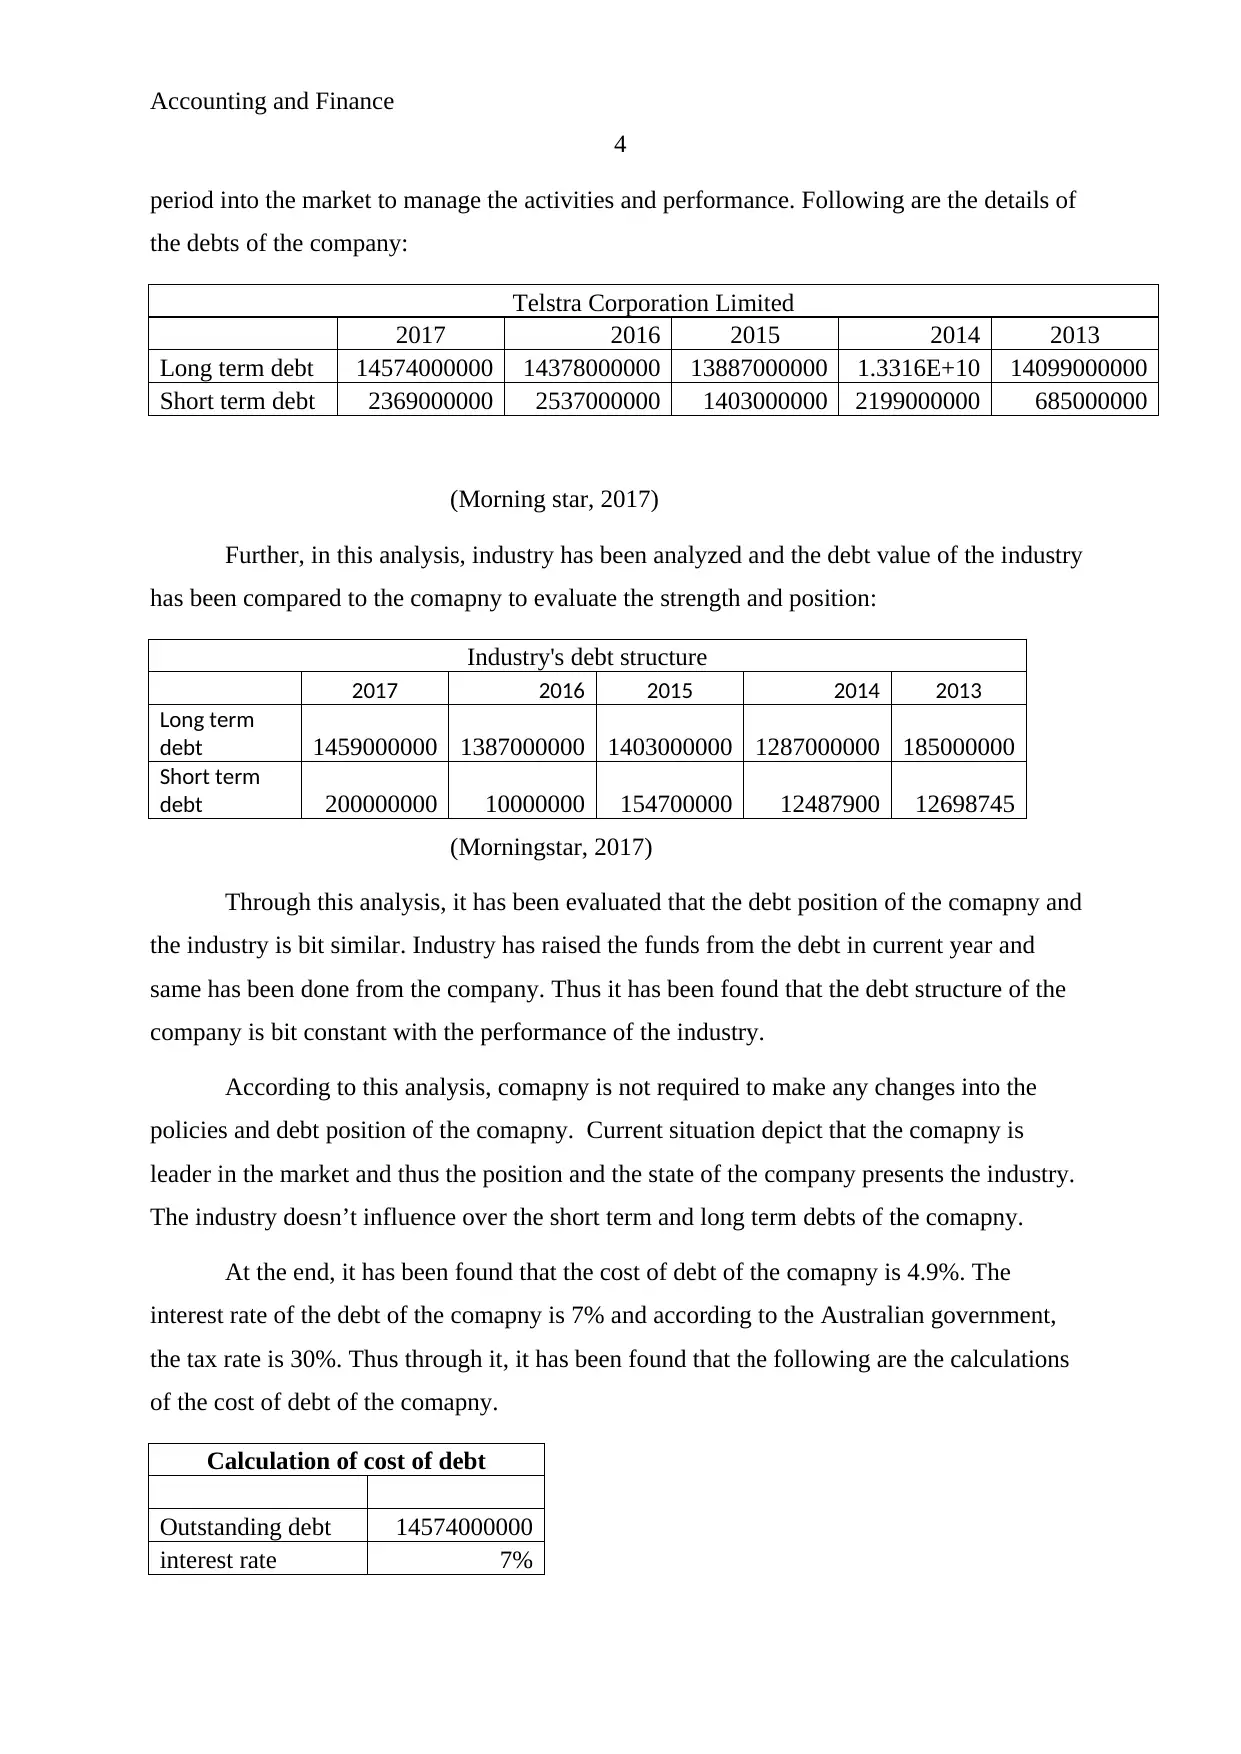
period into the market to manage the activities and performance. Following are the details of
the debts of the company:
Telstra Corporation Limited
2017 2016 2015 2014 2013
Long term debt 14574000000 14378000000 13887000000 1.3316E+10 14099000000
Short term debt 2369000000 2537000000 1403000000 2199000000 685000000
(Morning star, 2017)
Further, in this analysis, industry has been analyzed and the debt value of the industry
has been compared to the comapny to evaluate the strength and position:
Industry's debt structure
2017 2016 2015 2014 2013
Long term
debt 1459000000 1387000000 1403000000 1287000000 185000000
Short term
debt 200000000 10000000 154700000 12487900 12698745
(Morningstar, 2017)
Through this analysis, it has been evaluated that the debt position of the comapny and
the industry is bit similar. Industry has raised the funds from the debt in current year and
same has been done from the company. Thus it has been found that the debt structure of the
company is bit constant with the performance of the industry.
According to this analysis, comapny is not required to make any changes into the
policies and debt position of the comapny. Current situation depict that the comapny is
leader in the market and thus the position and the state of the company presents the industry.
The industry doesn’t influence over the short term and long term debts of the comapny.
At the end, it has been found that the cost of debt of the comapny is 4.9%. The
interest rate of the debt of the comapny is 7% and according to the Australian government,
the tax rate is 30%. Thus through it, it has been found that the following are the calculations
of the cost of debt of the comapny.
Calculation of cost of debt
Outstanding debt 14574000000
interest rate 7%
4
period into the market to manage the activities and performance. Following are the details of
the debts of the company:
Telstra Corporation Limited
2017 2016 2015 2014 2013
Long term debt 14574000000 14378000000 13887000000 1.3316E+10 14099000000
Short term debt 2369000000 2537000000 1403000000 2199000000 685000000
(Morning star, 2017)
Further, in this analysis, industry has been analyzed and the debt value of the industry
has been compared to the comapny to evaluate the strength and position:
Industry's debt structure
2017 2016 2015 2014 2013
Long term
debt 1459000000 1387000000 1403000000 1287000000 185000000
Short term
debt 200000000 10000000 154700000 12487900 12698745
(Morningstar, 2017)
Through this analysis, it has been evaluated that the debt position of the comapny and
the industry is bit similar. Industry has raised the funds from the debt in current year and
same has been done from the company. Thus it has been found that the debt structure of the
company is bit constant with the performance of the industry.
According to this analysis, comapny is not required to make any changes into the
policies and debt position of the comapny. Current situation depict that the comapny is
leader in the market and thus the position and the state of the company presents the industry.
The industry doesn’t influence over the short term and long term debts of the comapny.
At the end, it has been found that the cost of debt of the comapny is 4.9%. The
interest rate of the debt of the comapny is 7% and according to the Australian government,
the tax rate is 30%. Thus through it, it has been found that the following are the calculations
of the cost of debt of the comapny.
Calculation of cost of debt
Outstanding debt 14574000000
interest rate 7%
Paraphrase This Document
Need a fresh take? Get an instant paraphrase of this document with our AI Paraphraser
Accounting and Finance
5
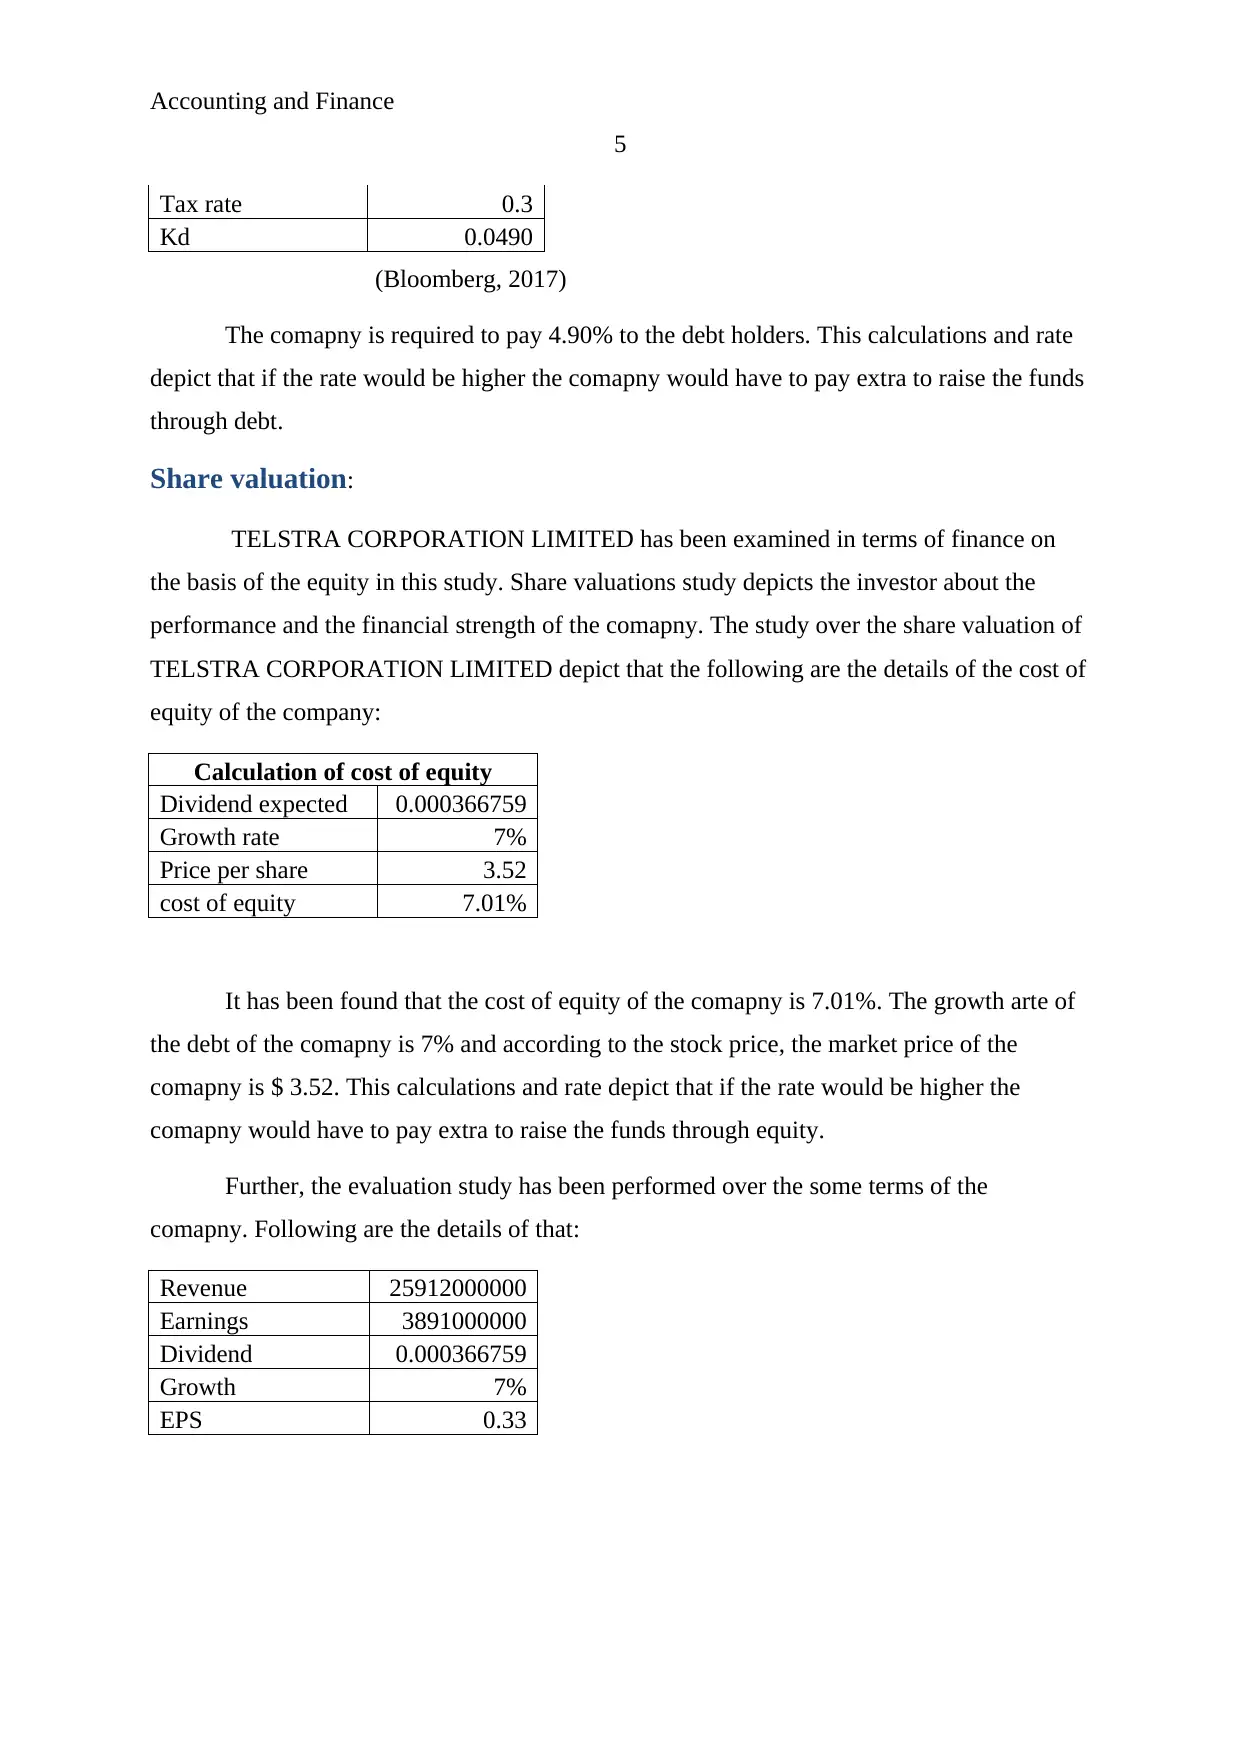
Tax rate 0.3
Kd 0.0490
(Bloomberg, 2017)
The comapny is required to pay 4.90% to the debt holders. This calculations and rate
depict that if the rate would be higher the comapny would have to pay extra to raise the funds
through debt.
Share valuation:
TELSTRA CORPORATION LIMITED has been examined in terms of finance on
the basis of the equity in this study. Share valuations study depicts the investor about the
performance and the financial strength of the comapny. The study over the share valuation of
TELSTRA CORPORATION LIMITED depict that the following are the details of the cost of
equity of the company:
Calculation of cost of equity
Dividend expected 0.000366759
Growth rate 7%
Price per share 3.52
cost of equity 7.01%
It has been found that the cost of equity of the comapny is 7.01%. The growth arte of
the debt of the comapny is 7% and according to the stock price, the market price of the
comapny is $ 3.52. This calculations and rate depict that if the rate would be higher the
comapny would have to pay extra to raise the funds through equity.
Further, the evaluation study has been performed over the some terms of the
comapny. Following are the details of that:
Revenue 25912000000
Earnings 3891000000
Dividend 0.000366759
Growth 7%
EPS 0.33
5
Tax rate 0.3
Kd 0.0490
(Bloomberg, 2017)
The comapny is required to pay 4.90% to the debt holders. This calculations and rate
depict that if the rate would be higher the comapny would have to pay extra to raise the funds
through debt.
Share valuation:
TELSTRA CORPORATION LIMITED has been examined in terms of finance on
the basis of the equity in this study. Share valuations study depicts the investor about the
performance and the financial strength of the comapny. The study over the share valuation of
TELSTRA CORPORATION LIMITED depict that the following are the details of the cost of
equity of the company:
Calculation of cost of equity
Dividend expected 0.000366759
Growth rate 7%
Price per share 3.52
cost of equity 7.01%
It has been found that the cost of equity of the comapny is 7.01%. The growth arte of
the debt of the comapny is 7% and according to the stock price, the market price of the
comapny is $ 3.52. This calculations and rate depict that if the rate would be higher the
comapny would have to pay extra to raise the funds through equity.
Further, the evaluation study has been performed over the some terms of the
comapny. Following are the details of that:
Revenue 25912000000
Earnings 3891000000
Dividend 0.000366759
Growth 7%
EPS 0.33
Accounting and Finance
6
This expresses that the performance of the comapny is becoming better day by day.
Through the calculations and analysis, it has been found that the performance of the comapny
is becoming more attractive in concern of the shareholders of the comapny.
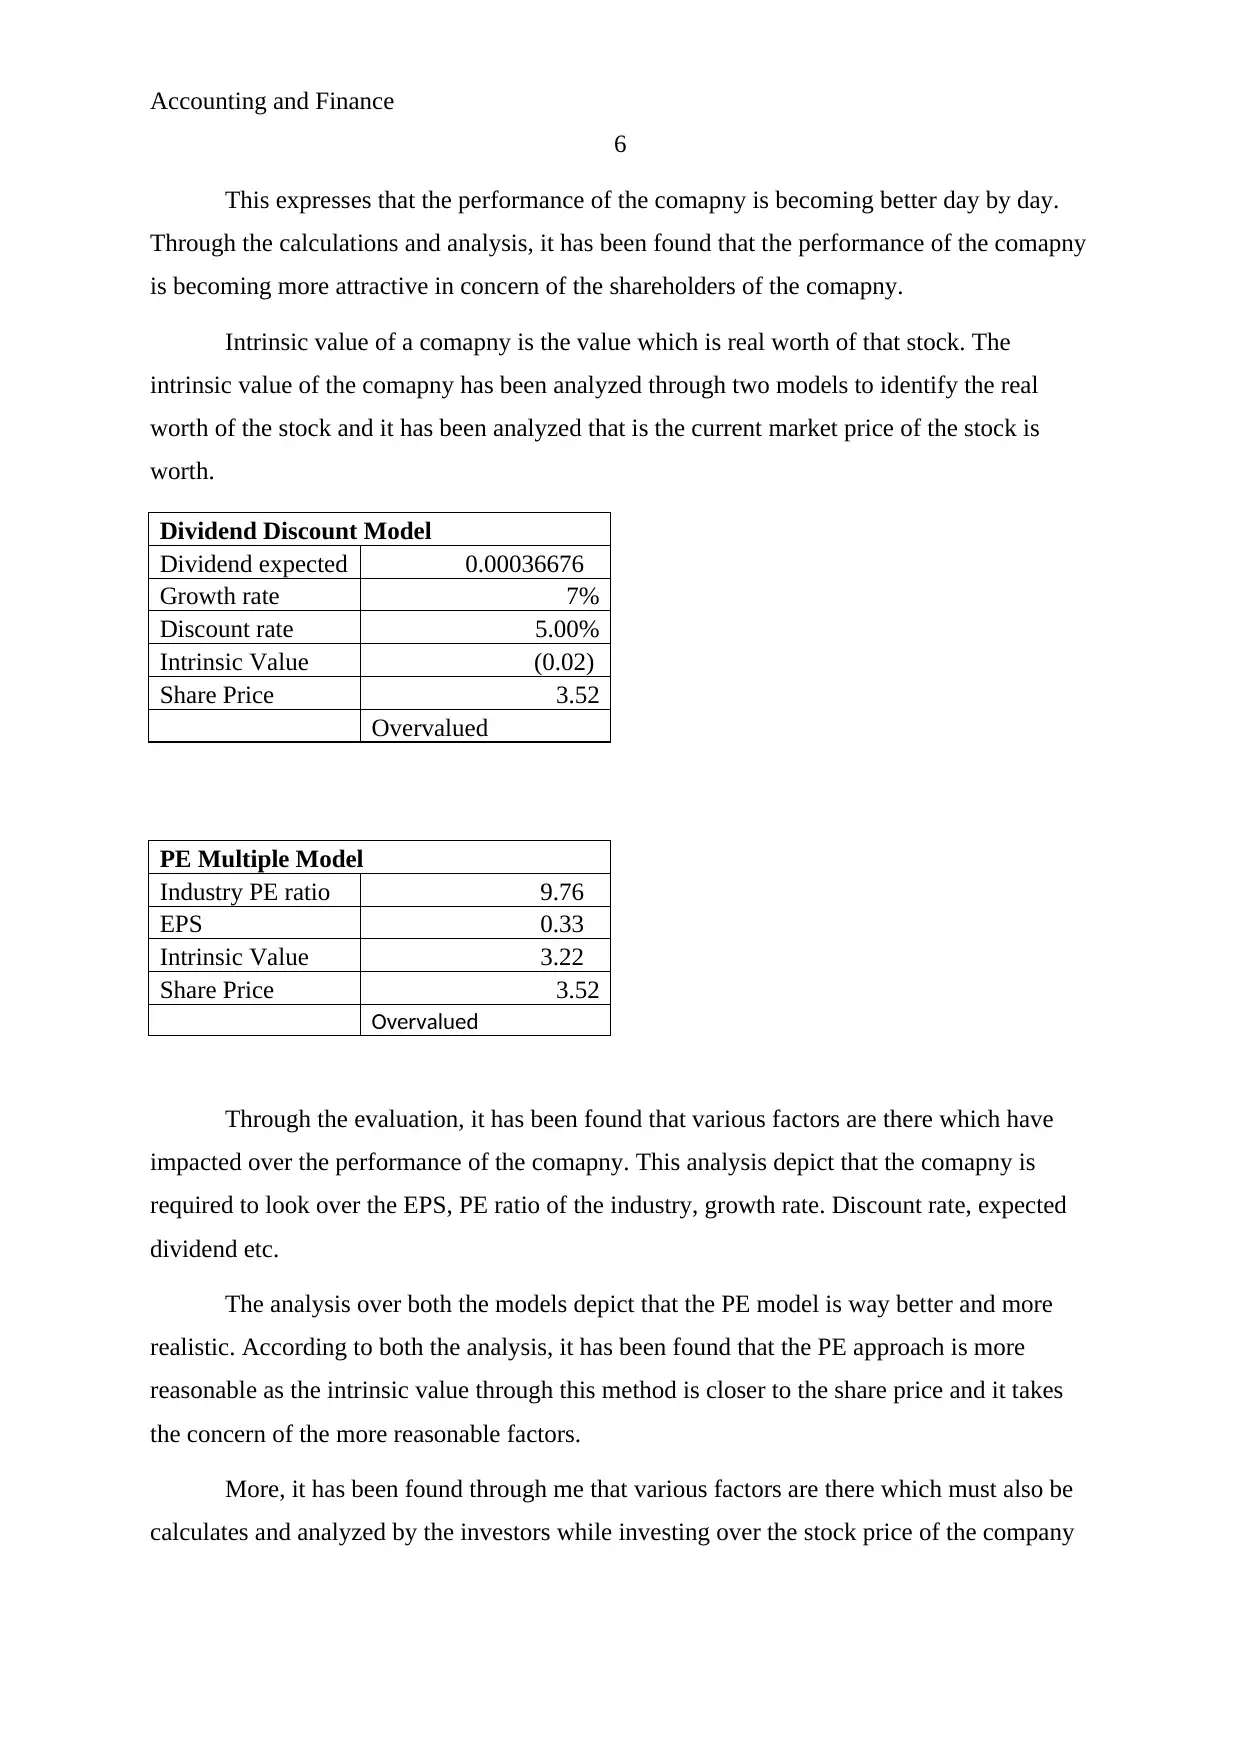
Intrinsic value of a comapny is the value which is real worth of that stock. The
intrinsic value of the comapny has been analyzed through two models to identify the real
worth of the stock and it has been analyzed that is the current market price of the stock is
worth.
Dividend Discount Model
Dividend expected 0.00036676
Growth rate 7%
Discount rate 5.00%
Intrinsic Value (0.02)
Share Price 3.52
Overvalued
PE Multiple Model
Industry PE ratio 9.76
EPS 0.33
Intrinsic Value 3.22
Share Price 3.52
Overvalued
Through the evaluation, it has been found that various factors are there which have
impacted over the performance of the comapny. This analysis depict that the comapny is
required to look over the EPS, PE ratio of the industry, growth rate. Discount rate, expected
dividend etc.
The analysis over both the models depict that the PE model is way better and more
realistic. According to both the analysis, it has been found that the PE approach is more
reasonable as the intrinsic value through this method is closer to the share price and it takes
the concern of the more reasonable factors.
More, it has been found through me that various factors are there which must also be
calculates and analyzed by the investors while investing over the stock price of the company
6
This expresses that the performance of the comapny is becoming better day by day.
Through the calculations and analysis, it has been found that the performance of the comapny
is becoming more attractive in concern of the shareholders of the comapny.
Intrinsic value of a comapny is the value which is real worth of that stock. The
intrinsic value of the comapny has been analyzed through two models to identify the real
worth of the stock and it has been analyzed that is the current market price of the stock is
worth.
Dividend Discount Model
Dividend expected 0.00036676
Growth rate 7%
Discount rate 5.00%
Intrinsic Value (0.02)
Share Price 3.52
Overvalued
PE Multiple Model
Industry PE ratio 9.76
EPS 0.33
Intrinsic Value 3.22
Share Price 3.52
Overvalued
Through the evaluation, it has been found that various factors are there which have
impacted over the performance of the comapny. This analysis depict that the comapny is
required to look over the EPS, PE ratio of the industry, growth rate. Discount rate, expected
dividend etc.
The analysis over both the models depict that the PE model is way better and more
realistic. According to both the analysis, it has been found that the PE approach is more
reasonable as the intrinsic value through this method is closer to the share price and it takes
the concern of the more reasonable factors.
More, it has been found through me that various factors are there which must also be
calculates and analyzed by the investors while investing over the stock price of the company
⊘ This is a preview!⊘
Do you want full access?
Subscribe today to unlock all pages.
Trusted by 1+ million students worldwide
Accounting and Finance
7
such as the fluctuations in the share price, dividend declaration, last 5 years’ performance of
the compact etc.
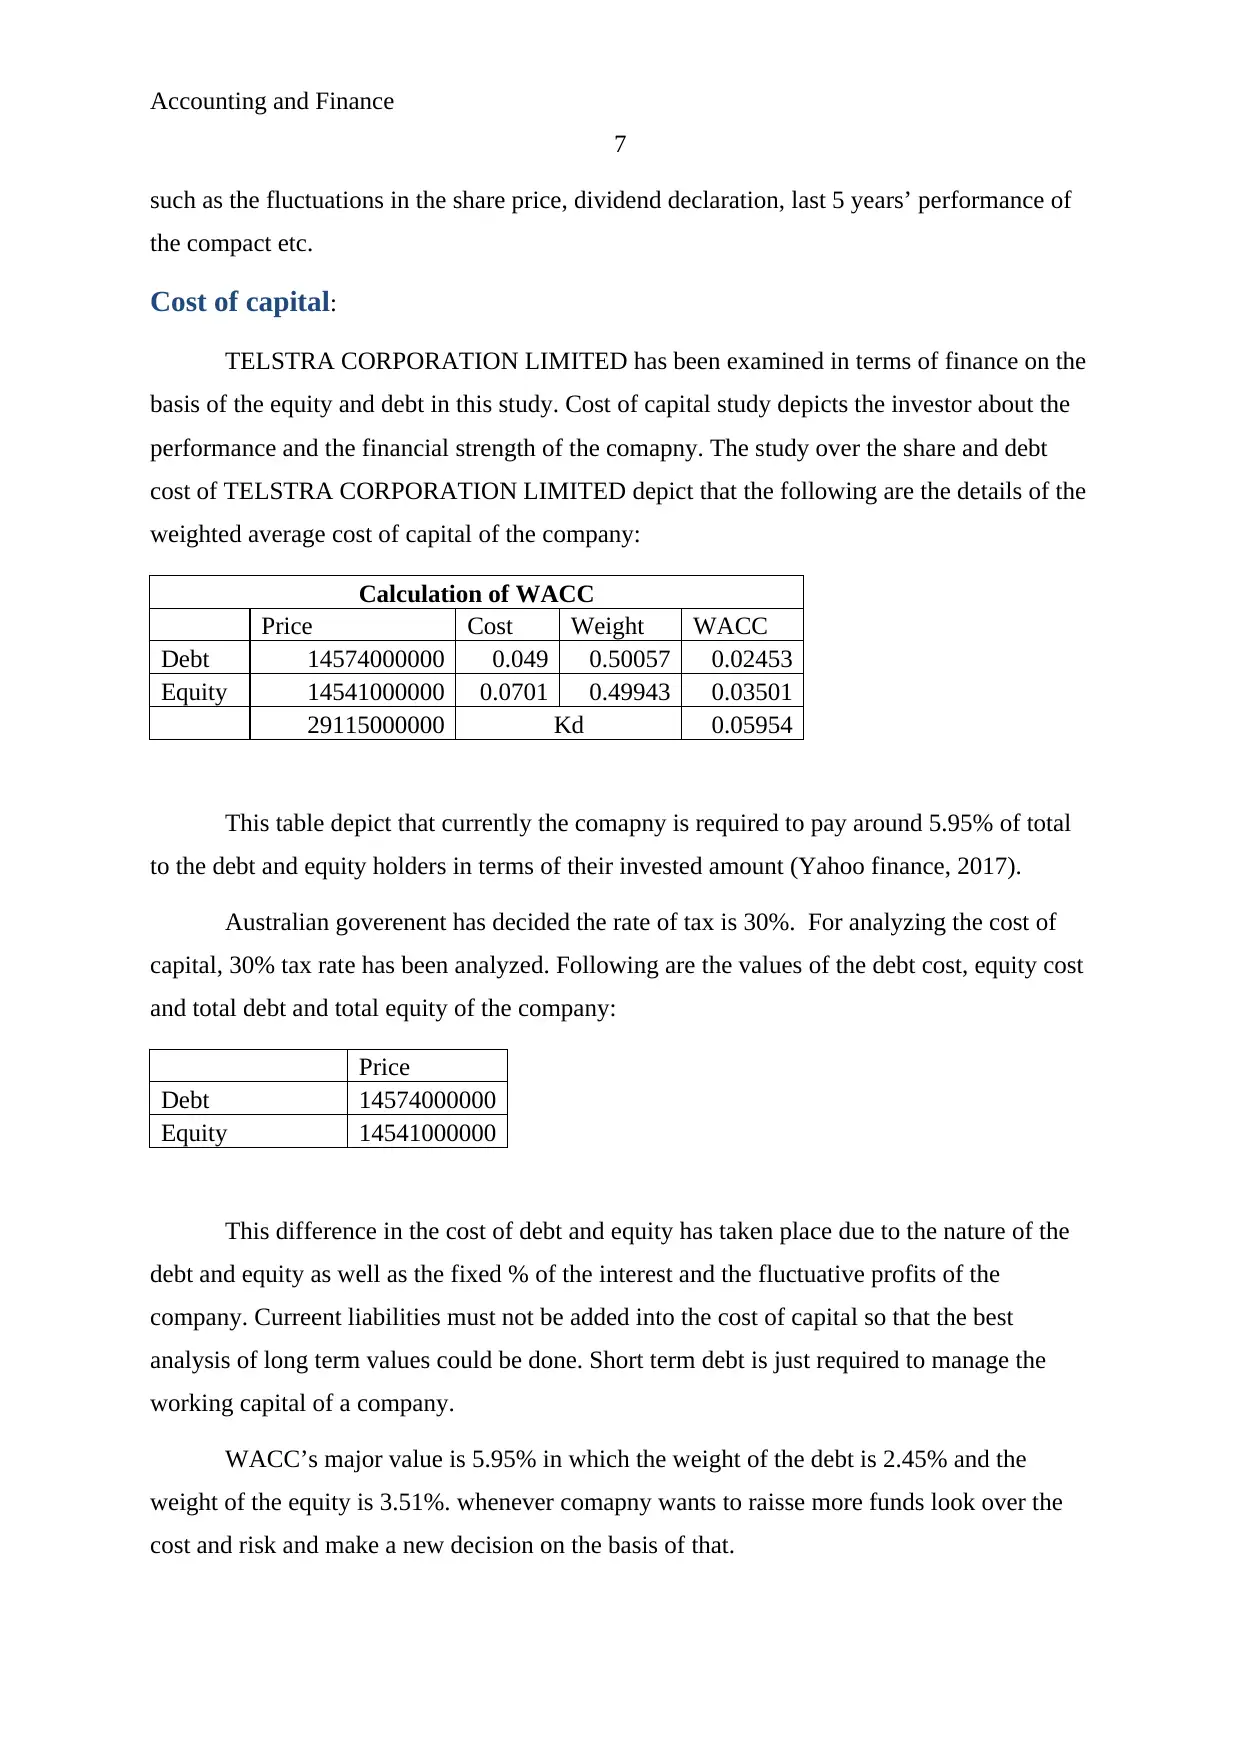
Cost of capital:
TELSTRA CORPORATION LIMITED has been examined in terms of finance on the
basis of the equity and debt in this study. Cost of capital study depicts the investor about the
performance and the financial strength of the comapny. The study over the share and debt
cost of TELSTRA CORPORATION LIMITED depict that the following are the details of the
weighted average cost of capital of the company:
Calculation of WACC
Price Cost Weight WACC
Debt 14574000000 0.049 0.50057 0.02453
Equity 14541000000 0.0701 0.49943 0.03501
29115000000 Kd 0.05954
This table depict that currently the comapny is required to pay around 5.95% of total
to the debt and equity holders in terms of their invested amount (Yahoo finance, 2017).
Australian goverenent has decided the rate of tax is 30%. For analyzing the cost of
capital, 30% tax rate has been analyzed. Following are the values of the debt cost, equity cost
and total debt and total equity of the company:
Price
Debt 14574000000
Equity 14541000000
This difference in the cost of debt and equity has taken place due to the nature of the
debt and equity as well as the fixed % of the interest and the fluctuative profits of the
company. Curreent liabilities must not be added into the cost of capital so that the best
analysis of long term values could be done. Short term debt is just required to manage the
working capital of a company.
WACC’s major value is 5.95% in which the weight of the debt is 2.45% and the
weight of the equity is 3.51%. whenever comapny wants to raisse more funds look over the
cost and risk and make a new decision on the basis of that.
7
such as the fluctuations in the share price, dividend declaration, last 5 years’ performance of
the compact etc.
Cost of capital:
TELSTRA CORPORATION LIMITED has been examined in terms of finance on the
basis of the equity and debt in this study. Cost of capital study depicts the investor about the
performance and the financial strength of the comapny. The study over the share and debt
cost of TELSTRA CORPORATION LIMITED depict that the following are the details of the
weighted average cost of capital of the company:
Calculation of WACC
Price Cost Weight WACC
Debt 14574000000 0.049 0.50057 0.02453
Equity 14541000000 0.0701 0.49943 0.03501
29115000000 Kd 0.05954
This table depict that currently the comapny is required to pay around 5.95% of total
to the debt and equity holders in terms of their invested amount (Yahoo finance, 2017).
Australian goverenent has decided the rate of tax is 30%. For analyzing the cost of
capital, 30% tax rate has been analyzed. Following are the values of the debt cost, equity cost
and total debt and total equity of the company:
Price
Debt 14574000000
Equity 14541000000
This difference in the cost of debt and equity has taken place due to the nature of the
debt and equity as well as the fixed % of the interest and the fluctuative profits of the
company. Curreent liabilities must not be added into the cost of capital so that the best
analysis of long term values could be done. Short term debt is just required to manage the
working capital of a company.
WACC’s major value is 5.95% in which the weight of the debt is 2.45% and the
weight of the equity is 3.51%. whenever comapny wants to raisse more funds look over the
cost and risk and make a new decision on the basis of that.
Paraphrase This Document
Need a fresh take? Get an instant paraphrase of this document with our AI Paraphraser
Accounting and Finance
8
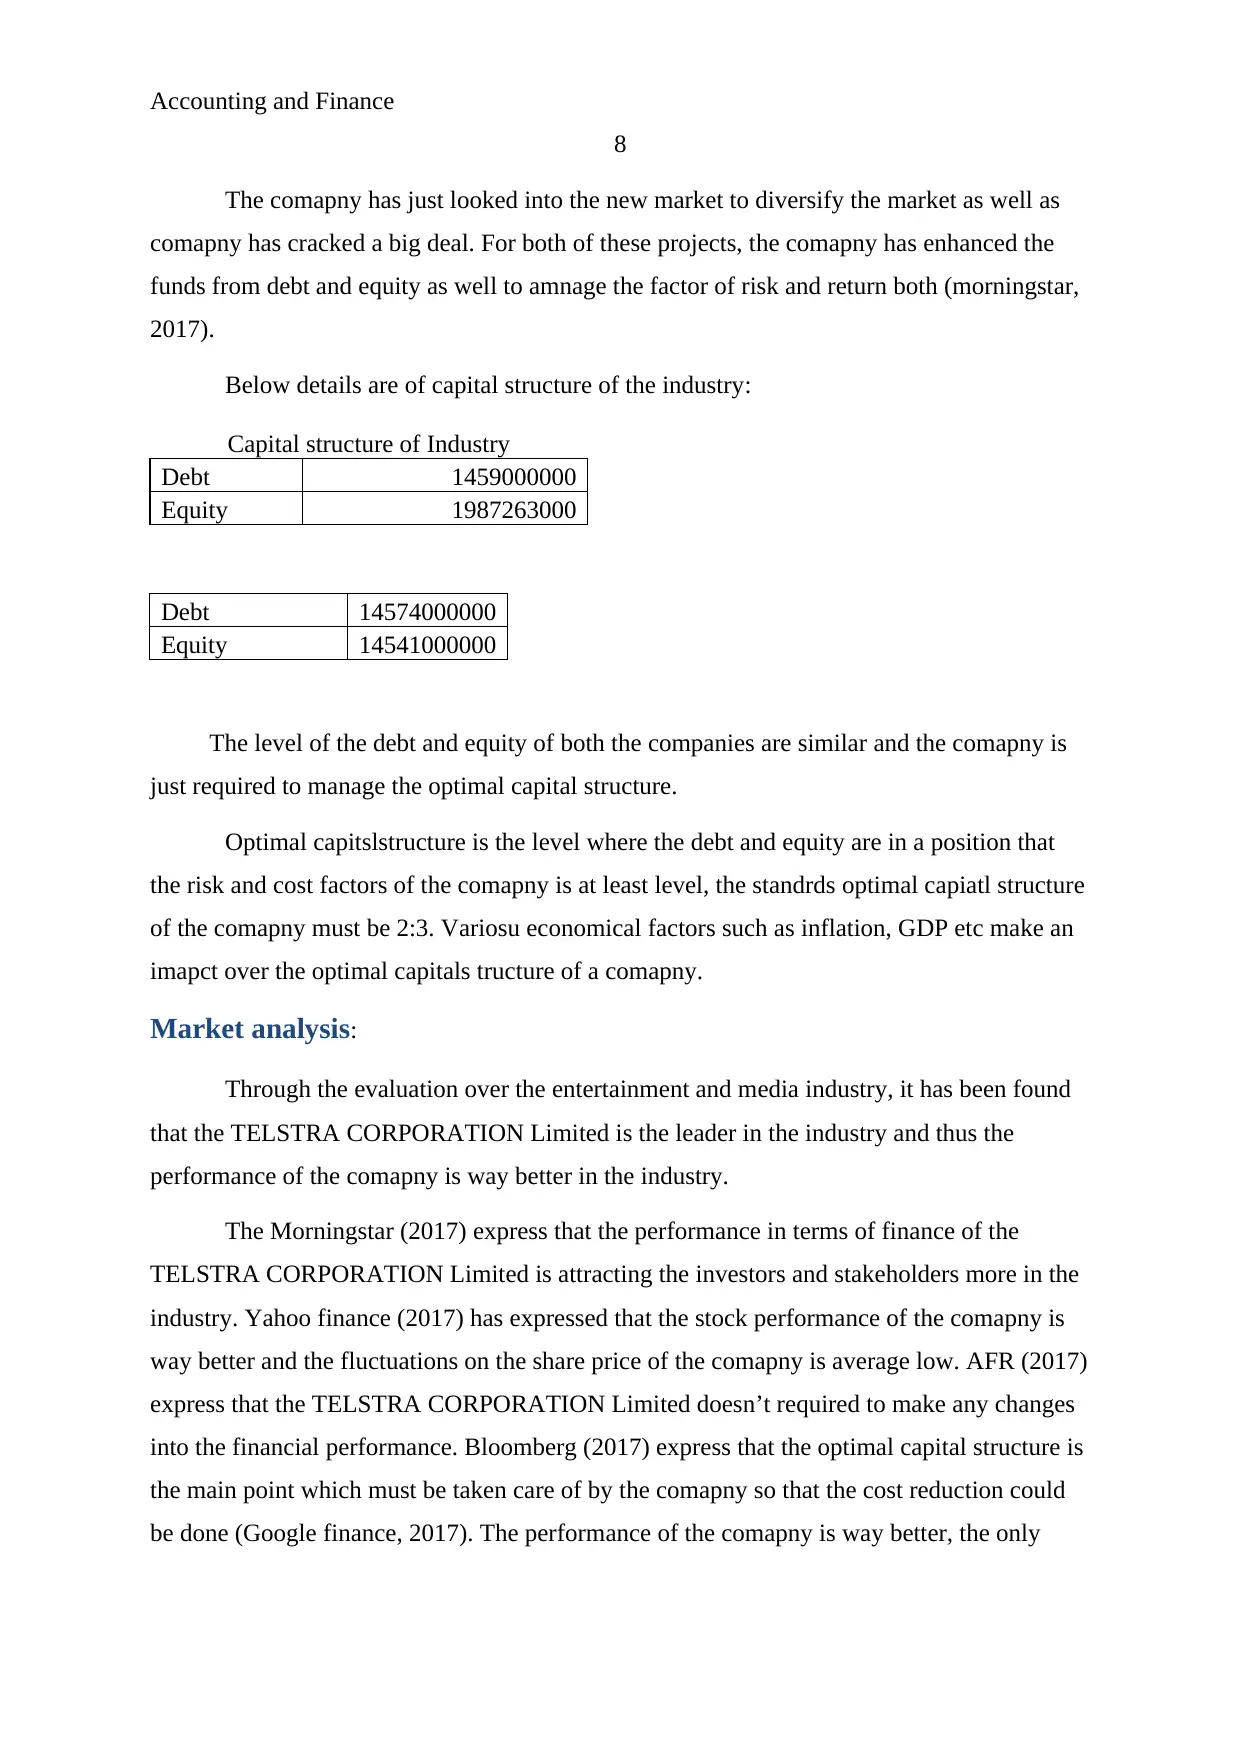
The comapny has just looked into the new market to diversify the market as well as
comapny has cracked a big deal. For both of these projects, the comapny has enhanced the
funds from debt and equity as well to amnage the factor of risk and return both (morningstar,
2017).
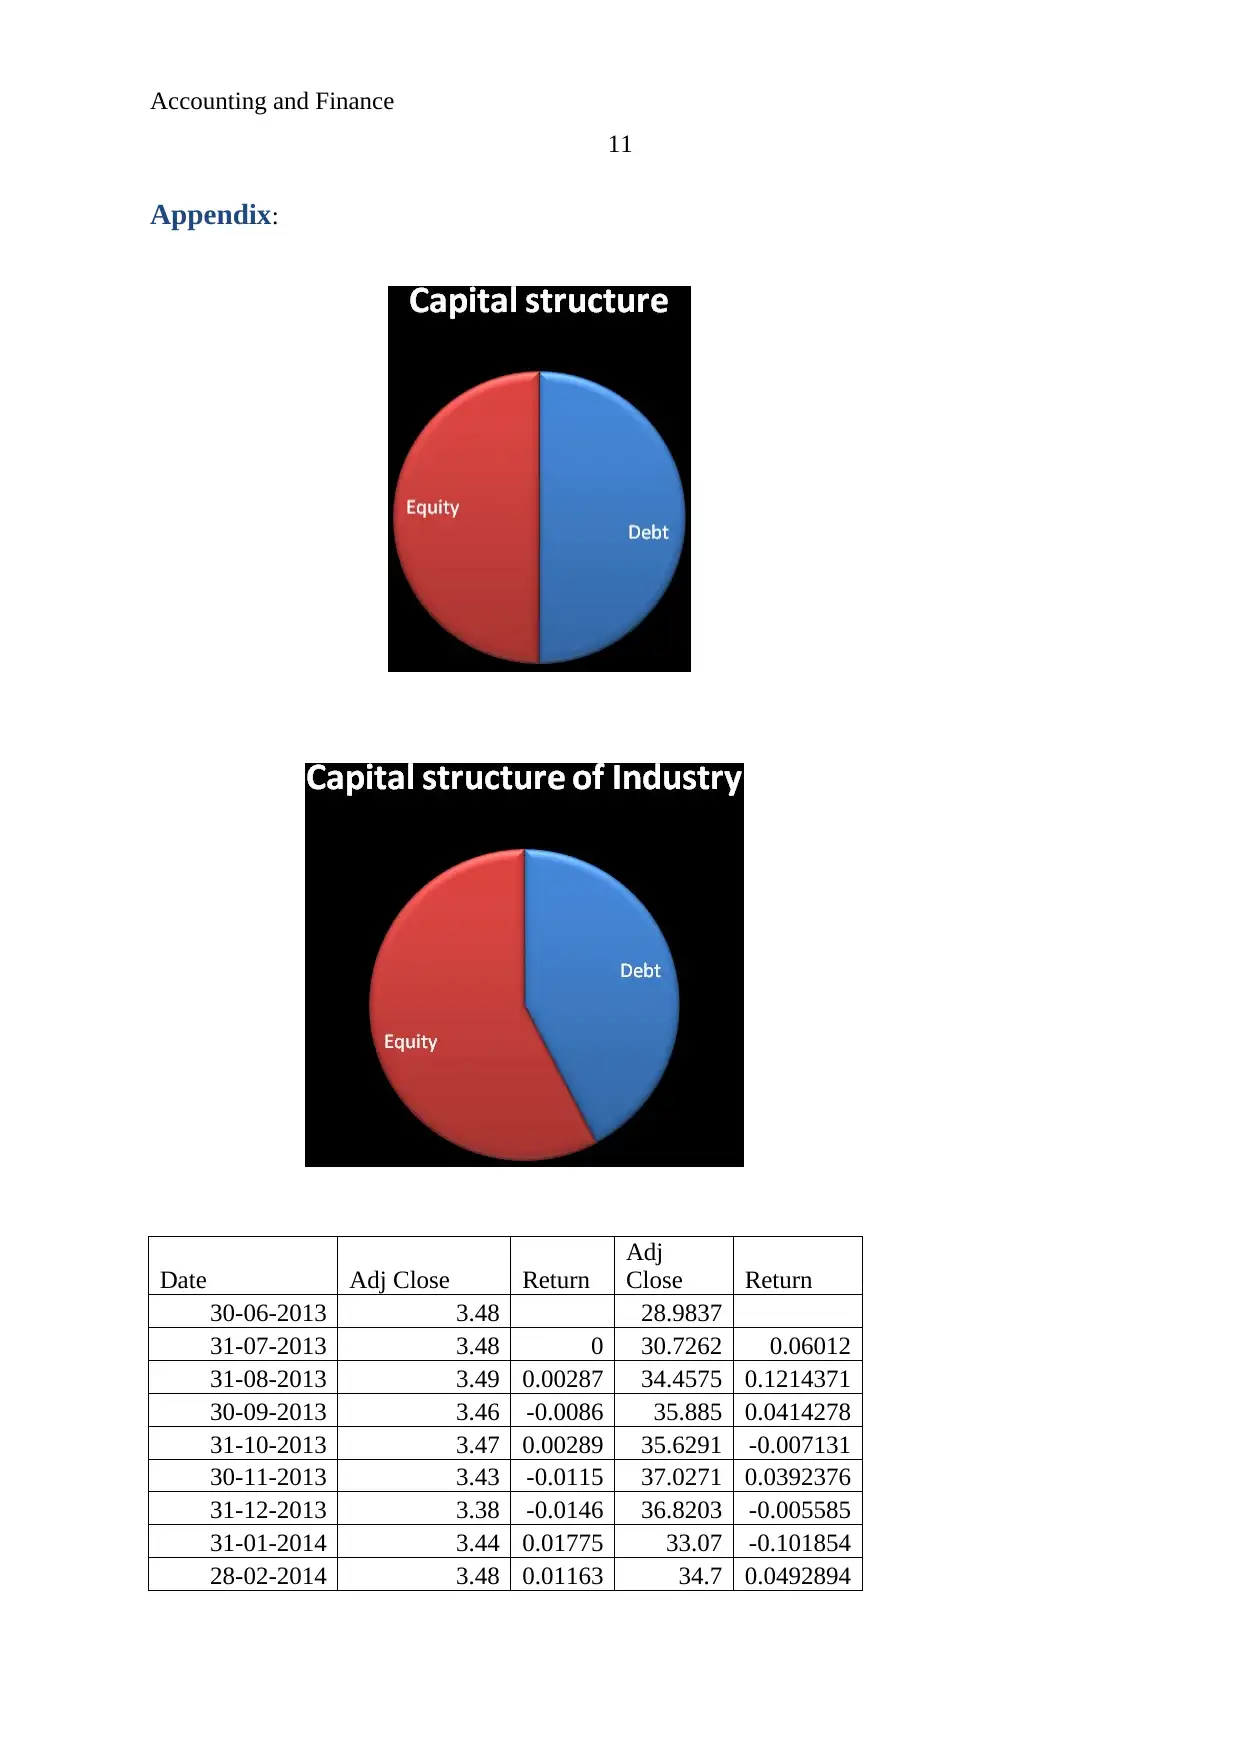
Below details are of capital structure of the industry:
Capital structure of Industry
Debt 1459000000
Equity 1987263000
Debt 14574000000
Equity 14541000000
The level of the debt and equity of both the companies are similar and the comapny is
just required to manage the optimal capital structure.
Optimal capitslstructure is the level where the debt and equity are in a position that
the risk and cost factors of the comapny is at least level, the standrds optimal capiatl structure
of the comapny must be 2:3. Variosu economical factors such as inflation, GDP etc make an
imapct over the optimal capitals tructure of a comapny.
Market analysis:
Through the evaluation over the entertainment and media industry, it has been found
that the TELSTRA CORPORATION Limited is the leader in the industry and thus the
performance of the comapny is way better in the industry.
The Morningstar (2017) express that the performance in terms of finance of the
TELSTRA CORPORATION Limited is attracting the investors and stakeholders more in the
industry. Yahoo finance (2017) has expressed that the stock performance of the comapny is
way better and the fluctuations on the share price of the comapny is average low. AFR (2017)
express that the TELSTRA CORPORATION Limited doesn’t required to make any changes
into the financial performance. Bloomberg (2017) express that the optimal capital structure is
the main point which must be taken care of by the comapny so that the cost reduction could
be done (Google finance, 2017). The performance of the comapny is way better, the only
8
The comapny has just looked into the new market to diversify the market as well as
comapny has cracked a big deal. For both of these projects, the comapny has enhanced the
funds from debt and equity as well to amnage the factor of risk and return both (morningstar,
2017).
Below details are of capital structure of the industry:
Capital structure of Industry
Debt 1459000000
Equity 1987263000
Debt 14574000000
Equity 14541000000
The level of the debt and equity of both the companies are similar and the comapny is
just required to manage the optimal capital structure.
Optimal capitslstructure is the level where the debt and equity are in a position that
the risk and cost factors of the comapny is at least level, the standrds optimal capiatl structure
of the comapny must be 2:3. Variosu economical factors such as inflation, GDP etc make an
imapct over the optimal capitals tructure of a comapny.
Market analysis:
Through the evaluation over the entertainment and media industry, it has been found
that the TELSTRA CORPORATION Limited is the leader in the industry and thus the
performance of the comapny is way better in the industry.
The Morningstar (2017) express that the performance in terms of finance of the
TELSTRA CORPORATION Limited is attracting the investors and stakeholders more in the
industry. Yahoo finance (2017) has expressed that the stock performance of the comapny is
way better and the fluctuations on the share price of the comapny is average low. AFR (2017)
express that the TELSTRA CORPORATION Limited doesn’t required to make any changes
into the financial performance. Bloomberg (2017) express that the optimal capital structure is
the main point which must be taken care of by the comapny so that the cost reduction could
be done (Google finance, 2017). The performance of the comapny is way better, the only
Accounting and Finance
9
suggestion to the company is to make the optimal capital structure s o that the risk and return
aspect of the comapny could be managed.
According to the entire evaluation, it has been concluded that the TELSTRA
CORPORATION Limited is attracting the investors and stakeholders more in the industry.
Optimal capital structure is the main point which must be taken care of by the comapny so
that the cost reduction could be done. Though the comapny is leader in the industry and thus
the performance of the comapny is way better.
⊘ This is a preview!⊘
Do you want full access?
Subscribe today to unlock all pages.
Trusted by 1+ million students worldwide
Accounting and Finance
10
References:
AFR. 2017. TELSTRA CORPORATION LIMITED. Retrieved from
http://www.afr.com/research-tools/TLS/company-profile/operational-history available on
27th Oct 2017.
Bloomberg. 2017. TELSTRA CORPORATION LIMITED. Retrieved from
https://www.bloomberg.com/quote/TLS:AU available on 27th Oct 2017.
Google finance. 2017. TELSTRA CORPORATION LIMITED. Retrieved from
http://finance.google.com/finance?q=ASX:TLS available on 27th Oct 2017.
Home. 2017. TELSTRA CORPORATION LIMITED. Retrieved from
http://www.telstra.com/ available on 27th Oct 2017.
Morningstar. 2017. TELSTRA CORPORATION LIMITED. Reterived from
http://financials.morningstar.com/cash-flow/cf.html?t=TLS®ion=aus&culture=en-US
available on 27th Oct 2017.
Yahoo finance. 2017. TELSTRA CORPORATION LIMITED. Retrieved from
https://finance.yahoo.com/quote/tcs.ax?ltr=1 available on 27th Oct 2017.
Paraphrase This Document
Need a fresh take? Get an instant paraphrase of this document with our AI Paraphraser
Accounting and Finance
11
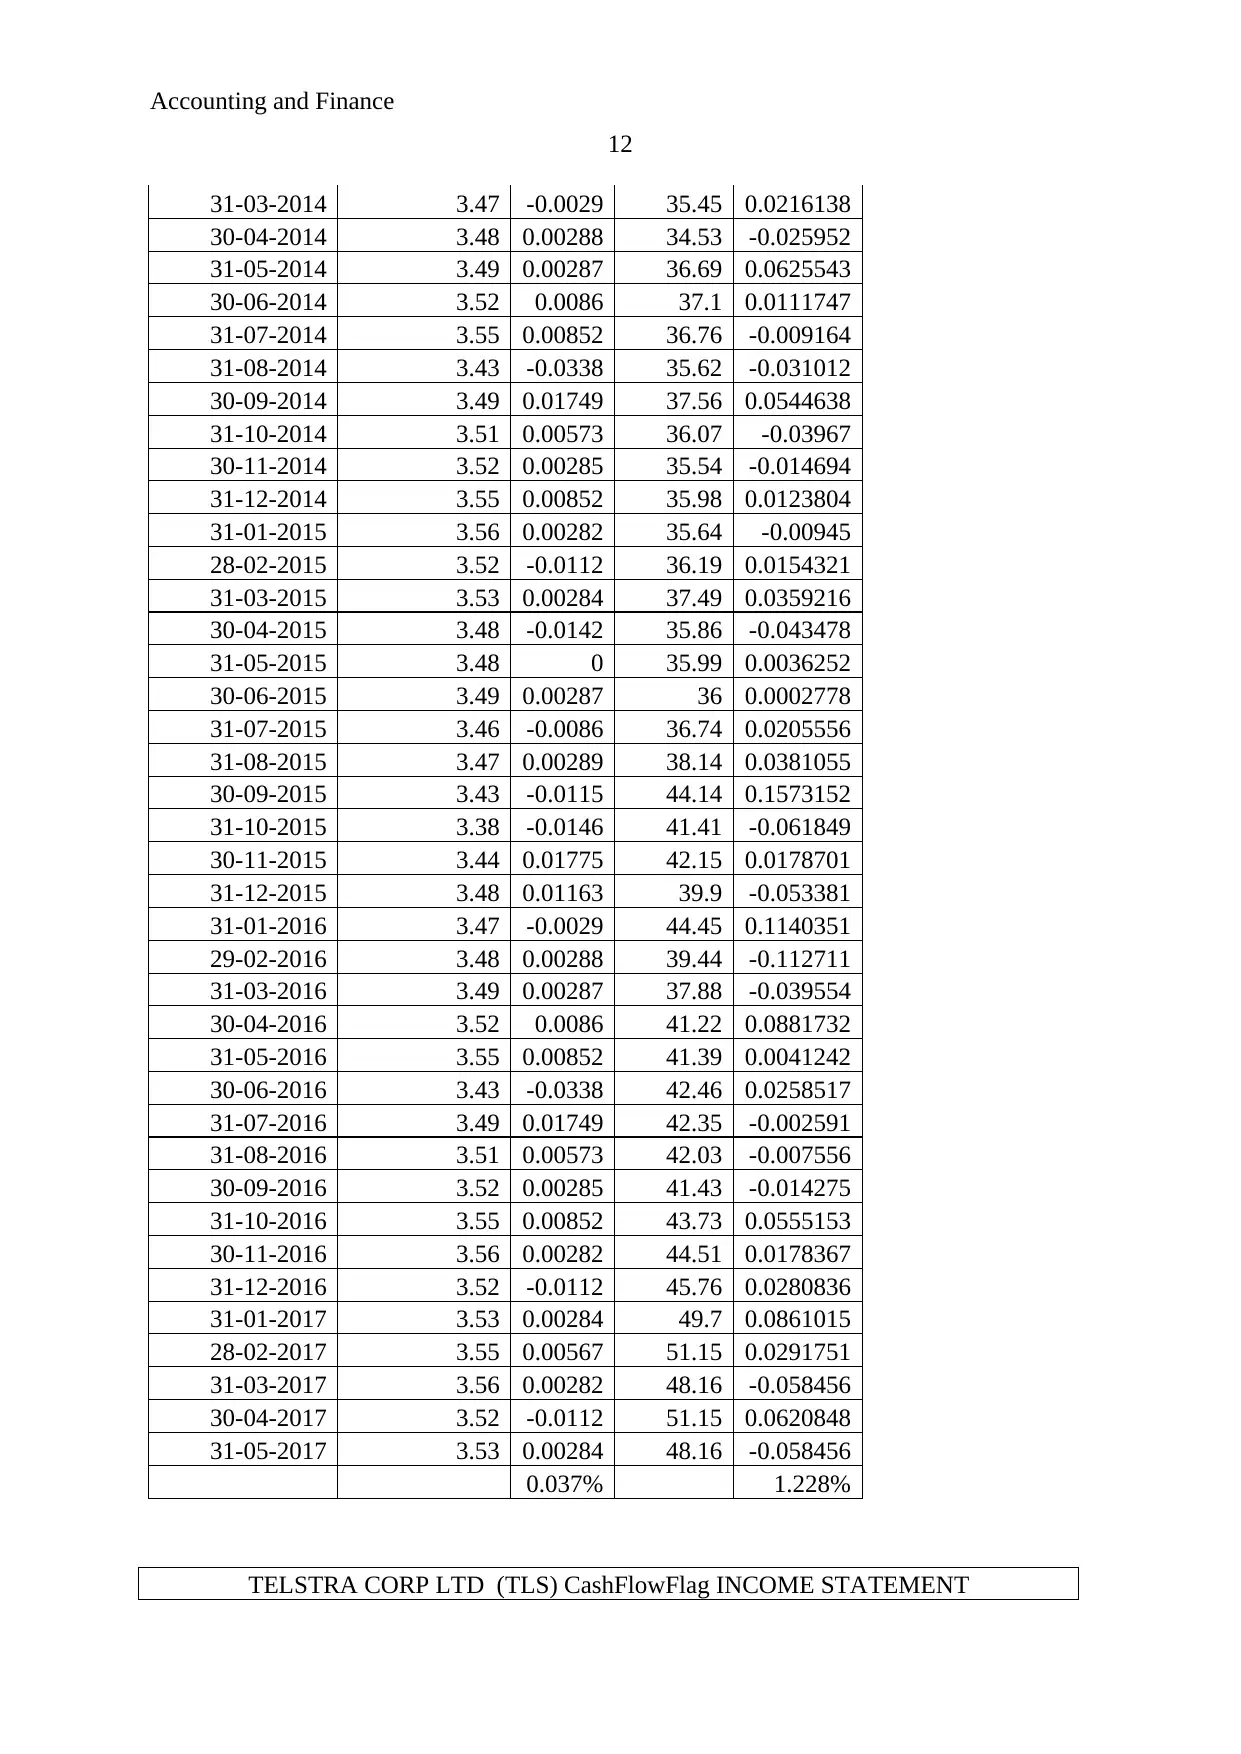
Appendix:
Date Adj Close Return
Adj
Close Return
30-06-2013 3.48 28.9837
31-07-2013 3.48 0 30.7262 0.06012
31-08-2013 3.49 0.00287 34.4575 0.1214371
30-09-2013 3.46 -0.0086 35.885 0.0414278
31-10-2013 3.47 0.00289 35.6291 -0.007131
30-11-2013 3.43 -0.0115 37.0271 0.0392376
31-12-2013 3.38 -0.0146 36.8203 -0.005585
31-01-2014 3.44 0.01775 33.07 -0.101854
28-02-2014 3.48 0.01163 34.7 0.0492894
11
Appendix:
Date Adj Close Return
Adj
Close Return
30-06-2013 3.48 28.9837
31-07-2013 3.48 0 30.7262 0.06012
31-08-2013 3.49 0.00287 34.4575 0.1214371
30-09-2013 3.46 -0.0086 35.885 0.0414278
31-10-2013 3.47 0.00289 35.6291 -0.007131
30-11-2013 3.43 -0.0115 37.0271 0.0392376
31-12-2013 3.38 -0.0146 36.8203 -0.005585
31-01-2014 3.44 0.01775 33.07 -0.101854
28-02-2014 3.48 0.01163 34.7 0.0492894
Accounting and Finance
12
31-03-2014 3.47 -0.0029 35.45 0.0216138
30-04-2014 3.48 0.00288 34.53 -0.025952
31-05-2014 3.49 0.00287 36.69 0.0625543
30-06-2014 3.52 0.0086 37.1 0.0111747
31-07-2014 3.55 0.00852 36.76 -0.009164
31-08-2014 3.43 -0.0338 35.62 -0.031012
30-09-2014 3.49 0.01749 37.56 0.0544638
31-10-2014 3.51 0.00573 36.07 -0.03967
30-11-2014 3.52 0.00285 35.54 -0.014694
31-12-2014 3.55 0.00852 35.98 0.0123804
31-01-2015 3.56 0.00282 35.64 -0.00945
28-02-2015 3.52 -0.0112 36.19 0.0154321
31-03-2015 3.53 0.00284 37.49 0.0359216
30-04-2015 3.48 -0.0142 35.86 -0.043478
31-05-2015 3.48 0 35.99 0.0036252
30-06-2015 3.49 0.00287 36 0.0002778
31-07-2015 3.46 -0.0086 36.74 0.0205556
31-08-2015 3.47 0.00289 38.14 0.0381055
30-09-2015 3.43 -0.0115 44.14 0.1573152
31-10-2015 3.38 -0.0146 41.41 -0.061849
30-11-2015 3.44 0.01775 42.15 0.0178701
31-12-2015 3.48 0.01163 39.9 -0.053381
31-01-2016 3.47 -0.0029 44.45 0.1140351
29-02-2016 3.48 0.00288 39.44 -0.112711
31-03-2016 3.49 0.00287 37.88 -0.039554
30-04-2016 3.52 0.0086 41.22 0.0881732
31-05-2016 3.55 0.00852 41.39 0.0041242
30-06-2016 3.43 -0.0338 42.46 0.0258517
31-07-2016 3.49 0.01749 42.35 -0.002591
31-08-2016 3.51 0.00573 42.03 -0.007556
30-09-2016 3.52 0.00285 41.43 -0.014275
31-10-2016 3.55 0.00852 43.73 0.0555153
30-11-2016 3.56 0.00282 44.51 0.0178367
31-12-2016 3.52 -0.0112 45.76 0.0280836
31-01-2017 3.53 0.00284 49.7 0.0861015
28-02-2017 3.55 0.00567 51.15 0.0291751
31-03-2017 3.56 0.00282 48.16 -0.058456
30-04-2017 3.52 -0.0112 51.15 0.0620848
31-05-2017 3.53 0.00284 48.16 -0.058456
0.037% 1.228%
TELSTRA CORP LTD (TLS) CashFlowFlag INCOME STATEMENT
⊘ This is a preview!⊘
Do you want full access?
Subscribe today to unlock all pages.
Trusted by 1+ million students worldwide
1 out of 17
Related Documents


Your All-in-One AI-Powered Toolkit for Academic Success.
+13062052269
info@desklib.com
Available 24*7 on WhatsApp / Email
![[object Object]](/_next/static/media/star-bottom.7253800d.svg)
Unlock your academic potential
Copyright © 2020–2026 A2Z Services. All Rights Reserved. Developed and managed by ZUCOL.