Project Report: Financial Analysis of Telstra Corporation Limited
VerifiedAdded on 2020/05/16
|17
|3926
|130
Project
AI Summary
This project report conducts a comprehensive financial analysis of Telstra Corporation Limited. It begins with an introduction outlining the report's objectives and scope, focusing on evaluating Telstra's financial position, performance, and investment opportunities. The report then delves into the analysis of financial statements, including the profit and loss statement, balance sheet, and cash flow statement, providing insights into the company's revenue, expenses, assets, liabilities, and cash flow activities. The report further examines ratio analysis, covering profitability, efficiency, liquidity, and rate of return, to assess Telstra's financial health and performance. The analysis provides a comparative study of the company's performance over two years, offering valuable insights for investors and analysts. The conclusion summarizes the key findings and implications of the analysis, highlighting the company's financial strengths and weaknesses and providing recommendations for future improvement. The report includes references and appendices to support the analysis.
Running Head: Accounting For Business
1
Project Report: Accounting For Business
1
Project Report: Accounting For Business
Paraphrase This Document
Need a fresh take? Get an instant paraphrase of this document with our AI Paraphraser
Accounting For Business
2
Contents
Introduction.......................................................................................................................3
Part 1.................................................................................................................................3
Profit and loss statement...............................................................................................3
Balance Sheet................................................................................................................4
Cash flow Statement.....................................................................................................6
Part 2.................................................................................................................................9
Ratio analysis................................................................................................................9
Profitability ratio...........................................................................................................9
Efficiency ratio...........................................................................................................10
Liquidity ratio.............................................................................................................11
Rate of return..............................................................................................................12
Part 3...............................................................................................................................14
Management work......................................................................................................14
Conclusion......................................................................................................................15
References.......................................................................................................................16
Appendix.........................................................................................................................17
Accounting For Business
3
Introduction:
This report has been prepared to evaluate the financial position, performance and the
financial strategy of Telstra limited. Telstra limited is one of the largest Australian
telecommunication companies. This company is operating its business from decades in
Australian market. Further, the performance and position of the company has been evaluated
in this report with analyzing the financial statement (profit and loss account, cash flow
statement and balance sheet) of the company and through conducting the study of ratio
analysis of the company. Further, the same study has been conducted over the annual report
of the company and management work, operations, analysis etc has been analyzed. The
comparative study has also been conducted to evaluate the performance of the company in a
better way. This study would make it easy for the investors and the analysts to evaluate the
financial performance of the company and the total investment opportunities in the company.
Part 1:
Profit and loss statement:
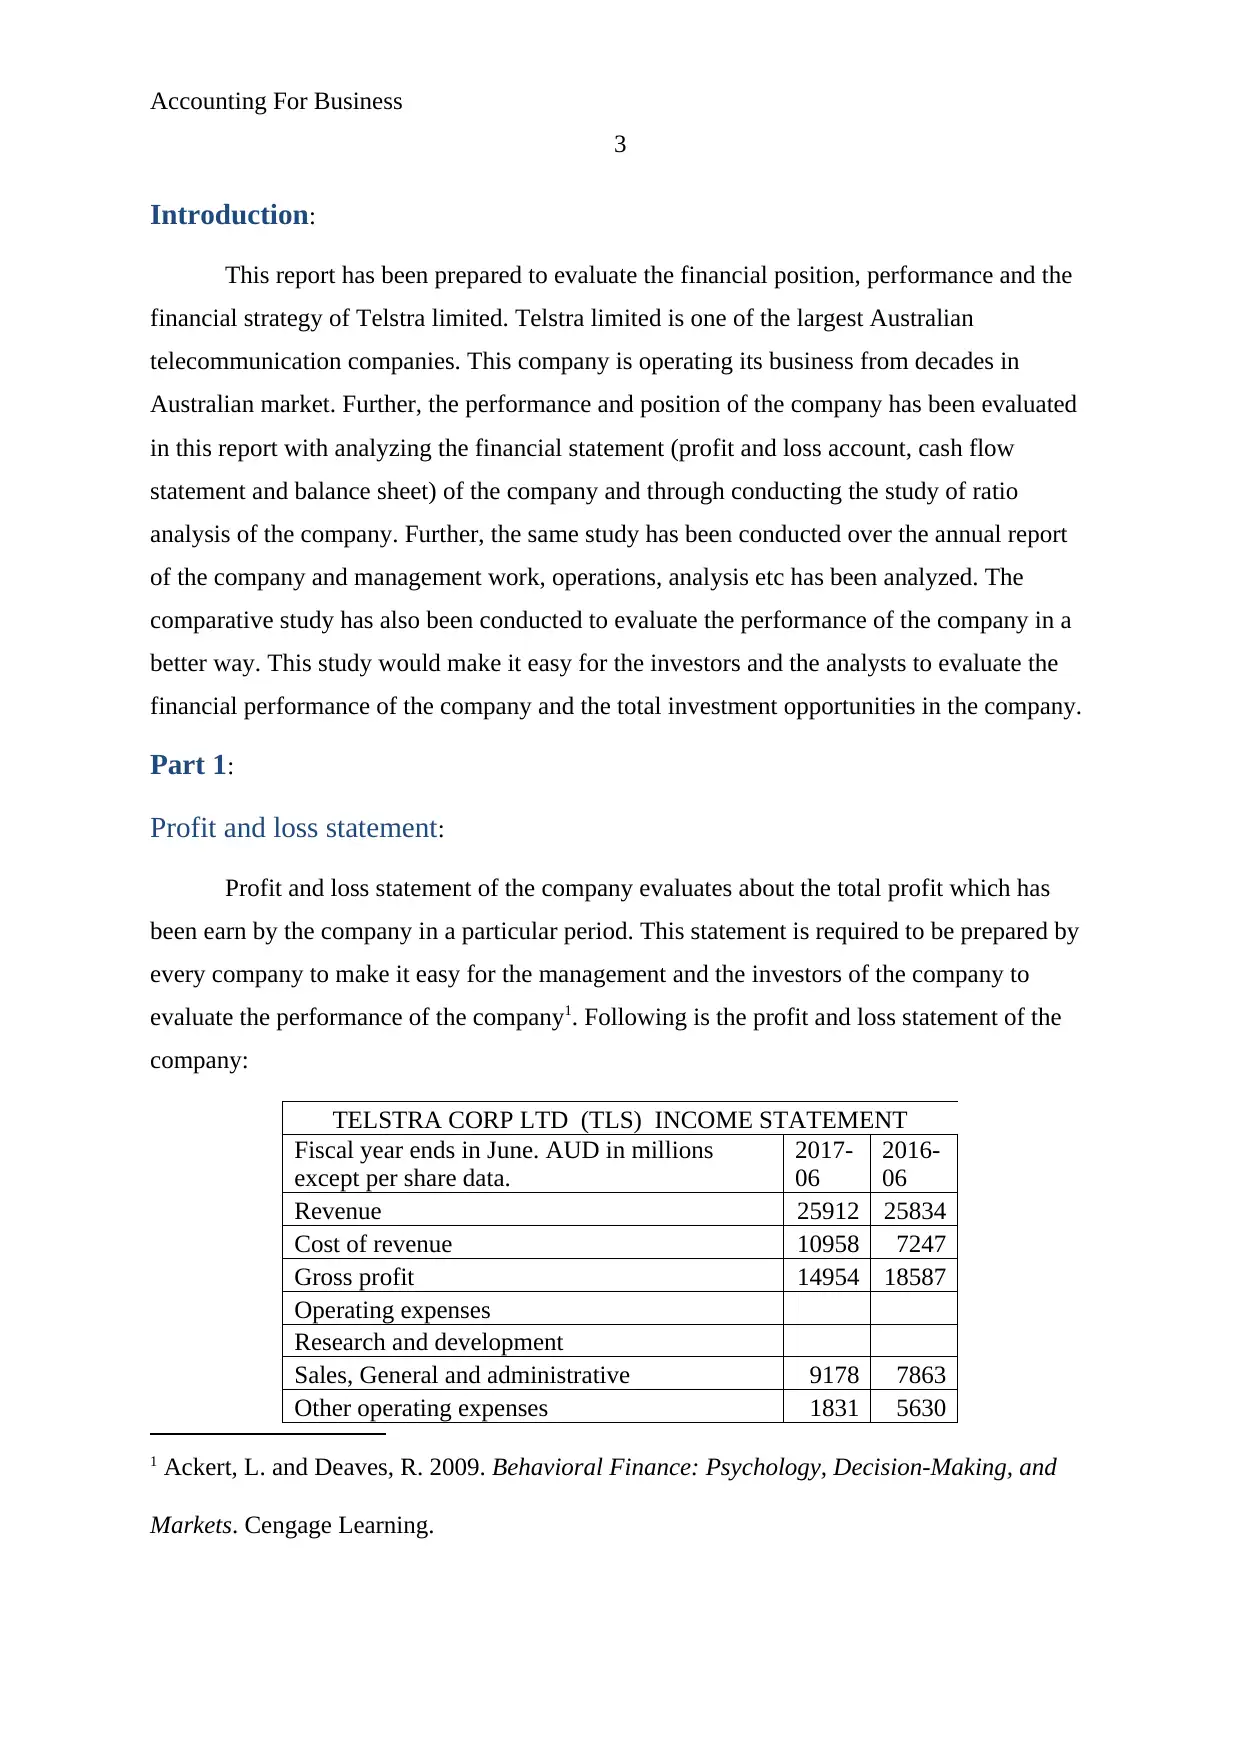
Profit and loss statement of the company evaluates about the total profit which has
been earn by the company in a particular period. This statement is required to be prepared by
every company to make it easy for the management and the investors of the company to
evaluate the performance of the company1. Following is the profit and loss statement of the
company:
TELSTRA CORP LTD (TLS) INCOME STATEMENT
Fiscal year ends in June. AUD in millions
except per share data.
2017-
06
2016-
06
Revenue 25912 25834
Cost of revenue 10958 7247
Gross profit 14954 18587
Operating expenses
Research and development
Sales, General and administrative 9178 7863
Other operating expenses 1831 5630
1 Ackert, L. and Deaves, R. 2009. Behavioral Finance: Psychology, Decision-Making, and
Markets. Cengage Learning.
3
Introduction:
This report has been prepared to evaluate the financial position, performance and the
financial strategy of Telstra limited. Telstra limited is one of the largest Australian
telecommunication companies. This company is operating its business from decades in
Australian market. Further, the performance and position of the company has been evaluated
in this report with analyzing the financial statement (profit and loss account, cash flow
statement and balance sheet) of the company and through conducting the study of ratio
analysis of the company. Further, the same study has been conducted over the annual report
of the company and management work, operations, analysis etc has been analyzed. The
comparative study has also been conducted to evaluate the performance of the company in a
better way. This study would make it easy for the investors and the analysts to evaluate the
financial performance of the company and the total investment opportunities in the company.
Part 1:
Profit and loss statement:
Profit and loss statement of the company evaluates about the total profit which has
been earn by the company in a particular period. This statement is required to be prepared by
every company to make it easy for the management and the investors of the company to
evaluate the performance of the company1. Following is the profit and loss statement of the
company:
TELSTRA CORP LTD (TLS) INCOME STATEMENT
Fiscal year ends in June. AUD in millions
except per share data.
2017-
06
2016-
06
Revenue 25912 25834
Cost of revenue 10958 7247
Gross profit 14954 18587
Operating expenses
Research and development
Sales, General and administrative 9178 7863
Other operating expenses 1831 5630
1 Ackert, L. and Deaves, R. 2009. Behavioral Finance: Psychology, Decision-Making, and
Markets. Cengage Learning.
⊘ This is a preview!⊘
Do you want full access?
Subscribe today to unlock all pages.
Trusted by 1+ million students worldwide
Accounting For Business
4
Total operating expenses 11009 13493
Operating income 3945 5094
Interest Expense 729 796
Other income (expense) 2431 1302
Income before taxes 5647 5600
Provision for income taxes 1773 1768
Net income from continuing operations 3874 3832
Net income from discontinuing ops 2017
Other 17 -69
Net income 3891 5780
Net income available to common shareholders 3891 5780
Earnings per share
Basic 0.33 0.47
Diluted 0.33 0.47
Weighted average shares outstanding
Basic 11968 12202
Diluted 11968 12216
EBITDA2 10817 10551
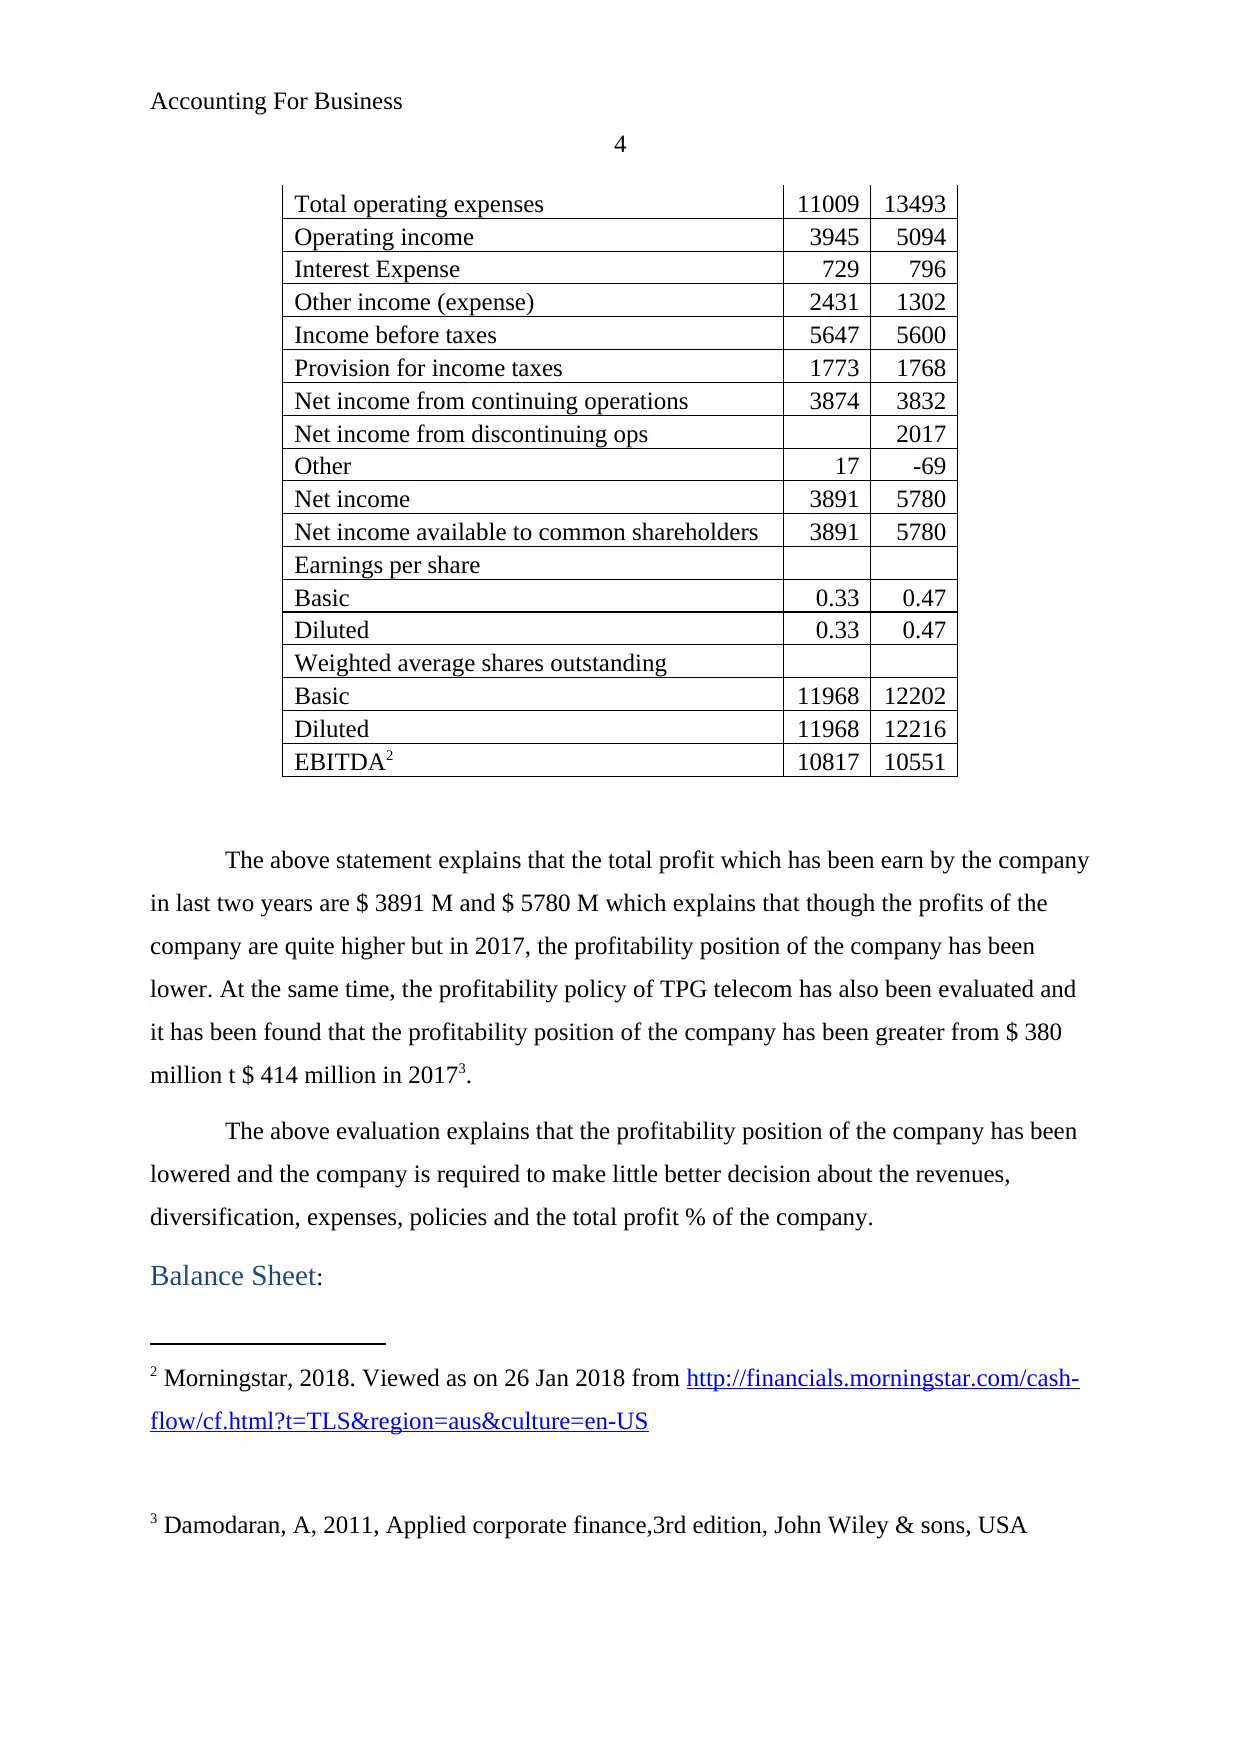
The above statement explains that the total profit which has been earn by the company
in last two years are $ 3891 M and $ 5780 M which explains that though the profits of the
company are quite higher but in 2017, the profitability position of the company has been
lower. At the same time, the profitability policy of TPG telecom has also been evaluated and
it has been found that the profitability position of the company has been greater from $ 380
million t $ 414 million in 20173.
The above evaluation explains that the profitability position of the company has been
lowered and the company is required to make little better decision about the revenues,
diversification, expenses, policies and the total profit % of the company.
Balance Sheet:
2 Morningstar, 2018. Viewed as on 26 Jan 2018 from http://financials.morningstar.com/cash-
flow/cf.html?t=TLS®ion=aus&culture=en-US
3 Damodaran, A, 2011, Applied corporate finance,3rd edition, John Wiley & sons, USA
4
Total operating expenses 11009 13493
Operating income 3945 5094
Interest Expense 729 796
Other income (expense) 2431 1302
Income before taxes 5647 5600
Provision for income taxes 1773 1768
Net income from continuing operations 3874 3832
Net income from discontinuing ops 2017
Other 17 -69
Net income 3891 5780
Net income available to common shareholders 3891 5780
Earnings per share
Basic 0.33 0.47
Diluted 0.33 0.47
Weighted average shares outstanding
Basic 11968 12202
Diluted 11968 12216
EBITDA2 10817 10551
The above statement explains that the total profit which has been earn by the company
in last two years are $ 3891 M and $ 5780 M which explains that though the profits of the
company are quite higher but in 2017, the profitability position of the company has been
lower. At the same time, the profitability policy of TPG telecom has also been evaluated and
it has been found that the profitability position of the company has been greater from $ 380
million t $ 414 million in 20173.
The above evaluation explains that the profitability position of the company has been
lowered and the company is required to make little better decision about the revenues,
diversification, expenses, policies and the total profit % of the company.
Balance Sheet:
2 Morningstar, 2018. Viewed as on 26 Jan 2018 from http://financials.morningstar.com/cash-
flow/cf.html?t=TLS®ion=aus&culture=en-US
3 Damodaran, A, 2011, Applied corporate finance,3rd edition, John Wiley & sons, USA
Paraphrase This Document
Need a fresh take? Get an instant paraphrase of this document with our AI Paraphraser
Accounting For Business
5
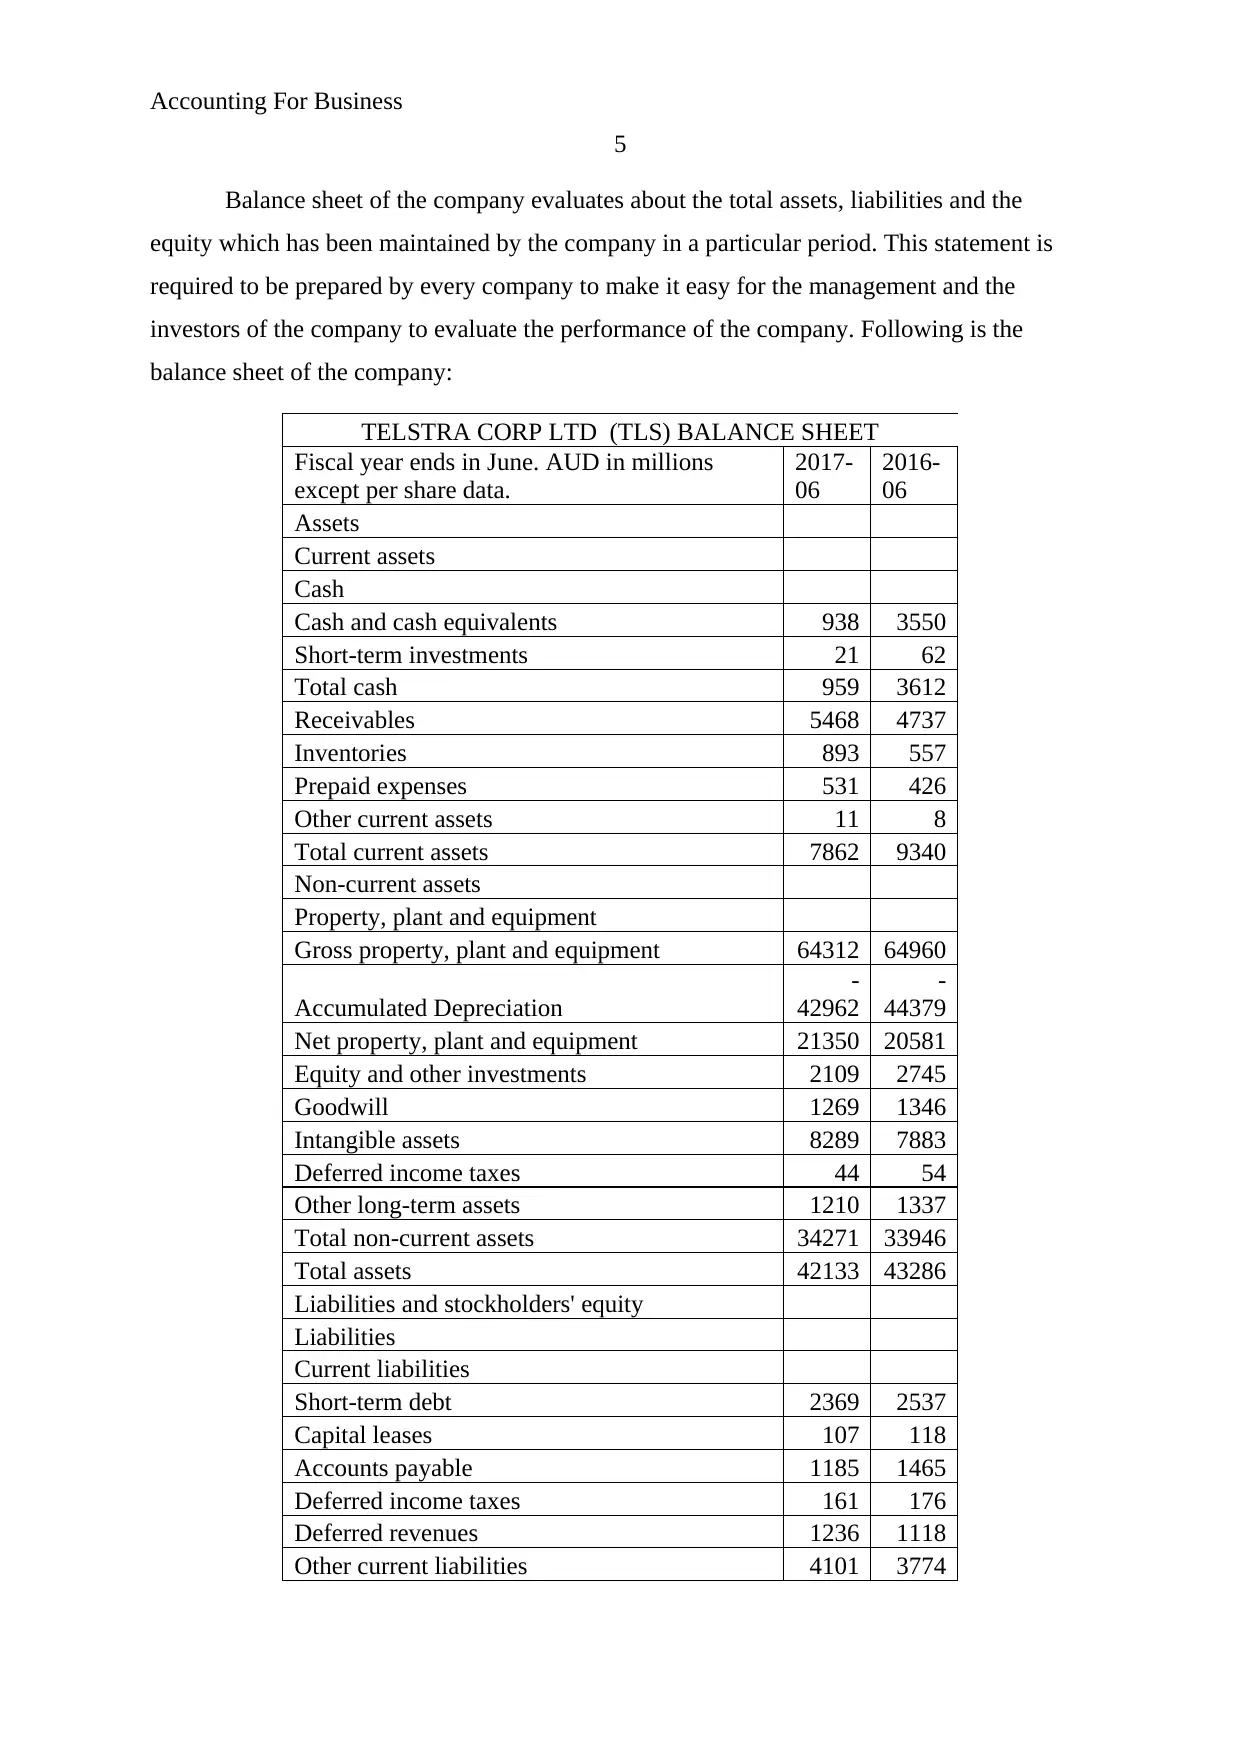
Balance sheet of the company evaluates about the total assets, liabilities and the
equity which has been maintained by the company in a particular period. This statement is
required to be prepared by every company to make it easy for the management and the
investors of the company to evaluate the performance of the company. Following is the
balance sheet of the company:
TELSTRA CORP LTD (TLS) BALANCE SHEET
Fiscal year ends in June. AUD in millions
except per share data.
2017-
06
2016-
06
Assets
Current assets
Cash
Cash and cash equivalents 938 3550
Short-term investments 21 62
Total cash 959 3612
Receivables 5468 4737
Inventories 893 557
Prepaid expenses 531 426
Other current assets 11 8
Total current assets 7862 9340
Non-current assets
Property, plant and equipment
Gross property, plant and equipment 64312 64960
Accumulated Depreciation
-
42962
-
44379
Net property, plant and equipment 21350 20581
Equity and other investments 2109 2745
Goodwill 1269 1346
Intangible assets 8289 7883
Deferred income taxes 44 54
Other long-term assets 1210 1337
Total non-current assets 34271 33946
Total assets 42133 43286
Liabilities and stockholders' equity
Liabilities
Current liabilities
Short-term debt 2369 2537
Capital leases 107 118
Accounts payable 1185 1465
Deferred income taxes 161 176
Deferred revenues 1236 1118
Other current liabilities 4101 3774
5
Balance sheet of the company evaluates about the total assets, liabilities and the
equity which has been maintained by the company in a particular period. This statement is
required to be prepared by every company to make it easy for the management and the
investors of the company to evaluate the performance of the company. Following is the
balance sheet of the company:
TELSTRA CORP LTD (TLS) BALANCE SHEET
Fiscal year ends in June. AUD in millions
except per share data.
2017-
06
2016-
06
Assets
Current assets
Cash
Cash and cash equivalents 938 3550
Short-term investments 21 62
Total cash 959 3612
Receivables 5468 4737
Inventories 893 557
Prepaid expenses 531 426
Other current assets 11 8
Total current assets 7862 9340
Non-current assets
Property, plant and equipment
Gross property, plant and equipment 64312 64960
Accumulated Depreciation
-
42962
-
44379
Net property, plant and equipment 21350 20581
Equity and other investments 2109 2745
Goodwill 1269 1346
Intangible assets 8289 7883
Deferred income taxes 44 54
Other long-term assets 1210 1337
Total non-current assets 34271 33946
Total assets 42133 43286
Liabilities and stockholders' equity
Liabilities
Current liabilities
Short-term debt 2369 2537
Capital leases 107 118
Accounts payable 1185 1465
Deferred income taxes 161 176
Deferred revenues 1236 1118
Other current liabilities 4101 3774
Accounting For Business
6
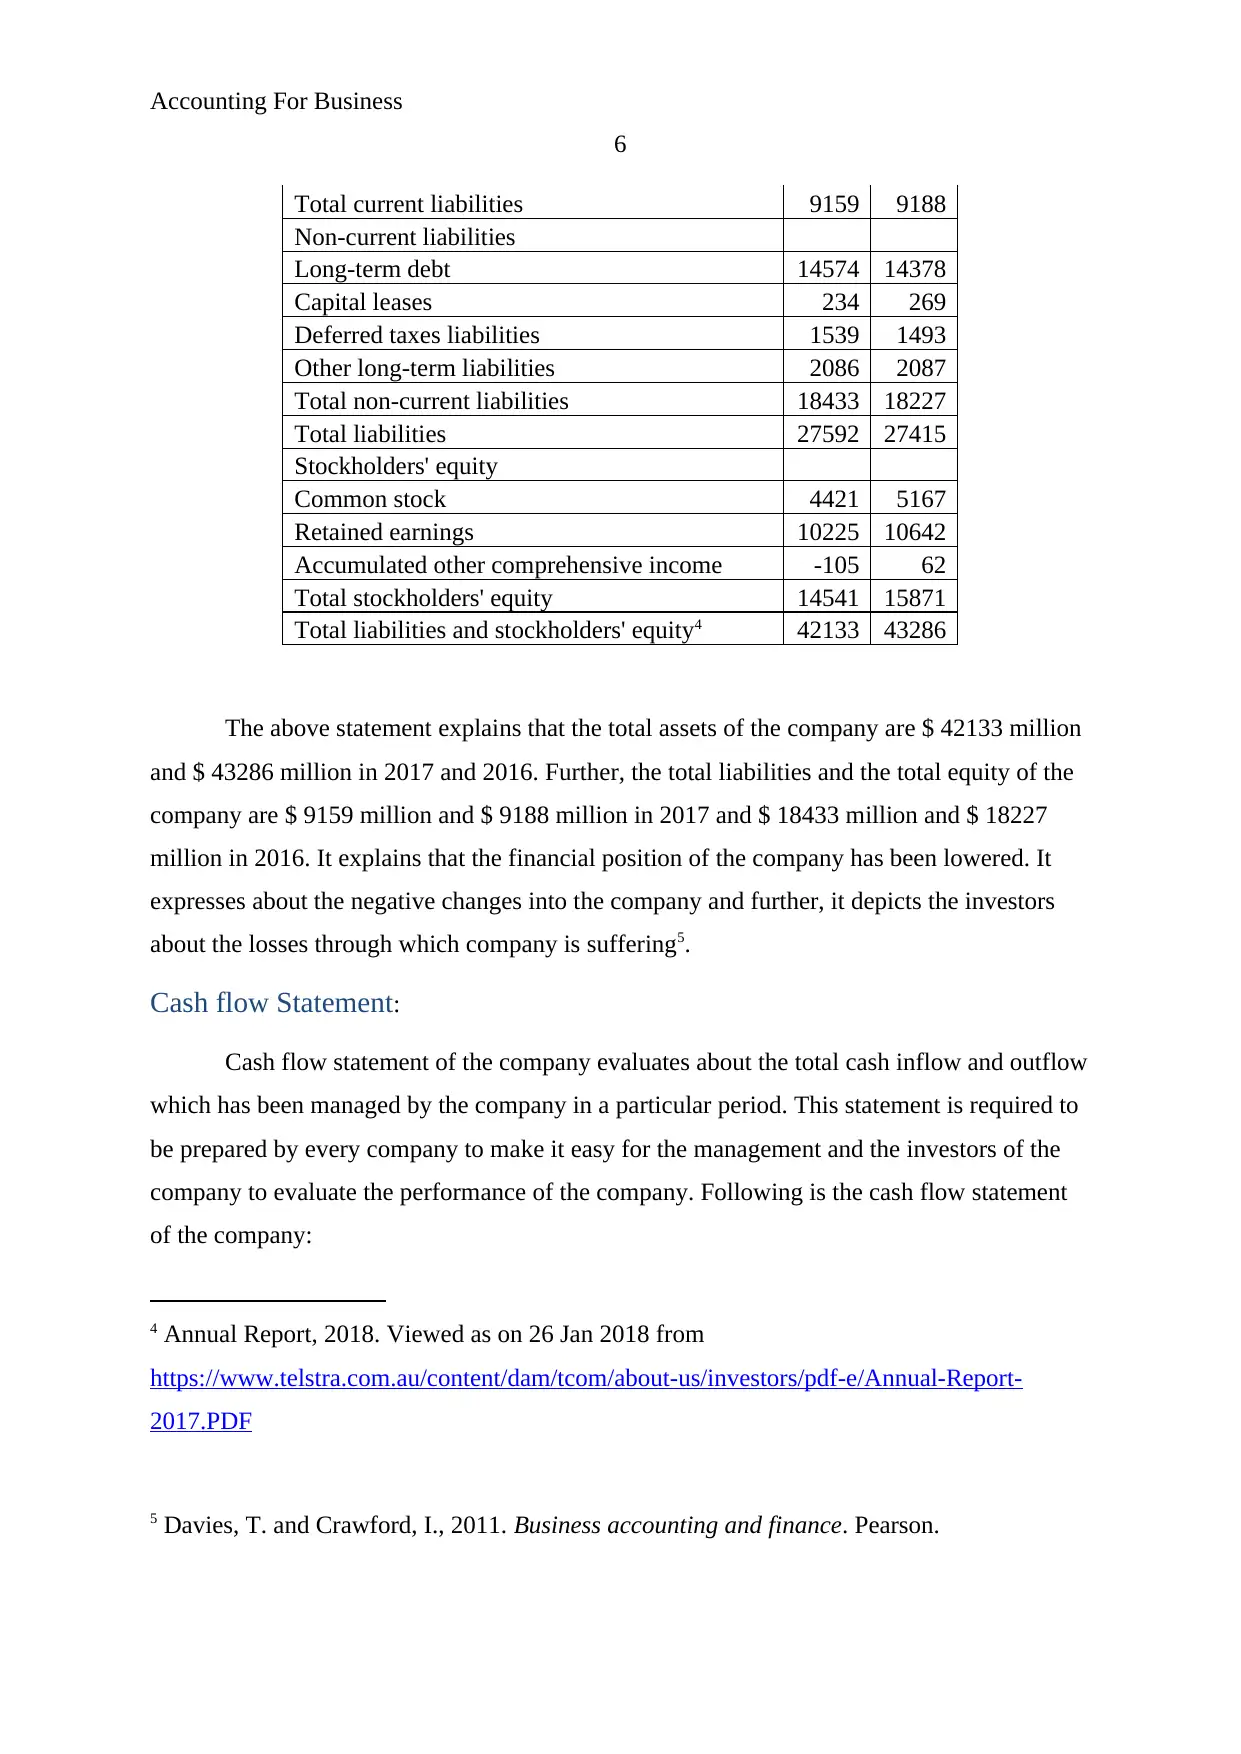
Total current liabilities 9159 9188
Non-current liabilities
Long-term debt 14574 14378
Capital leases 234 269
Deferred taxes liabilities 1539 1493
Other long-term liabilities 2086 2087
Total non-current liabilities 18433 18227
Total liabilities 27592 27415
Stockholders' equity
Common stock 4421 5167
Retained earnings 10225 10642
Accumulated other comprehensive income -105 62
Total stockholders' equity 14541 15871
Total liabilities and stockholders' equity4 42133 43286
The above statement explains that the total assets of the company are $ 42133 million
and $ 43286 million in 2017 and 2016. Further, the total liabilities and the total equity of the
company are $ 9159 million and $ 9188 million in 2017 and $ 18433 million and $ 18227
million in 2016. It explains that the financial position of the company has been lowered. It
expresses about the negative changes into the company and further, it depicts the investors
about the losses through which company is suffering5.
Cash flow Statement:
Cash flow statement of the company evaluates about the total cash inflow and outflow
which has been managed by the company in a particular period. This statement is required to
be prepared by every company to make it easy for the management and the investors of the
company to evaluate the performance of the company. Following is the cash flow statement
of the company:
4 Annual Report, 2018. Viewed as on 26 Jan 2018 from
https://www.telstra.com.au/content/dam/tcom/about-us/investors/pdf-e/Annual-Report-
2017.PDF
5 Davies, T. and Crawford, I., 2011. Business accounting and finance. Pearson.
6
Total current liabilities 9159 9188
Non-current liabilities
Long-term debt 14574 14378
Capital leases 234 269
Deferred taxes liabilities 1539 1493
Other long-term liabilities 2086 2087
Total non-current liabilities 18433 18227
Total liabilities 27592 27415
Stockholders' equity
Common stock 4421 5167
Retained earnings 10225 10642
Accumulated other comprehensive income -105 62
Total stockholders' equity 14541 15871
Total liabilities and stockholders' equity4 42133 43286
The above statement explains that the total assets of the company are $ 42133 million
and $ 43286 million in 2017 and 2016. Further, the total liabilities and the total equity of the
company are $ 9159 million and $ 9188 million in 2017 and $ 18433 million and $ 18227
million in 2016. It explains that the financial position of the company has been lowered. It
expresses about the negative changes into the company and further, it depicts the investors
about the losses through which company is suffering5.
Cash flow Statement:
Cash flow statement of the company evaluates about the total cash inflow and outflow
which has been managed by the company in a particular period. This statement is required to
be prepared by every company to make it easy for the management and the investors of the
company to evaluate the performance of the company. Following is the cash flow statement
of the company:
4 Annual Report, 2018. Viewed as on 26 Jan 2018 from
https://www.telstra.com.au/content/dam/tcom/about-us/investors/pdf-e/Annual-Report-
2017.PDF
5 Davies, T. and Crawford, I., 2011. Business accounting and finance. Pearson.
⊘ This is a preview!⊘
Do you want full access?
Subscribe today to unlock all pages.
Trusted by 1+ million students worldwide

Accounting For Business
7
TELSTRA CORP LTD (TLS) Statement of CASH FLOW
7
TELSTRA CORP LTD (TLS) Statement of CASH FLOW
Paraphrase This Document
Need a fresh take? Get an instant paraphrase of this document with our AI Paraphraser
Accounting For Business
8
Fiscal year ends in June. AUD in millions
except per share data.
2017-
06
2016-
06
Cash Flows From Operating Activities
Other non-cash items 7775 8133
Net cash provided by operating activities 7775 8133
Cash Flows From Investing Activities
Investments in property, plant, and
equipment -3725 -3051
Property, plant, and equipment reductions 679 470
Acquisitions, net -63 1248
Purchases of investments -82 -105
Sales/Maturities of investments 285 56
Purchases of intangibles -1596 -1143
Sales of intangibles
Other investing activities 223 318
Net cash used for investing activities -4279 -2207
Cash Flows From Financing Activities
Debt issued 4710 4987
Debt repayment -4571 -3954
Common stock issued
Common stock repurchased -1502 -68
Dividend paid -3736 -3787
Other financing activities -1005 -955
Net cash provided by (used for) financing
activities -6104 -3777
Effect of exchange rate changes -6 5
Net change in cash -2614 2154
Cash at beginning of period 3550 1396
Cash at end of period 936 3550
Free Cash Flow
Operating cash flow 7775 8133
Capital expenditure -5321 -4194
Free cash flow6 2454 3939
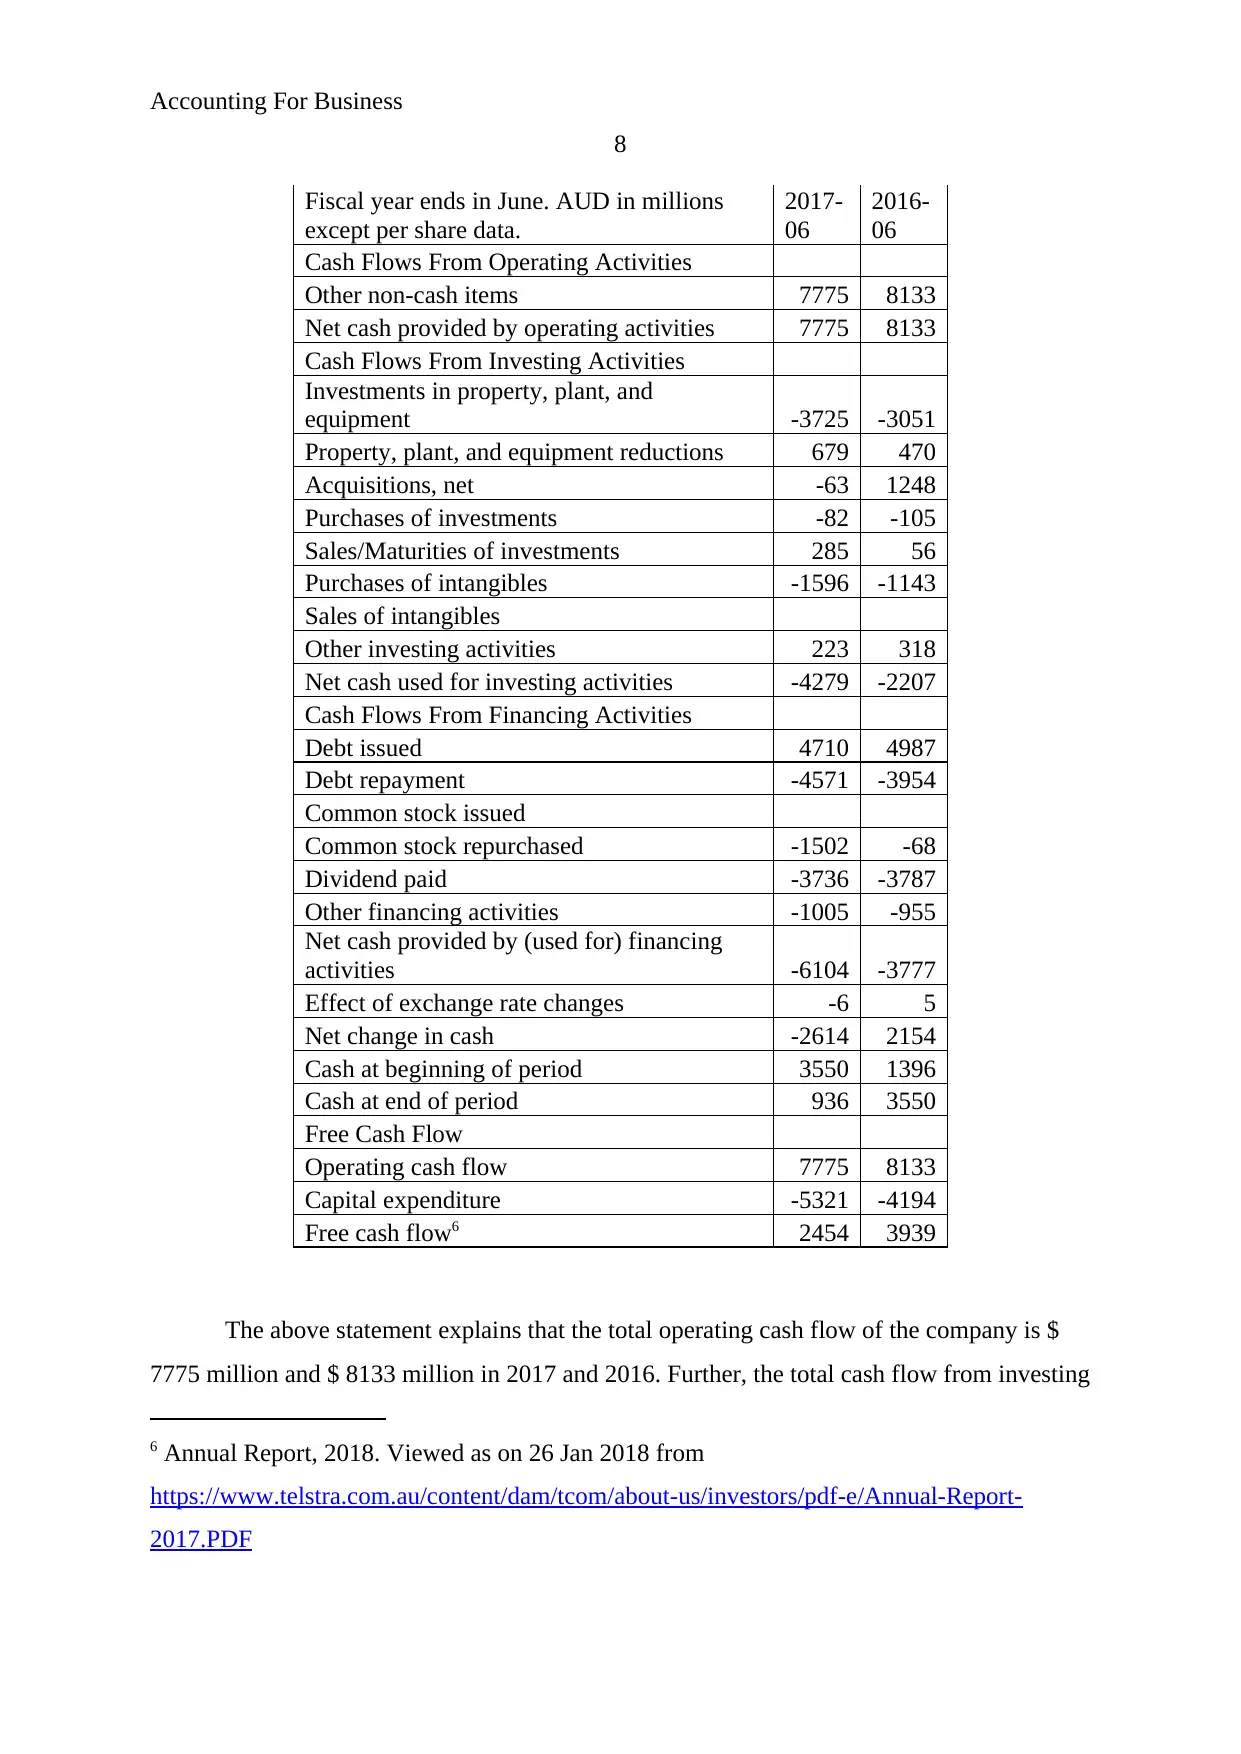
The above statement explains that the total operating cash flow of the company is $
7775 million and $ 8133 million in 2017 and 2016. Further, the total cash flow from investing
6 Annual Report, 2018. Viewed as on 26 Jan 2018 from
https://www.telstra.com.au/content/dam/tcom/about-us/investors/pdf-e/Annual-Report-
2017.PDF
8
Fiscal year ends in June. AUD in millions
except per share data.
2017-
06
2016-
06
Cash Flows From Operating Activities
Other non-cash items 7775 8133
Net cash provided by operating activities 7775 8133
Cash Flows From Investing Activities
Investments in property, plant, and
equipment -3725 -3051
Property, plant, and equipment reductions 679 470
Acquisitions, net -63 1248
Purchases of investments -82 -105
Sales/Maturities of investments 285 56
Purchases of intangibles -1596 -1143
Sales of intangibles
Other investing activities 223 318
Net cash used for investing activities -4279 -2207
Cash Flows From Financing Activities
Debt issued 4710 4987
Debt repayment -4571 -3954
Common stock issued
Common stock repurchased -1502 -68
Dividend paid -3736 -3787
Other financing activities -1005 -955
Net cash provided by (used for) financing
activities -6104 -3777
Effect of exchange rate changes -6 5
Net change in cash -2614 2154
Cash at beginning of period 3550 1396
Cash at end of period 936 3550
Free Cash Flow
Operating cash flow 7775 8133
Capital expenditure -5321 -4194
Free cash flow6 2454 3939
The above statement explains that the total operating cash flow of the company is $
7775 million and $ 8133 million in 2017 and 2016. Further, the total cash flow from investing
6 Annual Report, 2018. Viewed as on 26 Jan 2018 from
https://www.telstra.com.au/content/dam/tcom/about-us/investors/pdf-e/Annual-Report-
2017.PDF
Accounting For Business
9
activities and the total cash flow from financing activities of the company is $ -4279 million
and $ -6104 million in 2017 and $ -2207 million and $ -3777 million in 2016. It explains that
the cash inflow of the company has been lower than the cash outflow of the company. It
expresses about the negative changes into the company and further, it depicts the investors
about the losses through which company is suffering7.
7 Deegan, C., 2013. Financial accounting theory. McGraw-Hill Education Australia.
⊘ This is a preview!⊘
Do you want full access?
Subscribe today to unlock all pages.
Trusted by 1+ million students worldwide
Accounting For Business
10
Part 2:
Ratio analysis:
Further, the study of ratio analysis has been conducted to evaluate the investment
opportunity of the company. Ratio analysis study briefs the financial statement of the
company and explains about the various levels and the position of the company. Ratio
analysis makes it easy for the investors to evaluate the position of the company. Following
ratios express about the profitability, liquidity, efficiency and rate of return position of the
company:
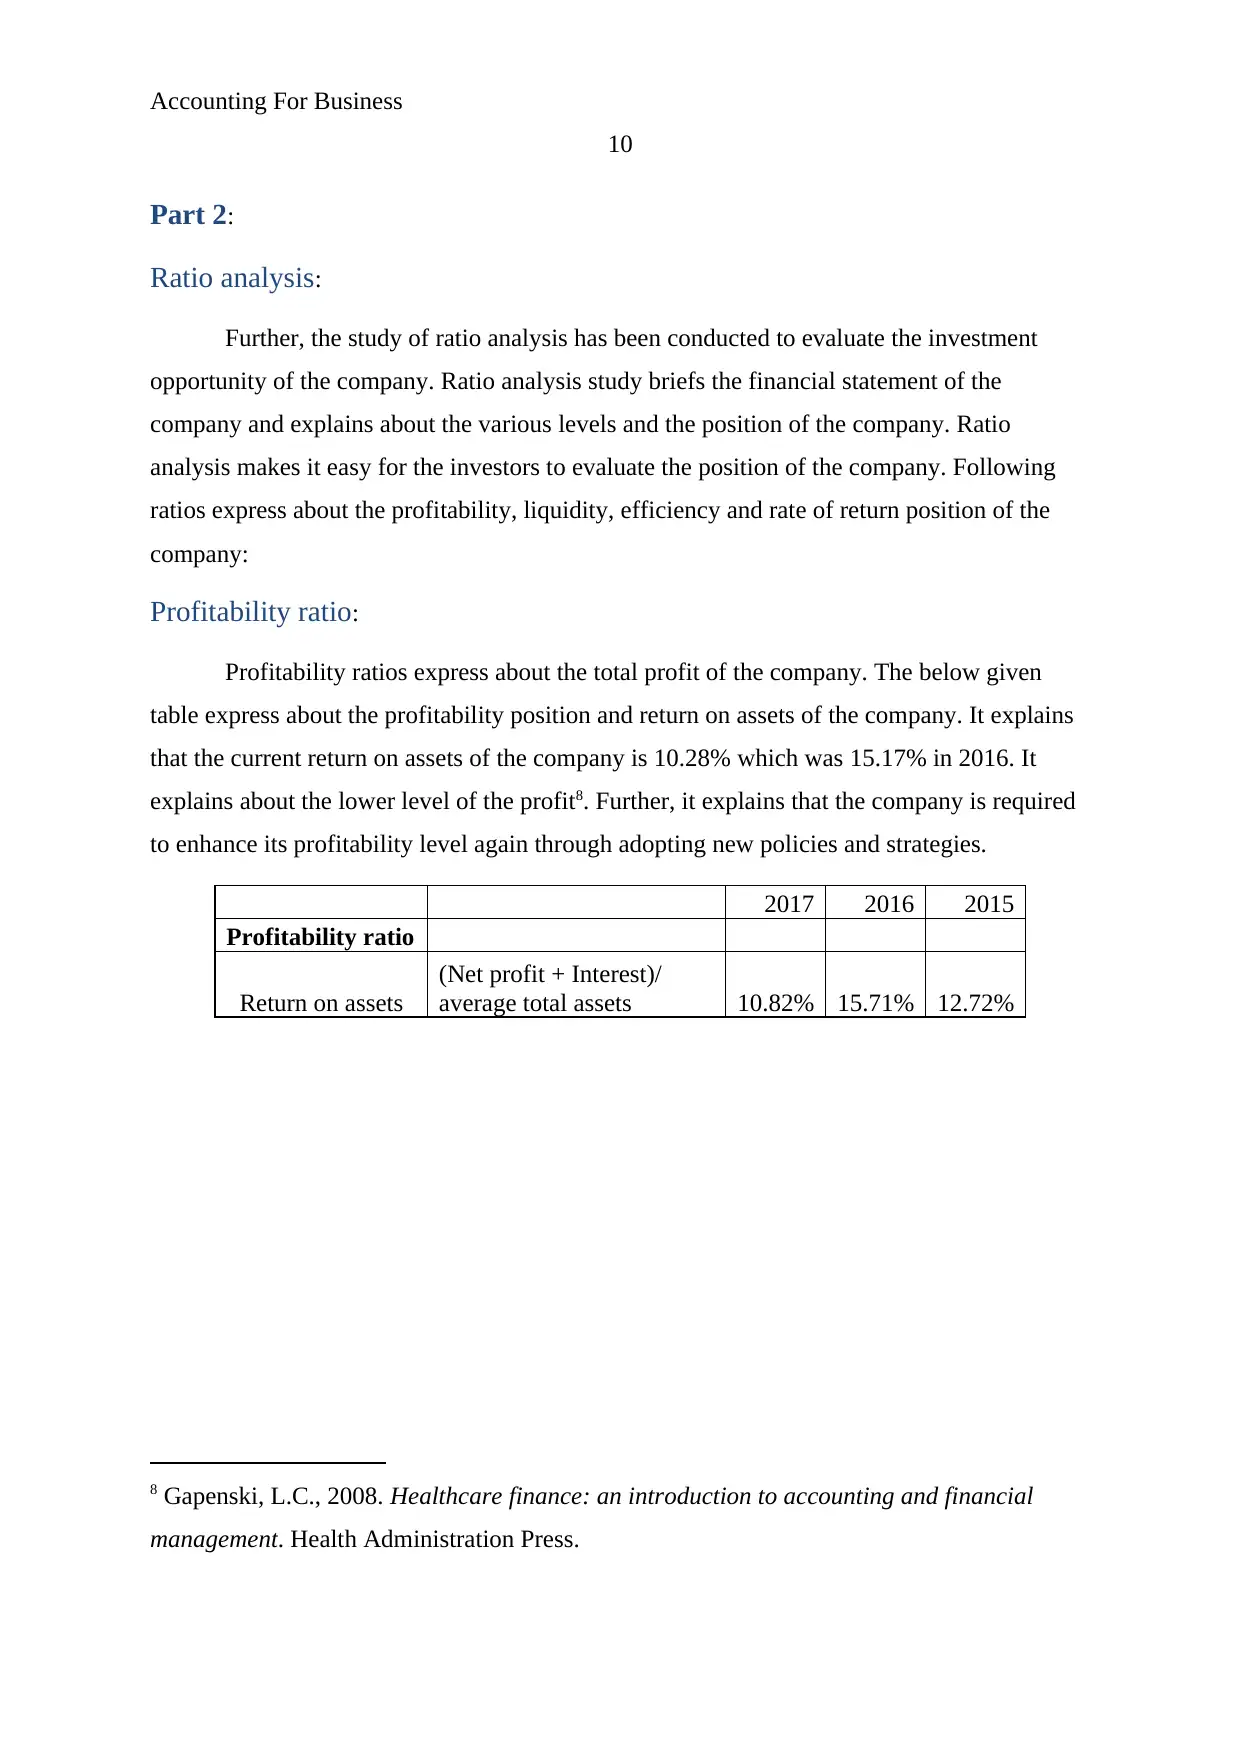
Profitability ratio:
Profitability ratios express about the total profit of the company. The below given
table express about the profitability position and return on assets of the company. It explains
that the current return on assets of the company is 10.28% which was 15.17% in 2016. It
explains about the lower level of the profit8. Further, it explains that the company is required
to enhance its profitability level again through adopting new policies and strategies.
2017 2016 2015
Profitability ratio
Return on assets
(Net profit + Interest)/
average total assets 10.82% 15.71% 12.72%
8 Gapenski, L.C., 2008. Healthcare finance: an introduction to accounting and financial
management. Health Administration Press.
10
Part 2:
Ratio analysis:
Further, the study of ratio analysis has been conducted to evaluate the investment
opportunity of the company. Ratio analysis study briefs the financial statement of the
company and explains about the various levels and the position of the company. Ratio
analysis makes it easy for the investors to evaluate the position of the company. Following
ratios express about the profitability, liquidity, efficiency and rate of return position of the
company:
Profitability ratio:
Profitability ratios express about the total profit of the company. The below given
table express about the profitability position and return on assets of the company. It explains
that the current return on assets of the company is 10.28% which was 15.17% in 2016. It
explains about the lower level of the profit8. Further, it explains that the company is required
to enhance its profitability level again through adopting new policies and strategies.
2017 2016 2015
Profitability ratio
Return on assets
(Net profit + Interest)/
average total assets 10.82% 15.71% 12.72%
8 Gapenski, L.C., 2008. Healthcare finance: an introduction to accounting and financial
management. Health Administration Press.
Paraphrase This Document
Need a fresh take? Get an instant paraphrase of this document with our AI Paraphraser
Accounting For Business
11
Figure 1: Profitability Level
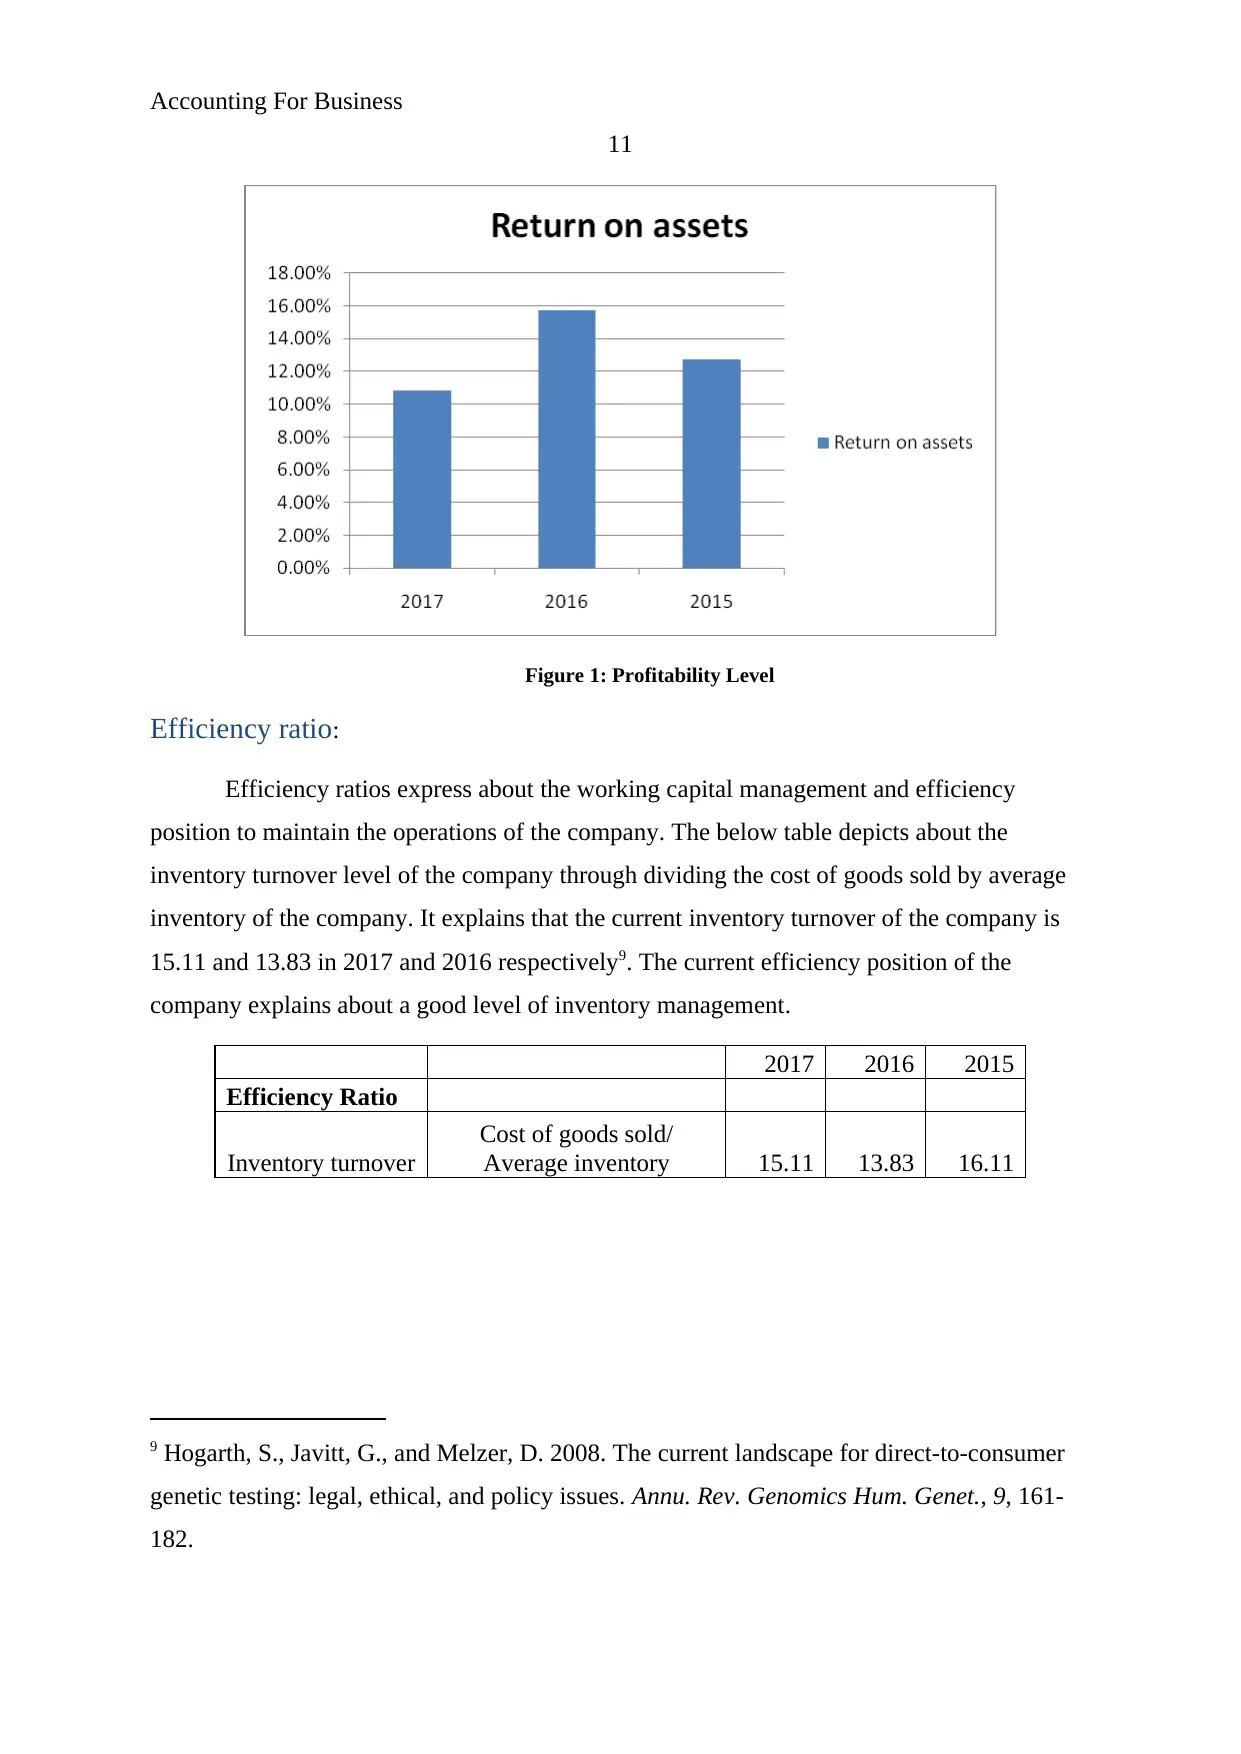
Efficiency ratio:
Efficiency ratios express about the working capital management and efficiency
position to maintain the operations of the company. The below table depicts about the
inventory turnover level of the company through dividing the cost of goods sold by average
inventory of the company. It explains that the current inventory turnover of the company is
15.11 and 13.83 in 2017 and 2016 respectively9. The current efficiency position of the
company explains about a good level of inventory management.
2017 2016 2015
Efficiency Ratio
Inventory turnover
Cost of goods sold/
Average inventory 15.11 13.83 16.11
9 Hogarth, S., Javitt, G., and Melzer, D. 2008. The current landscape for direct-to-consumer
genetic testing: legal, ethical, and policy issues. Annu. Rev. Genomics Hum. Genet., 9, 161-
182.
11
Figure 1: Profitability Level
Efficiency ratio:
Efficiency ratios express about the working capital management and efficiency
position to maintain the operations of the company. The below table depicts about the
inventory turnover level of the company through dividing the cost of goods sold by average
inventory of the company. It explains that the current inventory turnover of the company is
15.11 and 13.83 in 2017 and 2016 respectively9. The current efficiency position of the
company explains about a good level of inventory management.
2017 2016 2015
Efficiency Ratio
Inventory turnover
Cost of goods sold/
Average inventory 15.11 13.83 16.11
9 Hogarth, S., Javitt, G., and Melzer, D. 2008. The current landscape for direct-to-consumer
genetic testing: legal, ethical, and policy issues. Annu. Rev. Genomics Hum. Genet., 9, 161-
182.
Accounting For Business
12
Figure 2: Inventory Turnover
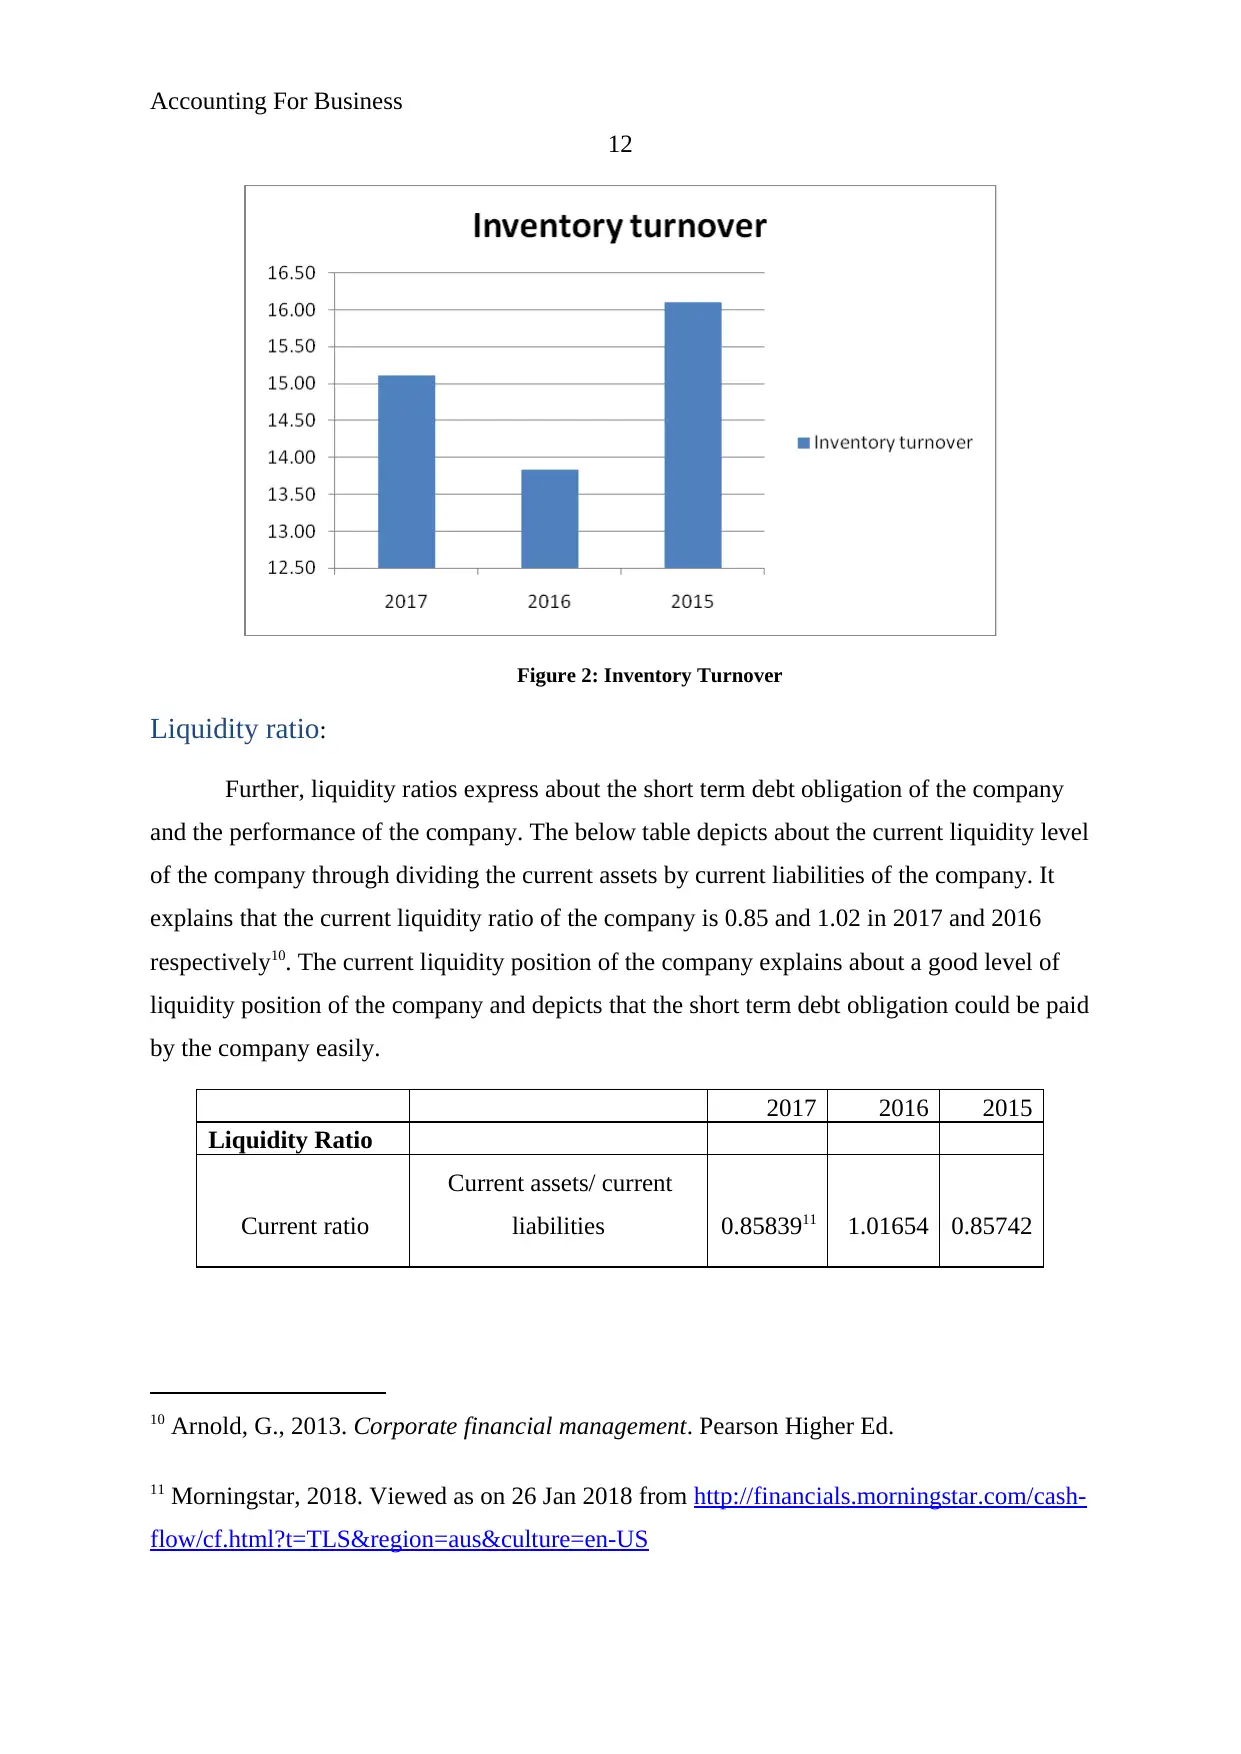
Liquidity ratio:
Further, liquidity ratios express about the short term debt obligation of the company
and the performance of the company. The below table depicts about the current liquidity level
of the company through dividing the current assets by current liabilities of the company. It
explains that the current liquidity ratio of the company is 0.85 and 1.02 in 2017 and 2016
respectively10. The current liquidity position of the company explains about a good level of
liquidity position of the company and depicts that the short term debt obligation could be paid
by the company easily.
2017 2016 2015
Liquidity Ratio
Current ratio
Current assets/ current
liabilities 0.8583911 1.01654 0.85742
10 Arnold, G., 2013. Corporate financial management. Pearson Higher Ed.
11 Morningstar, 2018. Viewed as on 26 Jan 2018 from http://financials.morningstar.com/cash-
flow/cf.html?t=TLS®ion=aus&culture=en-US
12
Figure 2: Inventory Turnover
Liquidity ratio:
Further, liquidity ratios express about the short term debt obligation of the company
and the performance of the company. The below table depicts about the current liquidity level
of the company through dividing the current assets by current liabilities of the company. It
explains that the current liquidity ratio of the company is 0.85 and 1.02 in 2017 and 2016
respectively10. The current liquidity position of the company explains about a good level of
liquidity position of the company and depicts that the short term debt obligation could be paid
by the company easily.
2017 2016 2015
Liquidity Ratio
Current ratio
Current assets/ current
liabilities 0.8583911 1.01654 0.85742
10 Arnold, G., 2013. Corporate financial management. Pearson Higher Ed.
11 Morningstar, 2018. Viewed as on 26 Jan 2018 from http://financials.morningstar.com/cash-
flow/cf.html?t=TLS®ion=aus&culture=en-US
⊘ This is a preview!⊘
Do you want full access?
Subscribe today to unlock all pages.
Trusted by 1+ million students worldwide
1 out of 17
Related Documents


Your All-in-One AI-Powered Toolkit for Academic Success.
+13062052269
info@desklib.com
Available 24*7 on WhatsApp / Email
![[object Object]](/_next/static/media/star-bottom.7253800d.svg)
Unlock your academic potential
Copyright © 2020–2026 A2Z Services. All Rights Reserved. Developed and managed by ZUCOL.