Financial Analysis of Telstra Corporation - Accounting Assignment
VerifiedAdded on 2020/05/11
|16
|2383
|103
Report
AI Summary
This report provides a comprehensive financial analysis of Telstra Corporation Limited, a leading telecommunications company in Australia. It begins with an introduction to Telstra, its operations, and its position in the industry, including its recent performance and future plans. The core of the report focuses on the analysis of Telstra's financial statements, including the income statement, statement of financial position, and statement of cash flows, over a five-year period. The analysis includes a trend analysis and common size statement analysis to assess the company's financial performance. Furthermore, the report delves into ratio analysis, covering profitability, turnover, liquidity, and solvency ratios to evaluate the company's financial health and efficiency. The analysis considers industry trends and benchmarks to provide a comparative perspective. The conclusion summarizes the key findings and provides insights into Telstra's overall financial performance and its potential for future growth, highlighting its strengths and areas for improvement. The report is based on the financial data available up to June 30, 2017.
INTRODUCTION TO ACCOUNTING AND FINANCE ASSIGNMENT
Paraphrase This Document
Need a fresh take? Get an instant paraphrase of this document with our AI Paraphraser
1
By student name
Professor
University
Date: 25 October 2017.
1 | P a g e
By student name
Professor
University
Date: 25 October 2017.
1 | P a g e
2
Contents
Introduction.............……………………………………………………………………………………….3
Industry Situation and Company Plans..…………………………………………………….......5
Financial Statement Analysis..……………………………………………………………..............6
Ratio analysis…………………….........………………………………………………………….….......11
Conclusion………….......………………………………………………………………………………......13
Refrences.....……………………………………………………………….....................................14
2 | P a g e
⊘ This is a preview!⊘
Do you want full access?
Subscribe today to unlock all pages.
Trusted by 1+ million students worldwide
3
Introduction
Telstra Corporation Limited has been chosen as the company for analysis. It is one of the largest
telecommunication company in Australia and is listed on the Australian Stock Exchange. It
builds and operates networks and deals in voice, mobile devices, internet, television and other
entertainment services and products (Alexander, 2016). It is the telecommunication leader in
Australia. It is fully privatised and has its head office at Melbourne.
The CEO of the company is Andy Penn, who succeeded David Thodey in the past. The Home
office of the company is in Telstra Corporate Centre, Melbourne, Australia. Telstra follows the
financial year July to June and therefore the last concluded financial year was June 30, 2017.
The company deals in a number of telecommunication products and services in both the
wholesale and the retail market including broadband network, fixed telephony, cable internet,
ADSL , mobile broadband, satellite internet, dial up internet, low cost internet, subscription
television, etc. The main geographic area within which the company caters its clients is
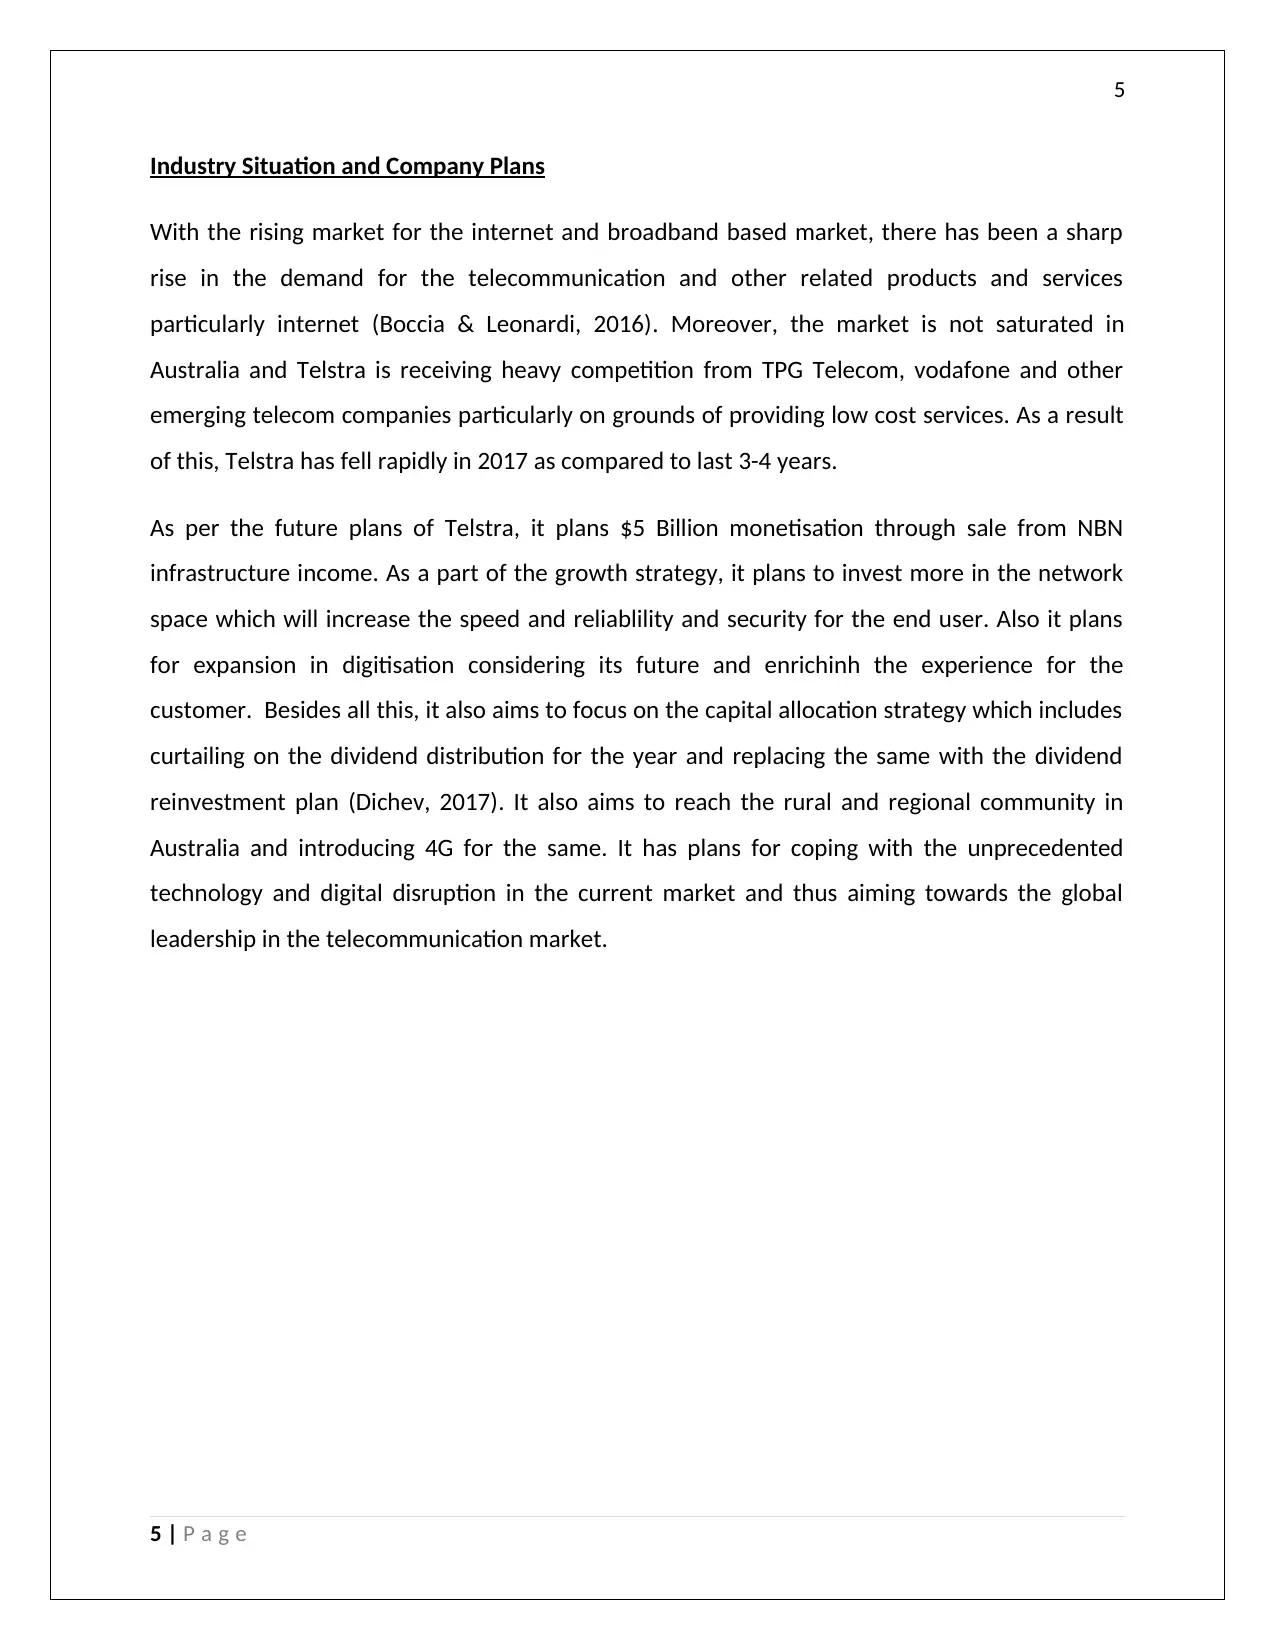
Australia and New Zealand. The company’s independent auditors for the year ended 30th June,
2017 were Ernst & Young, who declared that Telstra has made no contravention against what is
mentioned in Corporation Act 2001 and the applicable professional code of conduct (Bena, et
al., 2017). Further, they have mentioned that the financials have been prepared as per the
Australian Accounting Standards and International Financial Reporting Standards and that they
give the true and fair view of the consolidated performance of the company. Also, they have
received all the declarations as required by Sectio 295A of the Corporations Act, 2001. Also,
they declared that on reasonable grounds it can be concluded that the company woud be able
to pay off its debts as and when it becomes due. The most recent price of the company’s stock
was AUD 3.54 per share as on 27th October, 2017 and the dividend per share was found to be
15.5 cents which was fully franked.
3 | P a g e
Introduction
Telstra Corporation Limited has been chosen as the company for analysis. It is one of the largest
telecommunication company in Australia and is listed on the Australian Stock Exchange. It
builds and operates networks and deals in voice, mobile devices, internet, television and other
entertainment services and products (Alexander, 2016). It is the telecommunication leader in
Australia. It is fully privatised and has its head office at Melbourne.
The CEO of the company is Andy Penn, who succeeded David Thodey in the past. The Home
office of the company is in Telstra Corporate Centre, Melbourne, Australia. Telstra follows the
financial year July to June and therefore the last concluded financial year was June 30, 2017.
The company deals in a number of telecommunication products and services in both the
wholesale and the retail market including broadband network, fixed telephony, cable internet,
ADSL , mobile broadband, satellite internet, dial up internet, low cost internet, subscription
television, etc. The main geographic area within which the company caters its clients is
Australia and New Zealand. The company’s independent auditors for the year ended 30th June,
2017 were Ernst & Young, who declared that Telstra has made no contravention against what is
mentioned in Corporation Act 2001 and the applicable professional code of conduct (Bena, et
al., 2017). Further, they have mentioned that the financials have been prepared as per the
Australian Accounting Standards and International Financial Reporting Standards and that they
give the true and fair view of the consolidated performance of the company. Also, they have
received all the declarations as required by Sectio 295A of the Corporations Act, 2001. Also,
they declared that on reasonable grounds it can be concluded that the company woud be able
to pay off its debts as and when it becomes due. The most recent price of the company’s stock
was AUD 3.54 per share as on 27th October, 2017 and the dividend per share was found to be
15.5 cents which was fully franked.
3 | P a g e
Paraphrase This Document
Need a fresh take? Get an instant paraphrase of this document with our AI Paraphraser
4
4
4 | P a g e
4
4 | P a g e
5
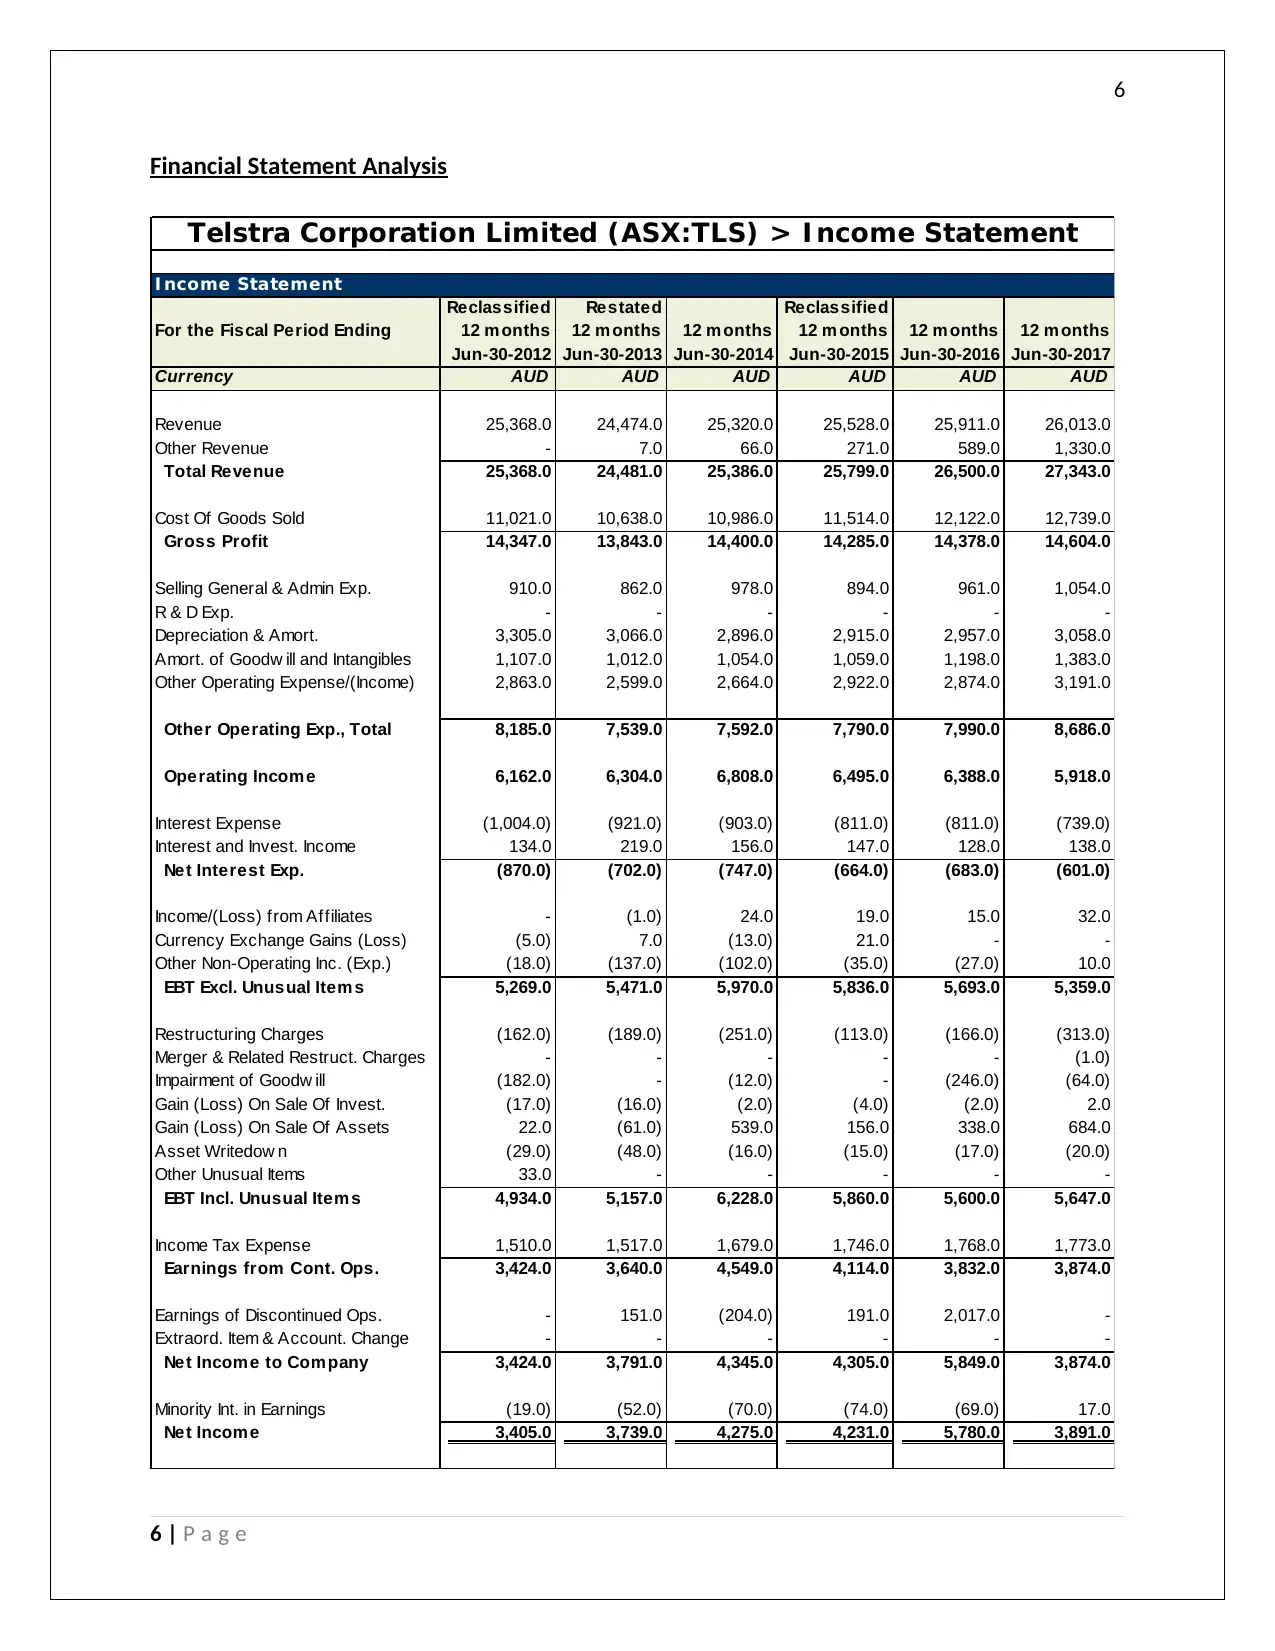
Industry Situation and Company Plans
With the rising market for the internet and broadband based market, there has been a sharp
rise in the demand for the telecommunication and other related products and services
particularly internet (Boccia & Leonardi, 2016). Moreover, the market is not saturated in
Australia and Telstra is receiving heavy competition from TPG Telecom, vodafone and other
emerging telecom companies particularly on grounds of providing low cost services. As a result
of this, Telstra has fell rapidly in 2017 as compared to last 3-4 years.
As per the future plans of Telstra, it plans $5 Billion monetisation through sale from NBN
infrastructure income. As a part of the growth strategy, it plans to invest more in the network
space which will increase the speed and reliablility and security for the end user. Also it plans
for expansion in digitisation considering its future and enrichinh the experience for the
customer. Besides all this, it also aims to focus on the capital allocation strategy which includes
curtailing on the dividend distribution for the year and replacing the same with the dividend
reinvestment plan (Dichev, 2017). It also aims to reach the rural and regional community in
Australia and introducing 4G for the same. It has plans for coping with the unprecedented
technology and digital disruption in the current market and thus aiming towards the global
leadership in the telecommunication market.
5 | P a g e
⊘ This is a preview!⊘
Do you want full access?
Subscribe today to unlock all pages.
Trusted by 1+ million students worldwide
6
Financial Statement Analysis
I ncome Statement
For the Fiscal Period Ending
Reclassified
12 m onths
Jun-30-2012
Restated
12 m onths
Jun-30-2013
12 m onths
Jun-30-2014
Reclassified
12 m onths
Jun-30-2015
12 m onths
Jun-30-2016
12 m onths
Jun-30-2017
Currency AUD AUD AUD AUD AUD AUD
Revenue 25,368.0 24,474.0 25,320.0 25,528.0 25,911.0 26,013.0
Other Revenue - 7.0 66.0 271.0 589.0 1,330.0
Total Revenue 25,368.0 24,481.0 25,386.0 25,799.0 26,500.0 27,343.0
Cost Of Goods Sold 11,021.0 10,638.0 10,986.0 11,514.0 12,122.0 12,739.0
Gross Profit 14,347.0 13,843.0 14,400.0 14,285.0 14,378.0 14,604.0
Selling General & Admin Exp. 910.0 862.0 978.0 894.0 961.0 1,054.0
R & D Exp. - - - - - -
Depreciation & Amort. 3,305.0 3,066.0 2,896.0 2,915.0 2,957.0 3,058.0
Amort. of Goodw ill and Intangibles 1,107.0 1,012.0 1,054.0 1,059.0 1,198.0 1,383.0
Other Operating Expense/(Income) 2,863.0 2,599.0 2,664.0 2,922.0 2,874.0 3,191.0
Other Operating Exp., Total 8,185.0 7,539.0 7,592.0 7,790.0 7,990.0 8,686.0
Operating Incom e 6,162.0 6,304.0 6,808.0 6,495.0 6,388.0 5,918.0
Interest Expense (1,004.0) (921.0) (903.0) (811.0) (811.0) (739.0)
Interest and Invest. Income 134.0 219.0 156.0 147.0 128.0 138.0
Net Interest Exp. (870.0) (702.0) (747.0) (664.0) (683.0) (601.0)
Income/(Loss) from Affiliates - (1.0) 24.0 19.0 15.0 32.0
Currency Exchange Gains (Loss) (5.0) 7.0 (13.0) 21.0 - -
Other Non-Operating Inc. (Exp.) (18.0) (137.0) (102.0) (35.0) (27.0) 10.0
EBT Excl. Unusual Item s 5,269.0 5,471.0 5,970.0 5,836.0 5,693.0 5,359.0
Restructuring Charges (162.0) (189.0) (251.0) (113.0) (166.0) (313.0)
Merger & Related Restruct. Charges - - - - - (1.0)
Impairment of Goodw ill (182.0) - (12.0) - (246.0) (64.0)
Gain (Loss) On Sale Of Invest. (17.0) (16.0) (2.0) (4.0) (2.0) 2.0
Gain (Loss) On Sale Of Assets 22.0 (61.0) 539.0 156.0 338.0 684.0
Asset Writedow n (29.0) (48.0) (16.0) (15.0) (17.0) (20.0)
Other Unusual Items 33.0 - - - - -
EBT Incl. Unusual Item s 4,934.0 5,157.0 6,228.0 5,860.0 5,600.0 5,647.0
Income Tax Expense 1,510.0 1,517.0 1,679.0 1,746.0 1,768.0 1,773.0
Earnings from Cont. Ops. 3,424.0 3,640.0 4,549.0 4,114.0 3,832.0 3,874.0
Earnings of Discontinued Ops. - 151.0 (204.0) 191.0 2,017.0 -
Extraord. Item & Account. Change - - - - - -
Net Incom e to Com pany 3,424.0 3,791.0 4,345.0 4,305.0 5,849.0 3,874.0
Minority Int. in Earnings (19.0) (52.0) (70.0) (74.0) (69.0) 17.0
Net Incom e 3,405.0 3,739.0 4,275.0 4,231.0 5,780.0 3,891.0
Telstra Corporation Limited (ASX:TLS) > I ncome Statement
6 | P a g e
Paraphrase This Document
Need a fresh take? Get an instant paraphrase of this document with our AI Paraphraser
7
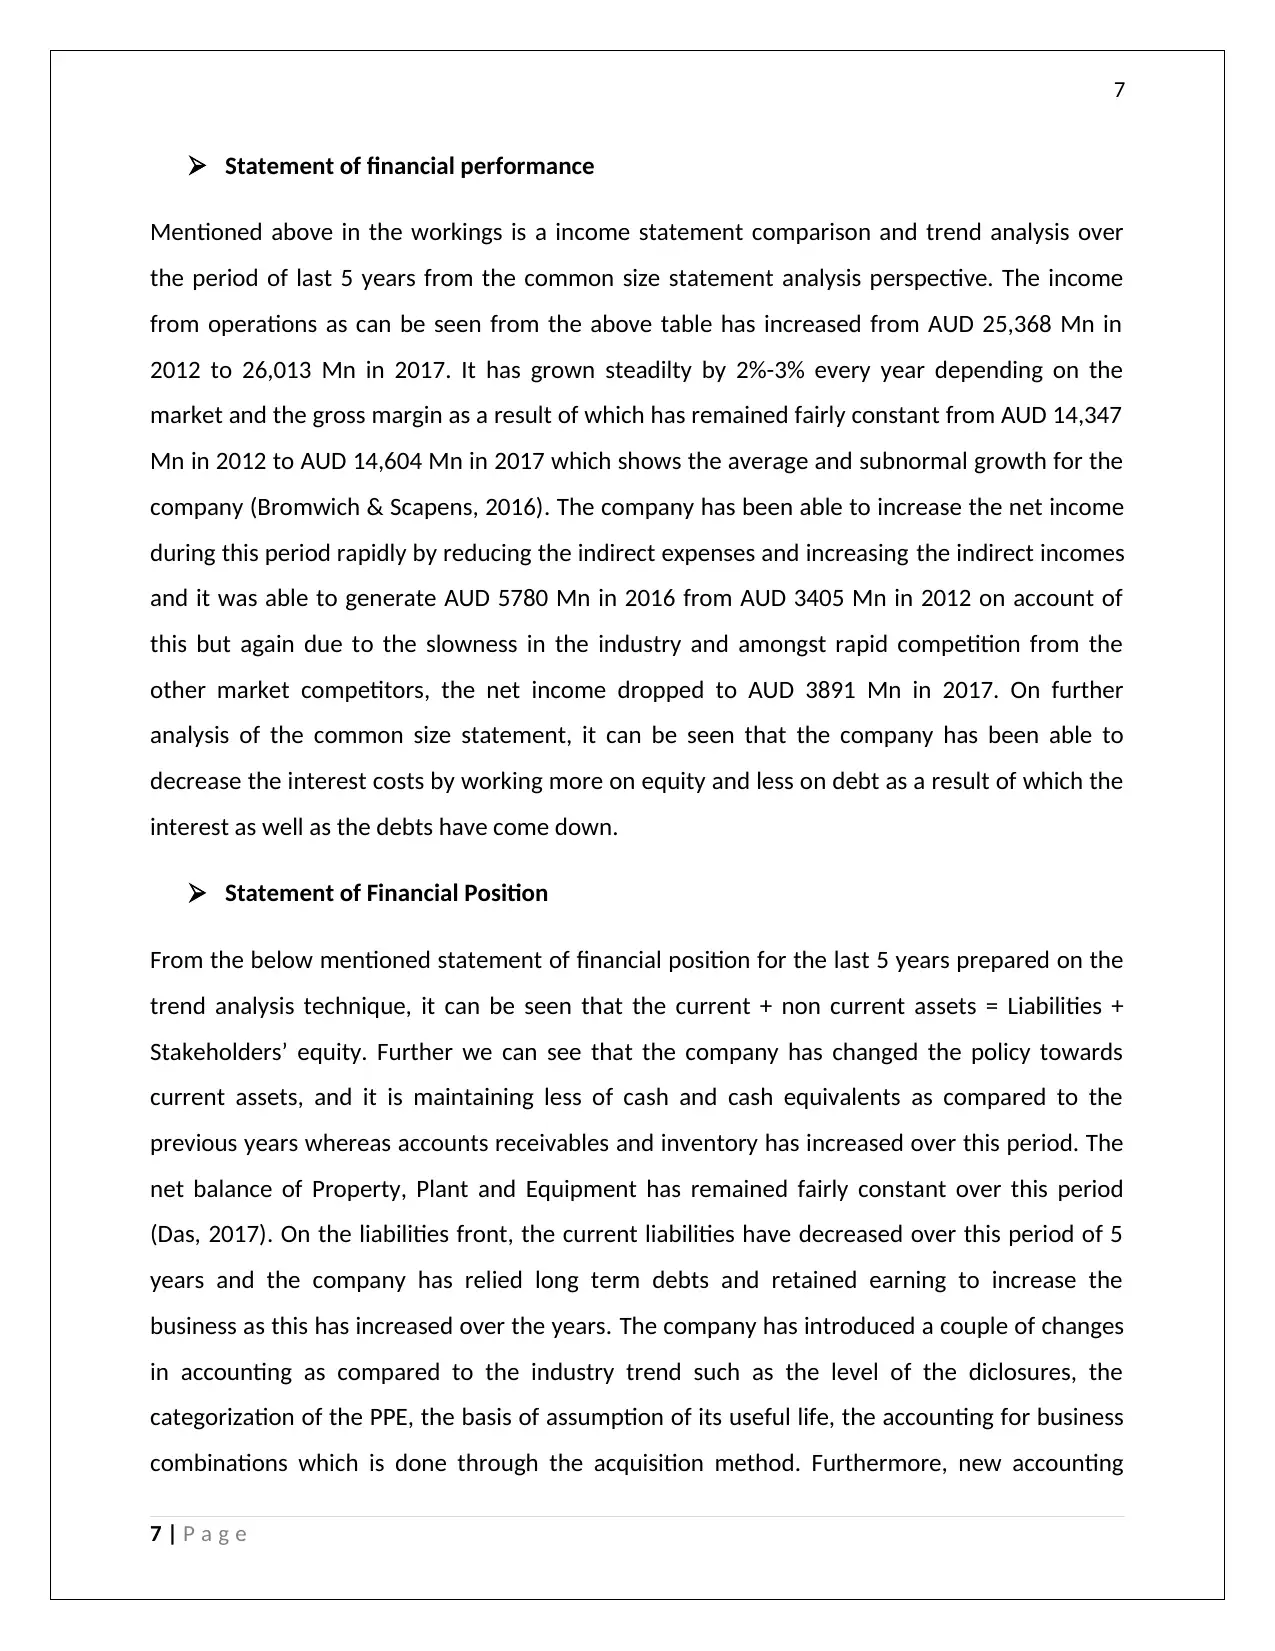
Statement of financial performance
Mentioned above in the workings is a income statement comparison and trend analysis over
the period of last 5 years from the common size statement analysis perspective. The income
from operations as can be seen from the above table has increased from AUD 25,368 Mn in
2012 to 26,013 Mn in 2017. It has grown steadilty by 2%-3% every year depending on the
market and the gross margin as a result of which has remained fairly constant from AUD 14,347
Mn in 2012 to AUD 14,604 Mn in 2017 which shows the average and subnormal growth for the
company (Bromwich & Scapens, 2016). The company has been able to increase the net income
during this period rapidly by reducing the indirect expenses and increasing the indirect incomes
and it was able to generate AUD 5780 Mn in 2016 from AUD 3405 Mn in 2012 on account of
this but again due to the slowness in the industry and amongst rapid competition from the
other market competitors, the net income dropped to AUD 3891 Mn in 2017. On further
analysis of the common size statement, it can be seen that the company has been able to
decrease the interest costs by working more on equity and less on debt as a result of which the
interest as well as the debts have come down.
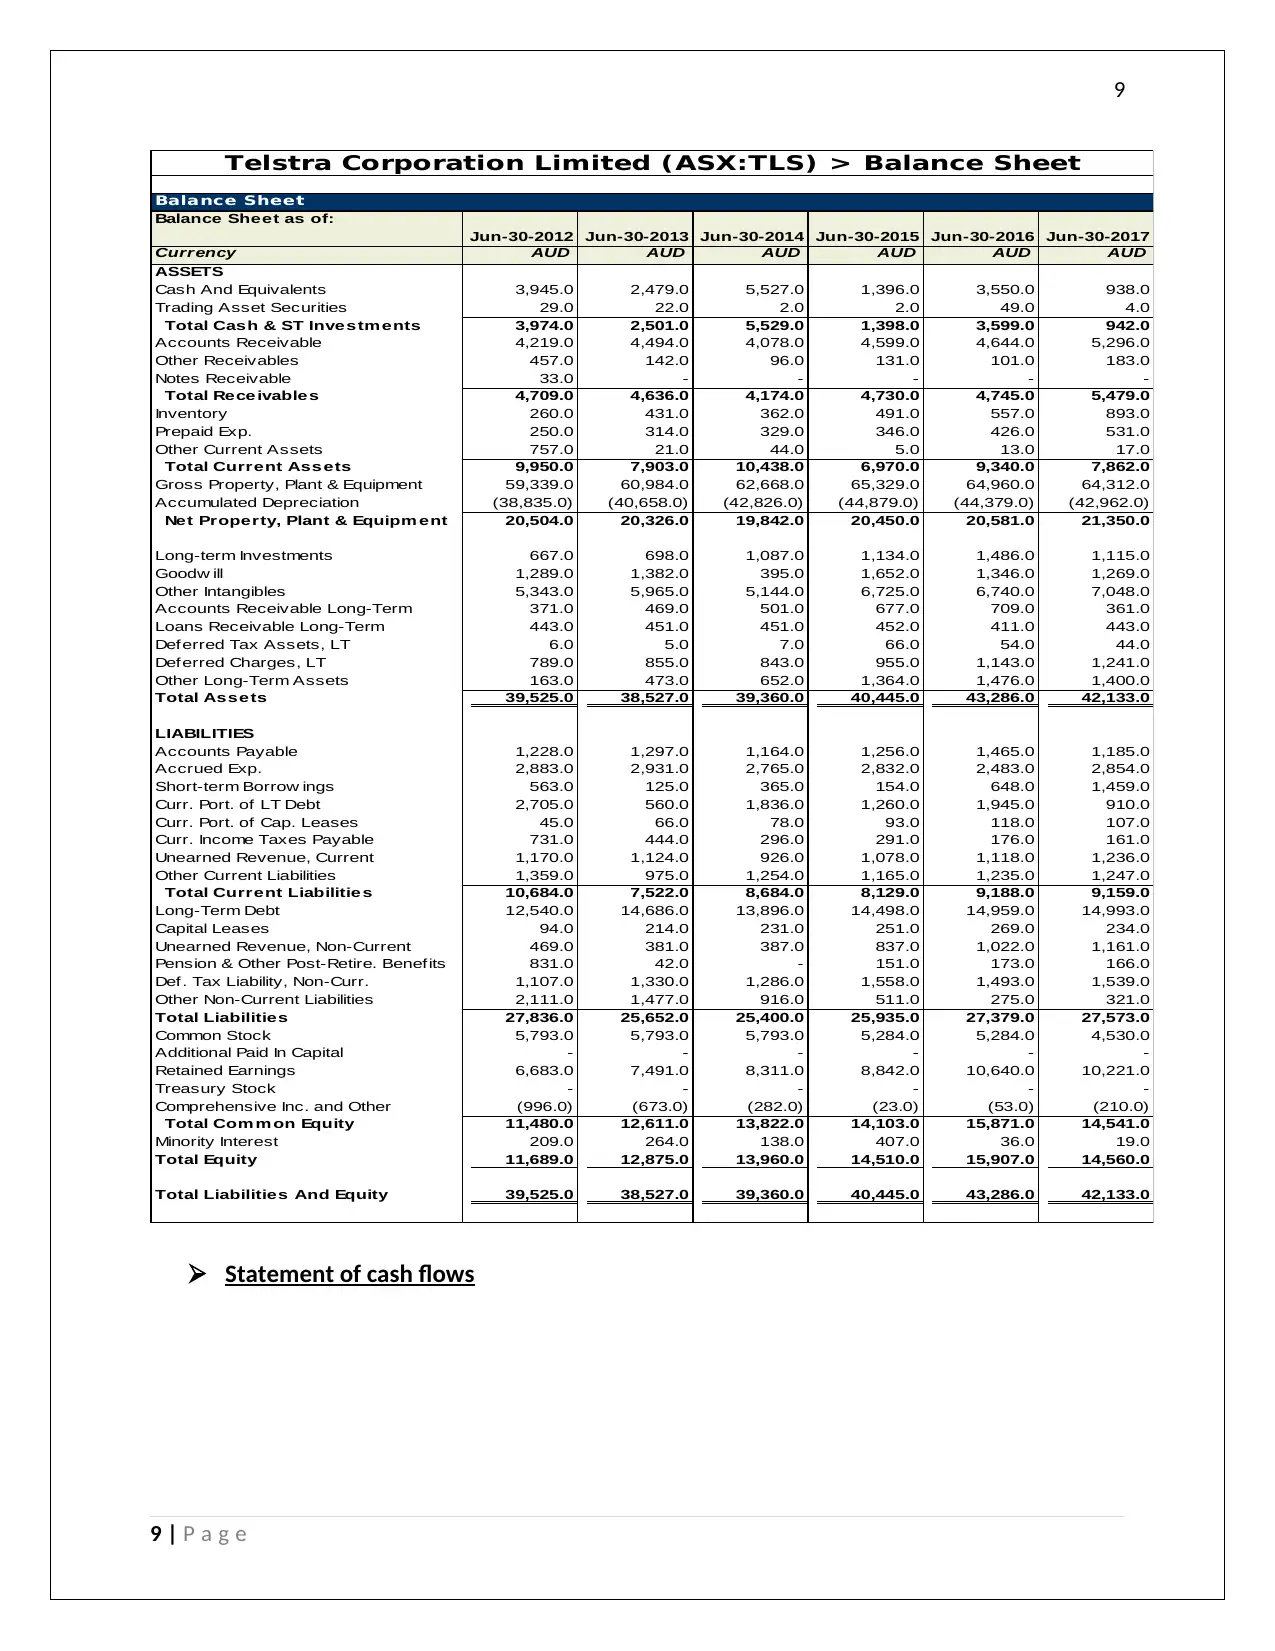
Statement of Financial Position
From the below mentioned statement of financial position for the last 5 years prepared on the
trend analysis technique, it can be seen that the current + non current assets = Liabilities +
Stakeholders’ equity. Further we can see that the company has changed the policy towards
current assets, and it is maintaining less of cash and cash equivalents as compared to the
previous years whereas accounts receivables and inventory has increased over this period. The
net balance of Property, Plant and Equipment has remained fairly constant over this period
(Das, 2017). On the liabilities front, the current liabilities have decreased over this period of 5
years and the company has relied long term debts and retained earning to increase the
business as this has increased over the years. The company has introduced a couple of changes
in accounting as compared to the industry trend such as the level of the diclosures, the
categorization of the PPE, the basis of assumption of its useful life, the accounting for business
combinations which is done through the acquisition method. Furthermore, new accounting
7 | P a g e
Statement of financial performance
Mentioned above in the workings is a income statement comparison and trend analysis over
the period of last 5 years from the common size statement analysis perspective. The income
from operations as can be seen from the above table has increased from AUD 25,368 Mn in
2012 to 26,013 Mn in 2017. It has grown steadilty by 2%-3% every year depending on the
market and the gross margin as a result of which has remained fairly constant from AUD 14,347
Mn in 2012 to AUD 14,604 Mn in 2017 which shows the average and subnormal growth for the
company (Bromwich & Scapens, 2016). The company has been able to increase the net income
during this period rapidly by reducing the indirect expenses and increasing the indirect incomes
and it was able to generate AUD 5780 Mn in 2016 from AUD 3405 Mn in 2012 on account of
this but again due to the slowness in the industry and amongst rapid competition from the
other market competitors, the net income dropped to AUD 3891 Mn in 2017. On further
analysis of the common size statement, it can be seen that the company has been able to
decrease the interest costs by working more on equity and less on debt as a result of which the
interest as well as the debts have come down.
Statement of Financial Position
From the below mentioned statement of financial position for the last 5 years prepared on the
trend analysis technique, it can be seen that the current + non current assets = Liabilities +
Stakeholders’ equity. Further we can see that the company has changed the policy towards
current assets, and it is maintaining less of cash and cash equivalents as compared to the
previous years whereas accounts receivables and inventory has increased over this period. The
net balance of Property, Plant and Equipment has remained fairly constant over this period
(Das, 2017). On the liabilities front, the current liabilities have decreased over this period of 5
years and the company has relied long term debts and retained earning to increase the
business as this has increased over the years. The company has introduced a couple of changes
in accounting as compared to the industry trend such as the level of the diclosures, the
categorization of the PPE, the basis of assumption of its useful life, the accounting for business
combinations which is done through the acquisition method. Furthermore, new accounting
7 | P a g e
8
standards have been applied in accounting for impairment of financial assets, revenue from
contracts from customers, and new leasing standard introduced AASB 16 has been used in
Accounting for leases as against AASB 117 which was being used earlier. The new thing which
sets apart Telstra from all the other company in the industry is the introduction of the new IT
system as mentioned in the Auditor’s report which has added to the internal control and
operating effectiveness of the company.
8 | P a g e
⊘ This is a preview!⊘
Do you want full access?
Subscribe today to unlock all pages.
Trusted by 1+ million students worldwide
9
Balance Sheet
Balance Sheet as of:
Jun-30-2012 Jun-30-2013 Jun-30-2014 Jun-30-2015 Jun-30-2016 Jun-30-2017
Currency AUD AUD AUD AUD AUD AUD
ASSETS
Cash And Equivalents 3,945.0 2,479.0 5,527.0 1,396.0 3,550.0 938.0
Trading Asset Securities 29.0 22.0 2.0 2.0 49.0 4.0
Total Cash & ST Investments 3,974.0 2,501.0 5,529.0 1,398.0 3,599.0 942.0
Accounts Receivable 4,219.0 4,494.0 4,078.0 4,599.0 4,644.0 5,296.0
Other Receivables 457.0 142.0 96.0 131.0 101.0 183.0
Notes Receivable 33.0 - - - - -
Total Receivables 4,709.0 4,636.0 4,174.0 4,730.0 4,745.0 5,479.0
Inventory 260.0 431.0 362.0 491.0 557.0 893.0
Prepaid Exp. 250.0 314.0 329.0 346.0 426.0 531.0
Other Current Assets 757.0 21.0 44.0 5.0 13.0 17.0
Total Current Assets 9,950.0 7,903.0 10,438.0 6,970.0 9,340.0 7,862.0
Gross Property, Plant & Equipment 59,339.0 60,984.0 62,668.0 65,329.0 64,960.0 64,312.0
Accumulated Depreciation (38,835.0) (40,658.0) (42,826.0) (44,879.0) (44,379.0) (42,962.0)
Net Property, Plant & Equipm ent 20,504.0 20,326.0 19,842.0 20,450.0 20,581.0 21,350.0
Long-term Investments 667.0 698.0 1,087.0 1,134.0 1,486.0 1,115.0
Goodw ill 1,289.0 1,382.0 395.0 1,652.0 1,346.0 1,269.0
Other Intangibles 5,343.0 5,965.0 5,144.0 6,725.0 6,740.0 7,048.0
Accounts Receivable Long-Term 371.0 469.0 501.0 677.0 709.0 361.0
Loans Receivable Long-Term 443.0 451.0 451.0 452.0 411.0 443.0
Deferred Tax Assets, LT 6.0 5.0 7.0 66.0 54.0 44.0
Deferred Charges, LT 789.0 855.0 843.0 955.0 1,143.0 1,241.0
Other Long-Term Assets 163.0 473.0 652.0 1,364.0 1,476.0 1,400.0
Total Assets 39,525.0 38,527.0 39,360.0 40,445.0 43,286.0 42,133.0
LIABILITIES
Accounts Payable 1,228.0 1,297.0 1,164.0 1,256.0 1,465.0 1,185.0
Accrued Exp. 2,883.0 2,931.0 2,765.0 2,832.0 2,483.0 2,854.0
Short-term Borrow ings 563.0 125.0 365.0 154.0 648.0 1,459.0
Curr. Port. of LT Debt 2,705.0 560.0 1,836.0 1,260.0 1,945.0 910.0
Curr. Port. of Cap. Leases 45.0 66.0 78.0 93.0 118.0 107.0
Curr. Income Taxes Payable 731.0 444.0 296.0 291.0 176.0 161.0
Unearned Revenue, Current 1,170.0 1,124.0 926.0 1,078.0 1,118.0 1,236.0
Other Current Liabilities 1,359.0 975.0 1,254.0 1,165.0 1,235.0 1,247.0
Total Current Liabilities 10,684.0 7,522.0 8,684.0 8,129.0 9,188.0 9,159.0
Long-Term Debt 12,540.0 14,686.0 13,896.0 14,498.0 14,959.0 14,993.0
Capital Leases 94.0 214.0 231.0 251.0 269.0 234.0
Unearned Revenue, Non-Current 469.0 381.0 387.0 837.0 1,022.0 1,161.0
Pension & Other Post-Retire. Benefits 831.0 42.0 - 151.0 173.0 166.0
Def. Tax Liability, Non-Curr. 1,107.0 1,330.0 1,286.0 1,558.0 1,493.0 1,539.0
Other Non-Current Liabilities 2,111.0 1,477.0 916.0 511.0 275.0 321.0
Total Liabilities 27,836.0 25,652.0 25,400.0 25,935.0 27,379.0 27,573.0
Common Stock 5,793.0 5,793.0 5,793.0 5,284.0 5,284.0 4,530.0
Additional Paid In Capital - - - - - -
Retained Earnings 6,683.0 7,491.0 8,311.0 8,842.0 10,640.0 10,221.0
Treasury Stock - - - - - -
Comprehensive Inc. and Other (996.0) (673.0) (282.0) (23.0) (53.0) (210.0)
Total Com m on Equity 11,480.0 12,611.0 13,822.0 14,103.0 15,871.0 14,541.0
Minority Interest 209.0 264.0 138.0 407.0 36.0 19.0
Total Equity 11,689.0 12,875.0 13,960.0 14,510.0 15,907.0 14,560.0
Total Liabilities And Equity 39,525.0 38,527.0 39,360.0 40,445.0 43,286.0 42,133.0
Telstra Corporation Limited (ASX:TLS) > Balance Sheet
Statement of cash flows
9 | P a g e
Paraphrase This Document
Need a fresh take? Get an instant paraphrase of this document with our AI Paraphraser
10
Cash Flow
For the Fiscal Period Ending 12 m onths
Jun-30-2012
Restated
12 m onths
Jun-30-2013
12 m onths
Jun-30-2014
Reclassified
12 m onths
Jun-30-2015
Reclassified
12 m onths
Jun-30-2016
12 m onths
Jun-30-2017
Currency AUD AUD AUD AUD AUD AUD
Net Incom e 3,405.0 3,739.0 4,275.0 4,231.0 5,780.0 3,891.0
Depreciation & Amort. 3,305.0 3,066.0 2,897.0 2,915.0 2,957.0 3,058.0
Amort. of Goodw ill and Intangibles 211.0 144.0 177.0 142.0 195.0 225.0
Depreciation & Am ort., Total 3,516.0 3,210.0 3,074.0 3,057.0 3,152.0 3,283.0
Other Amortization 896.0 868.0 877.0 917.0 1,003.0 1,158.0
(Gain) Loss From Sale Of Assets (4.0) 61.0 (637.0) (154.0) (2,126.0) (684.0)
(Gain) Loss On Sale Of Invest. - - 2.0 (4.0) 2.0 (2.0)
Asset Writedow n & Restructuring Costs 211.0 49.0 28.0 15.0 264.0 88.0
(Income) Loss on Equity Invest. (108.0) (154.0) (189.0) (144.0) (52.0) (32.0)
Stock-Based Compensation 31.0 47.0 45.0 66.0 87.0 31.0
Net Cash From Discontinued Ops. - 314.0 37.0 200.0 2,027.0 -
Other Operating Activities 1,135.0 1,140.0 1,426.0 573.0 (1,212.0) 626.0
Change in Acc. Receivable (255.0) (249.0) (164.0) (457.0) (389.0) (370.0)
Change In Inventories 15.0 (173.0) 35.0 (122.0) (99.0) (335.0)
Change in Acc. Payable 168.0 (301.0) (192.0) 165.0 178.0 99.0
Change in Unearned Rev. 334.0 (99.0) 54.0 143.0 151.0 225.0
Change in Inc. Taxes (87.0) 84.0 (59.0) 32.0 (69.0) 26.0
Change in Other Net Operating Assets 19.0 (177.0) 1.0 (207.0) (564.0) (229.0)
Cash from Ops. 9,276.0 8,359.0 8,613.0 8,311.0 8,133.0 7,775.0
Capital Expenditure (3,006.0) (2,818.0) (2,868.0) (2,845.0) (3,051.0) (3,725.0)
Sale of Property, Plant, and Equipment 17.0 57.0 94.0 94.0 470.0 679.0
Cash Acquisitions - (9.0) (253.0) (986.0) (92.0) (63.0)
Divestitures (11.0) 697.0 2,397.0 1.0 1,340.0 -
Sale (Purchase) of Intangible assets (940.0) (1,679.0) (894.0) (2,257.0) (1,143.0) (1,596.0)
Invest. in Marketable & Equity Securt. 81.0 128.0 167.0 69.0 33.0 213.0
Net (Inc.) Dec. in Loans Originated/Sold 54.0 64.0 98.0 - - -
Other Investing Activities (274.0) 225.0 129.0 232.0 236.0 213.0
Cash from Investing (4,079.0) (3,335.0) (1,130.0) (5,692.0) (2,207.0) (4,279.0)
Short Term Debt Issued - - - - - -
Long-Term Debt Issued 3,049.0 2,126.0 1,572.0 1,793.0 4,987.0 4,710.0
Total Debt Issued 3,049.0 2,126.0 1,572.0 1,793.0 4,987.0 4,710.0
Short Term Debt Repaid - - - - - -
Long-Term Debt Repaid (2,276.0) (4,139.0) (1,478.0) (3,460.0) (4,055.0) (4,702.0)
Total Debt Repaid (2,276.0) (4,139.0) (1,478.0) (3,460.0) (4,055.0) (4,702.0)
Issuance of Common Stock 3.0 33.0 32.0 - - -
Repurchase of Common Stock - - (61.0) (1,058.0) (68.0) (1,524.0)
Common Dividends Paid (3,475.0) (3,480.0) (3,545.0) (3,699.0) (3,787.0) (3,736.0)
Total Dividends Paid (3,475.0) (3,480.0) (3,545.0) (3,699.0) (3,787.0) (3,736.0)
Special Dividend Paid - - - - - -
Other Financing Activities (1,207.0) (1,066.0) (950.0) (458.0) (854.0) (852.0)
Cash from Financing (3,906.0) (6,526.0) (4,430.0) (6,882.0) (3,777.0) (6,104.0)
Foreign Exchange Rate Adj. 17.0 36.0 (5.0) 132.0 5.0 (6.0)
Net Change in Cash 1,308.0 (1,466.0) 3,048.0 (4,131.0) 2,154.0 (2,614.0)
Telstra Corporation Limited (ASX:TLS) > Financials > Cash Flow
10 | P a g e
11
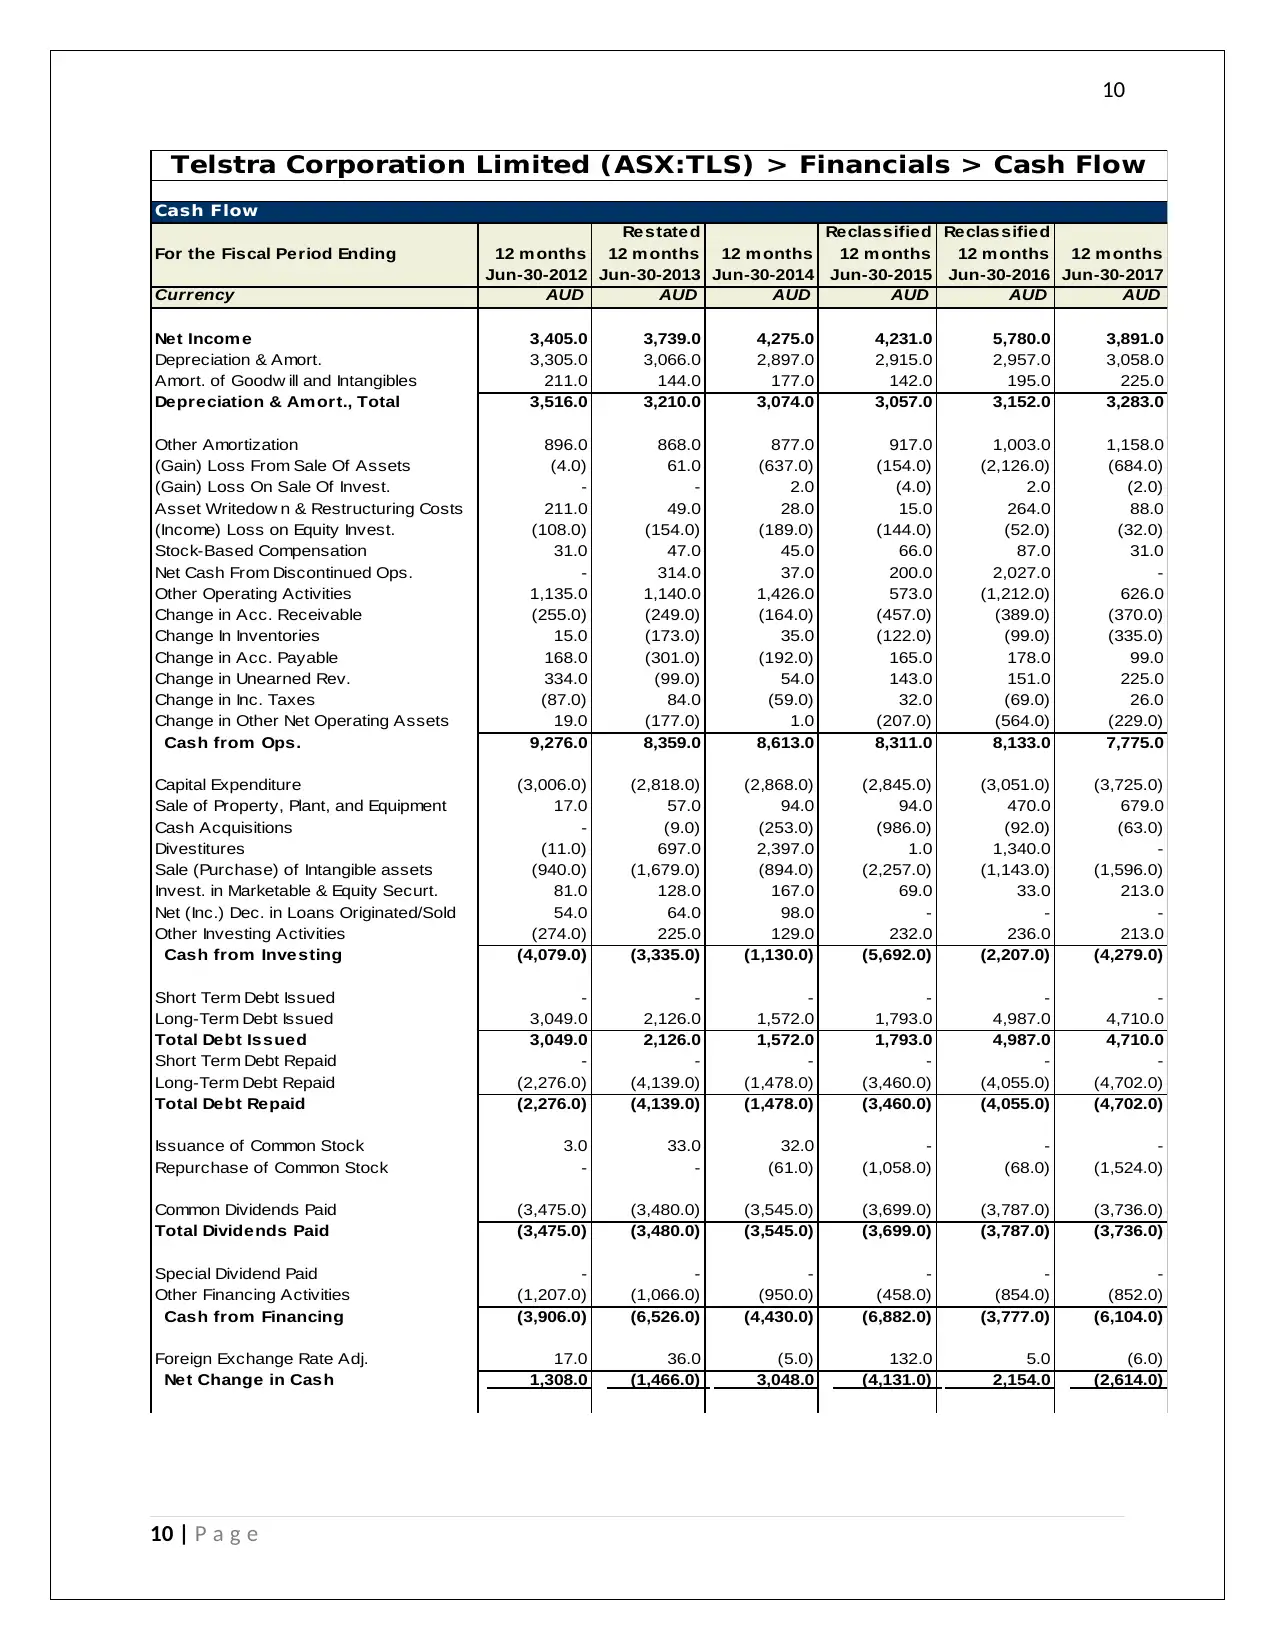
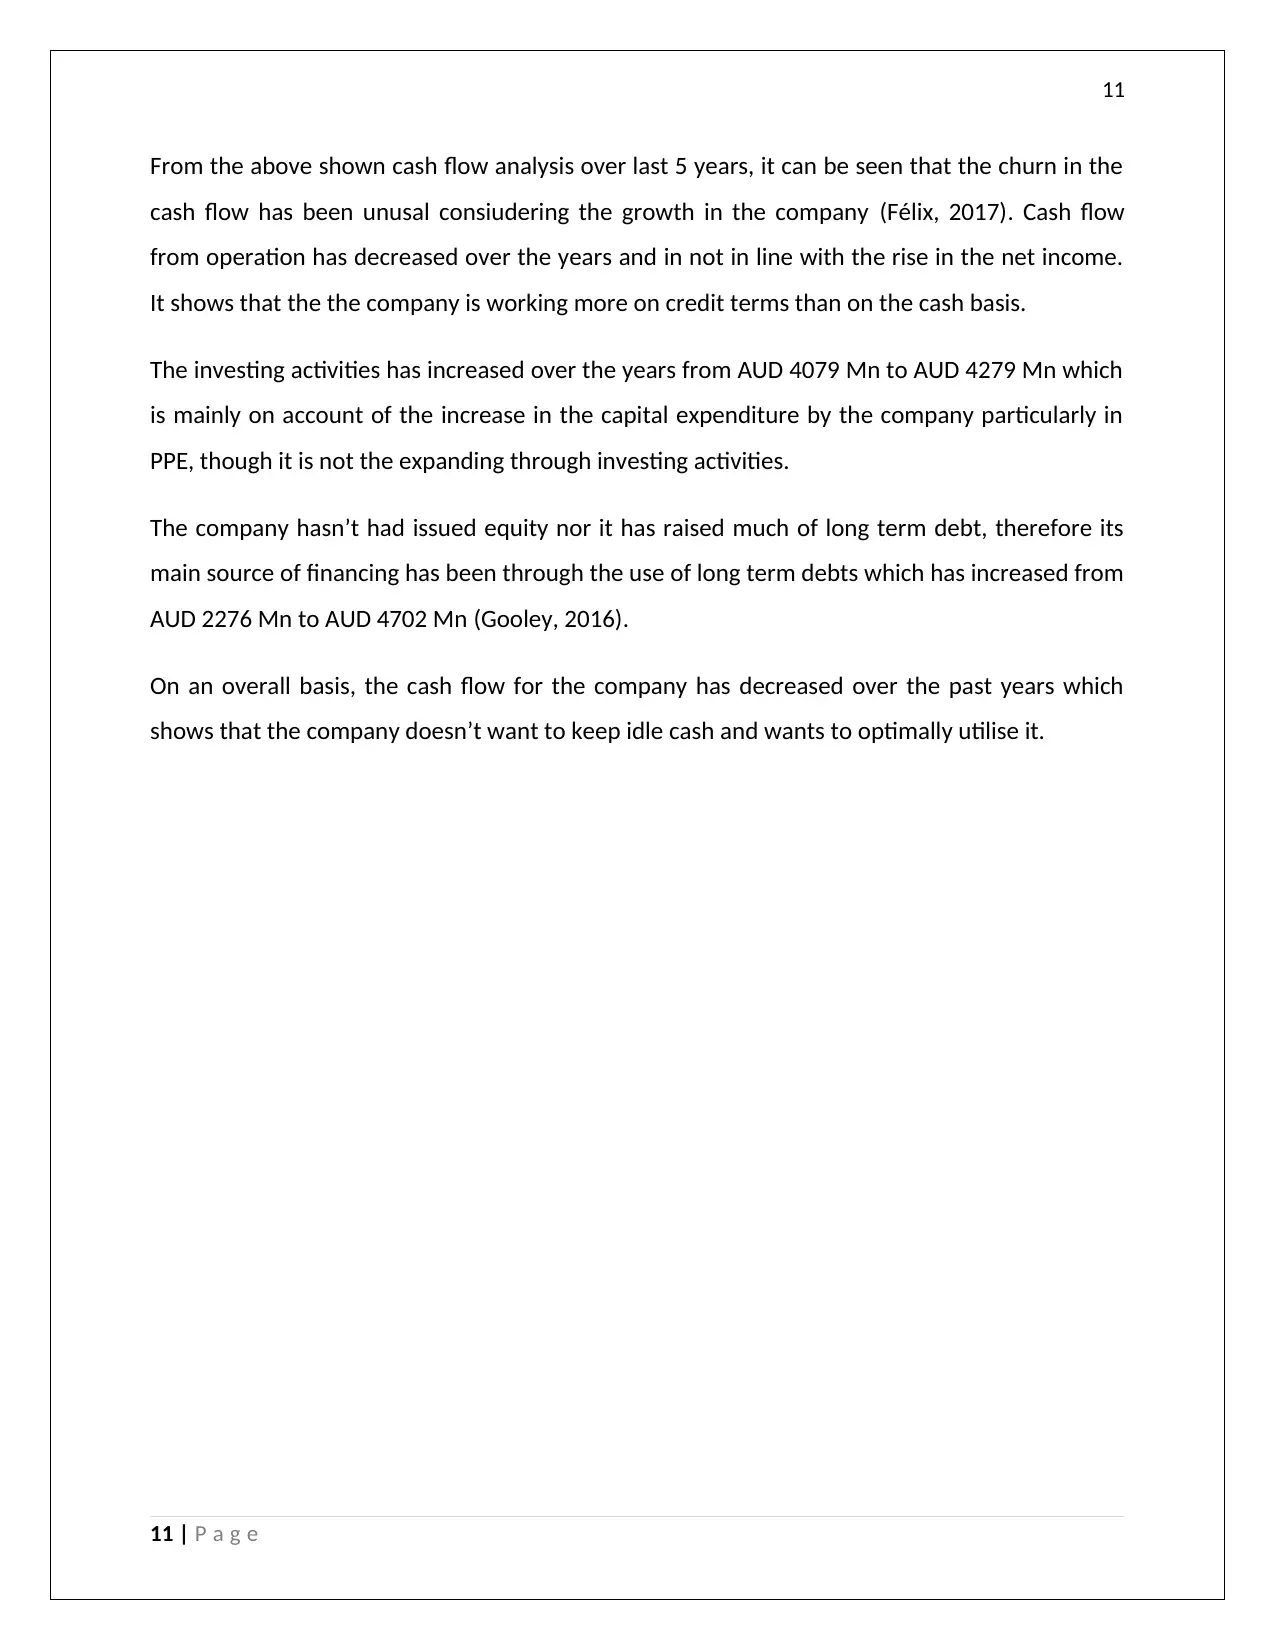
From the above shown cash flow analysis over last 5 years, it can be seen that the churn in the
cash flow has been unusal consiudering the growth in the company (Félix, 2017). Cash flow
from operation has decreased over the years and in not in line with the rise in the net income.
It shows that the the company is working more on credit terms than on the cash basis.
The investing activities has increased over the years from AUD 4079 Mn to AUD 4279 Mn which
is mainly on account of the increase in the capital expenditure by the company particularly in
PPE, though it is not the expanding through investing activities.
The company hasn’t had issued equity nor it has raised much of long term debt, therefore its
main source of financing has been through the use of long term debts which has increased from
AUD 2276 Mn to AUD 4702 Mn (Gooley, 2016).
On an overall basis, the cash flow for the company has decreased over the past years which
shows that the company doesn’t want to keep idle cash and wants to optimally utilise it.
11 | P a g e
⊘ This is a preview!⊘
Do you want full access?
Subscribe today to unlock all pages.
Trusted by 1+ million students worldwide
1 out of 16
Related Documents


Your All-in-One AI-Powered Toolkit for Academic Success.
+13062052269
info@desklib.com
Available 24*7 on WhatsApp / Email
![[object Object]](/_next/static/media/star-bottom.7253800d.svg)
Unlock your academic potential
Copyright © 2020–2026 A2Z Services. All Rights Reserved. Developed and managed by ZUCOL.