Accounting and Finance Report: Telstra Corporation Financial Analysis
VerifiedAdded on 2020/05/28
|34
|3667
|212
Report
AI Summary
This report presents a financial statement analysis of Telstra Corporation, a leading Australian telecommunications company. The analysis covers the years 2014-2016 and utilizes financial ratios, horizontal, and vertical analyses to assess the company's performance. The report examines the income statement, balance sheet, and cash flow statement, highlighting trends in income, expenses, assets, liabilities, and cash flows. Key findings include a decline in operating profit due to rising expenses, an increase in the asset base, and fluctuations in cash flows from operating, investing, and financing activities. The report also delves into profitability, efficiency, liquidity, and capital structure ratios, revealing insights into Telstra's financial health. The analysis concludes that Telstra is struggling to maintain its competitive advantage and recommends corrective measures for the management to improve financial performance.
Running head: ACCOUNTING AND FINANCE FOR MANAGERS
Accounting and Finance for Managers
Name of the Student:
Name of the University:
Author’s Note:
Course ID:
Accounting and Finance for Managers
Name of the Student:
Name of the University:
Author’s Note:
Course ID:
Paraphrase This Document
Need a fresh take? Get an instant paraphrase of this document with our AI Paraphraser
1ACCOUNTING AND FINANCE FOR MANAGERS
Executive Summary:
The current report aims to evaluate the financial statement analysis of Telstra Corporation
with the help of financial ratios, horizontal and vertical analyses. Telstra Corporation is one of
the leading telecommunication companies in Australia building and operating
telecommunication networks, mobiles, internet access, markets voice, paid television and other
entertainment products and services. It has been found that the growth in expenses has outrun the
growth of total income and hence, it could be stated that the organisation has to incur additional
cost to carry its business operations, while the revenue has not increased in tandem. Moreover,
the ratios computed denote that Telstra Corporation is struggling to maintain its competitive
advantage in the market. Hence, the management of the organisation needs to adopt corrective
measures to recover from such situation.
2ACCOUNTING AND FINANCE FOR MANAGERS
Table of Contents
1. Introduction:................................................................................................................................3
2. Income statement:........................................................................................................................3
3. Balance sheet statement:..............................................................................................................6
4. Cash flow statement:....................................................................................................................8
5. Financial ratio analysis:.............................................................................................................10
5.1 Profitability ratios:...............................................................................................................10
5.2 Efficiency ratios:..................................................................................................................11
5.3 Liquidity ratios:...................................................................................................................14
5.4 Capital structure ratios:........................................................................................................16
6. Conclusion:................................................................................................................................17
References and Bibliographies:.....................................................................................................19
Appendices:...................................................................................................................................21
⊘ This is a preview!⊘
Do you want full access?
Subscribe today to unlock all pages.
Trusted by 1+ million students worldwide
3ACCOUNTING AND FINANCE FOR MANAGERS
1. Introduction:
The current report aims to evaluate the financial statement analysis of Telstra Corporation
with the help of financial ratios, horizontal and vertical analyses. Telstra Corporation is one of
the leading telecommunication companies in Australia building and operating
telecommunication networks, mobiles, internet access, markets voice, paid television and other
entertainment products and services. After the deregulation of the telecommunications industry
in the beginning 1990s, the organisation has succeeded in remaining the biggest provider of
telecommunications services despite the growing popularity of its competitor, Optus. The
organisation has above 150 subsidiary businesses and it has managed to extend its market share
by discounting its mobile phone products as of 30th June 2016 (Telstra.com.au, 2018). Hence, the
current report would aim to evaluate its current performance by considering its financial reports
for the past three years.
2. Income statement:
According to Almamy, Aston & Ngwa (2016), the primary goal of a business
organisation is to create wealth or profit and the profit made in a particular year is the basic
concern of most of the users of financial statements. The income statement helps in gauging the
amount of profit that an organisation has earned in a year. Moreover, it enables the users to
obtain an insight of the way the profit was earned. Profit or loss could be defined as the
difference between incomes earned and expenses incurred. A profit denotes rise in shareholders’
equity, while a loss denotes fall in the same (Asquith & Weiss, 2016).
The following important items have been extracted from the income statement of Telstra
Corporation to evaluate its financial performance:
Paraphrase This Document
Need a fresh take? Get an instant paraphrase of this document with our AI Paraphraser
4ACCOUNTING AND FINANCE FOR MANAGERS
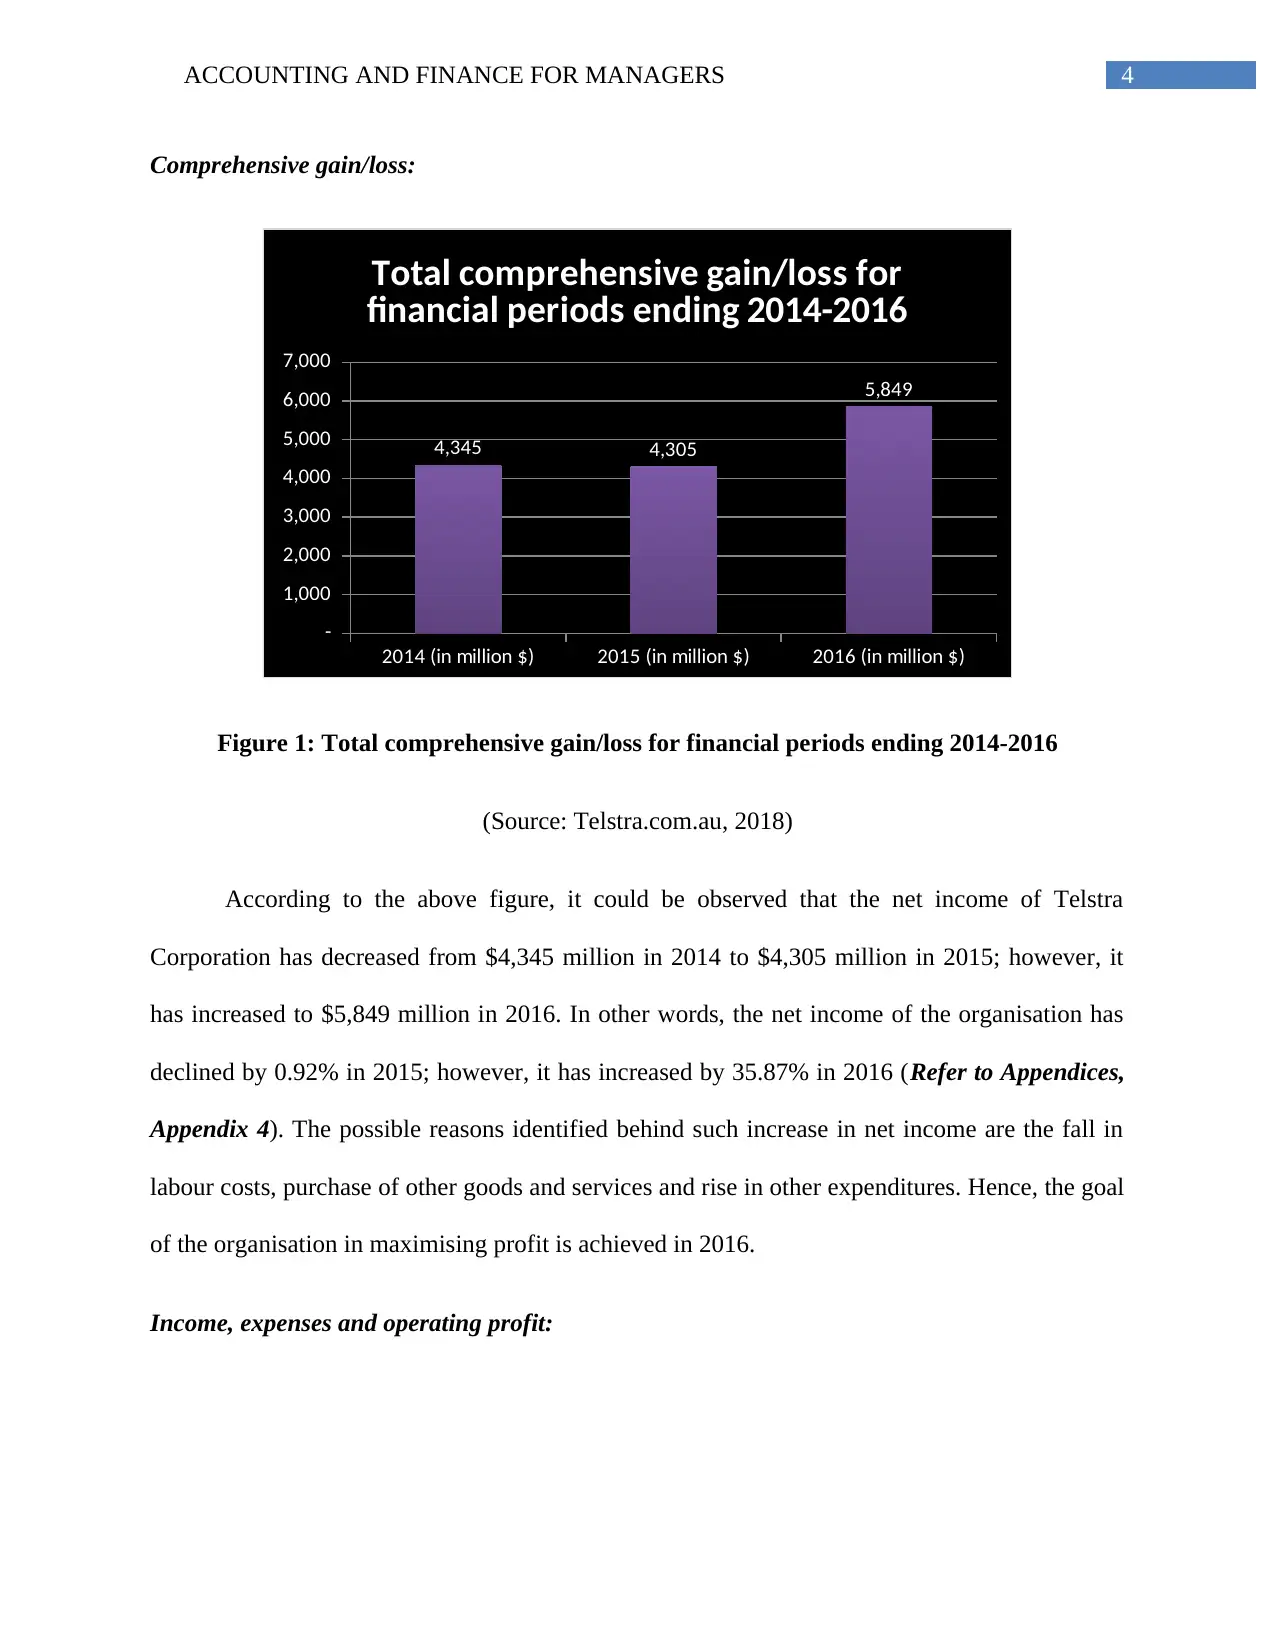
Comprehensive gain/loss:
2014 (in million $) 2015 (in million $) 2016 (in million $)
-
1,000
2,000
3,000
4,000
5,000
6,000
7,000
4,345 4,305
5,849
Total comprehensive gain/loss for
financial periods ending 2014-2016
Figure 1: Total comprehensive gain/loss for financial periods ending 2014-2016
(Source: Telstra.com.au, 2018)
According to the above figure, it could be observed that the net income of Telstra
Corporation has decreased from $4,345 million in 2014 to $4,305 million in 2015; however, it
has increased to $5,849 million in 2016. In other words, the net income of the organisation has
declined by 0.92% in 2015; however, it has increased by 35.87% in 2016 (Refer to Appendices,
Appendix 4). The possible reasons identified behind such increase in net income are the fall in
labour costs, purchase of other goods and services and rise in other expenditures. Hence, the goal
of the organisation in maximising profit is achieved in 2016.
Income, expenses and operating profit:
5ACCOUNTING AND FINANCE FOR MANAGERS
Total income Total
expenses Operating
profit
-8.00%
-6.00%
-4.00%
-2.00%
0.00%
2.00%
4.00%
6.00%
Income, Expenses and Operating
Profit Comparison
Percent change in 2014-15
Percent change in 2015-16
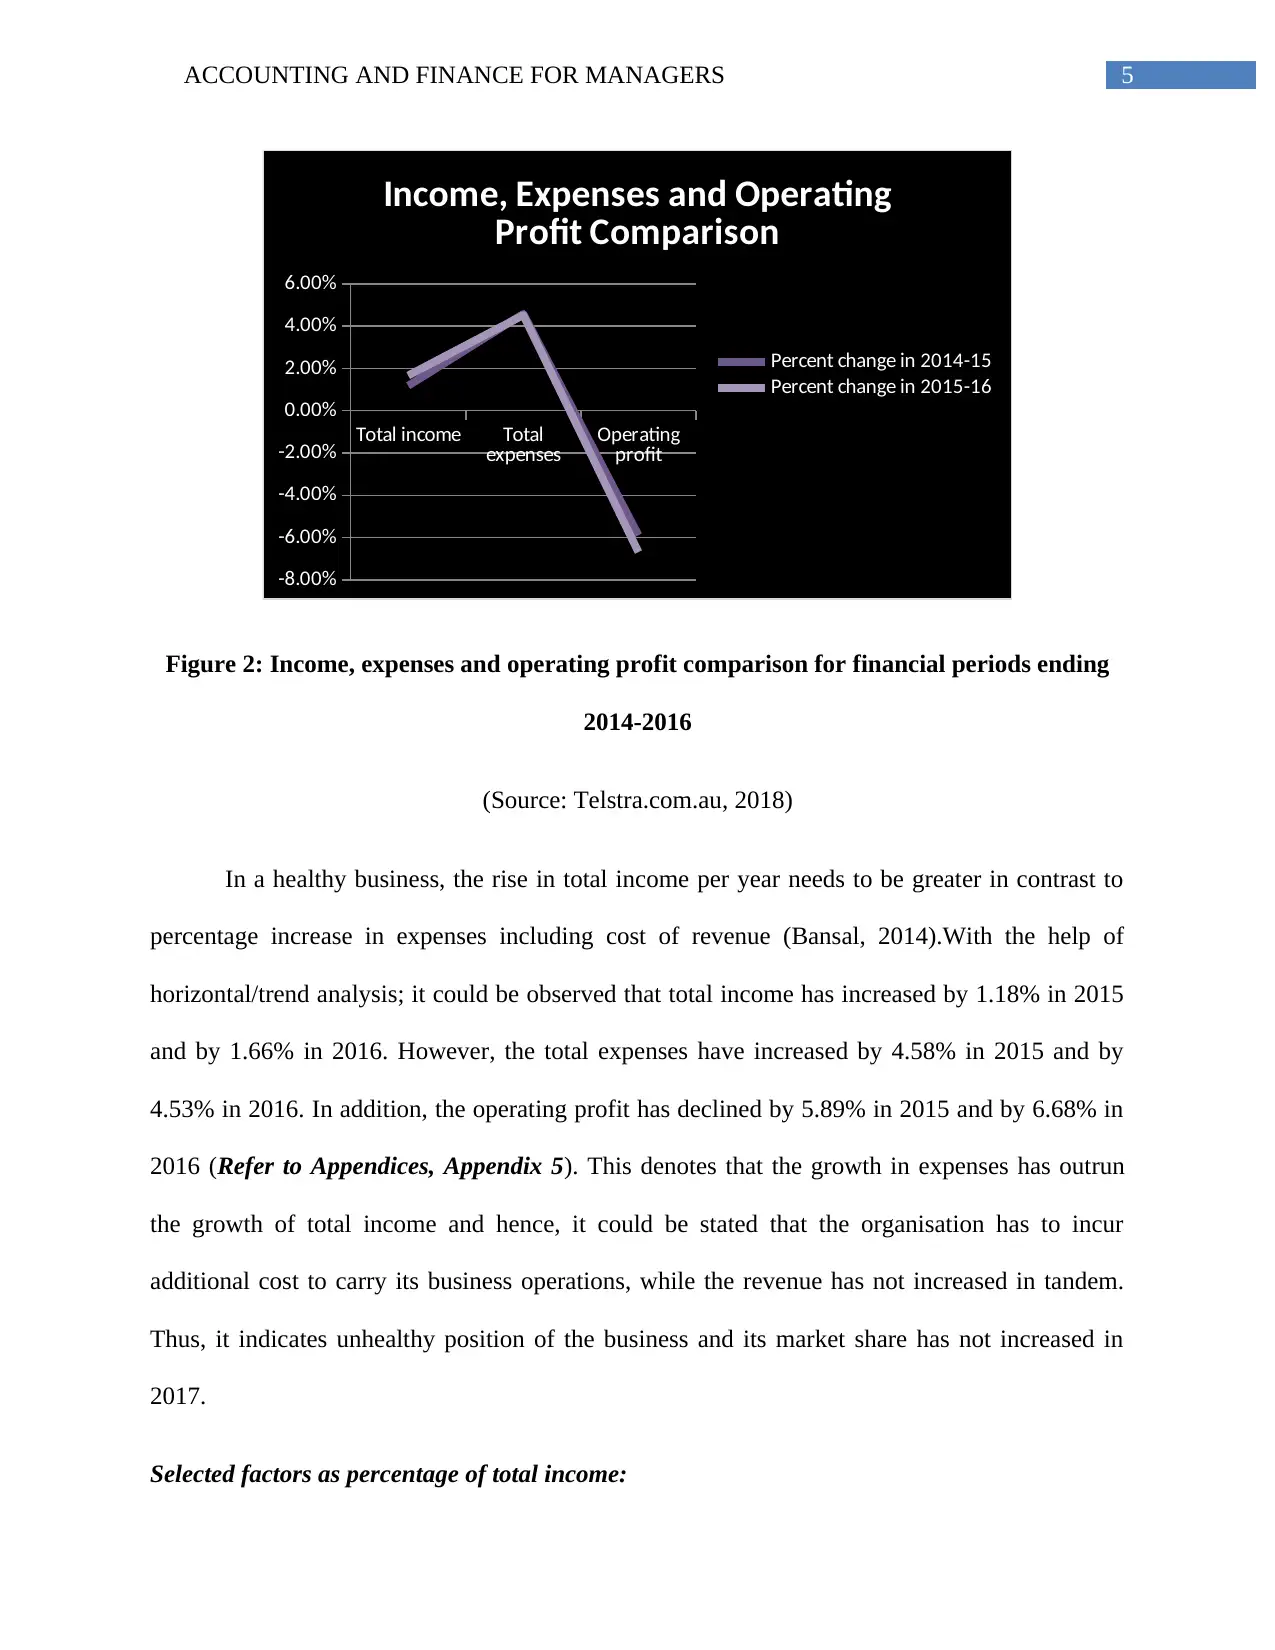
Figure 2: Income, expenses and operating profit comparison for financial periods ending
2014-2016
(Source: Telstra.com.au, 2018)
In a healthy business, the rise in total income per year needs to be greater in contrast to
percentage increase in expenses including cost of revenue (Bansal, 2014).With the help of
horizontal/trend analysis; it could be observed that total income has increased by 1.18% in 2015
and by 1.66% in 2016. However, the total expenses have increased by 4.58% in 2015 and by
4.53% in 2016. In addition, the operating profit has declined by 5.89% in 2015 and by 6.68% in
2016 (Refer to Appendices, Appendix 5). This denotes that the growth in expenses has outrun
the growth of total income and hence, it could be stated that the organisation has to incur
additional cost to carry its business operations, while the revenue has not increased in tandem.
Thus, it indicates unhealthy position of the business and its market share has not increased in
2017.
Selected factors as percentage of total income:
Total income Total
expenses Operating
profit
-8.00%
-6.00%
-4.00%
-2.00%
0.00%
2.00%
4.00%
6.00%
Income, Expenses and Operating
Profit Comparison
Percent change in 2014-15
Percent change in 2015-16
Figure 2: Income, expenses and operating profit comparison for financial periods ending
2014-2016
(Source: Telstra.com.au, 2018)
In a healthy business, the rise in total income per year needs to be greater in contrast to
percentage increase in expenses including cost of revenue (Bansal, 2014).With the help of
horizontal/trend analysis; it could be observed that total income has increased by 1.18% in 2015
and by 1.66% in 2016. However, the total expenses have increased by 4.58% in 2015 and by
4.53% in 2016. In addition, the operating profit has declined by 5.89% in 2015 and by 6.68% in
2016 (Refer to Appendices, Appendix 5). This denotes that the growth in expenses has outrun
the growth of total income and hence, it could be stated that the organisation has to incur
additional cost to carry its business operations, while the revenue has not increased in tandem.
Thus, it indicates unhealthy position of the business and its market share has not increased in
2017.
Selected factors as percentage of total income:
⊘ This is a preview!⊘
Do you want full access?
Subscribe today to unlock all pages.
Trusted by 1+ million students worldwide
6ACCOUNTING AND FINANCE FOR MANAGERS
Labour Goods
and
services
purchased
Other
expenses Operating
profit Net profit
0.00%
5.00%
10.00%
15.00%
20.00%
25.00%
30.00%
Selected factors as percentage of
total income
Percent in 2014
Percent in 2015
Percent in 2016
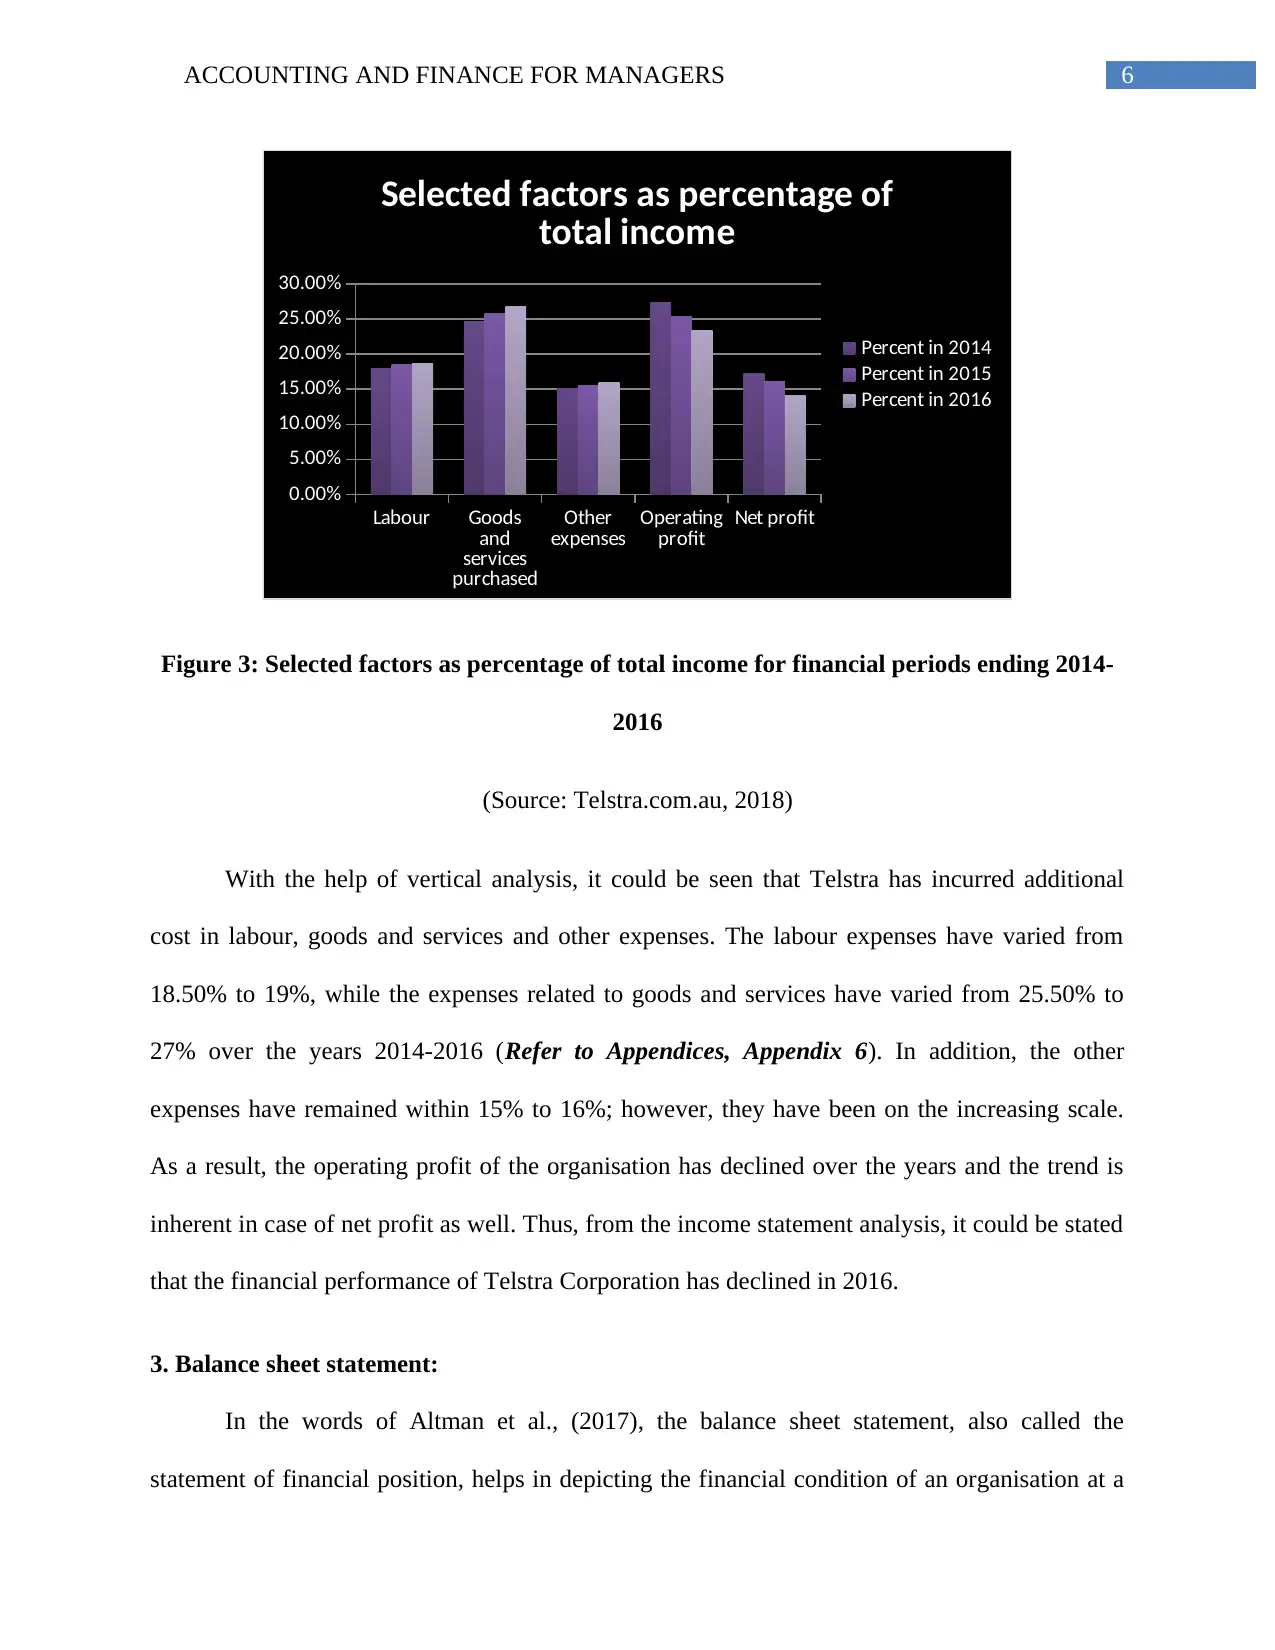
Figure 3: Selected factors as percentage of total income for financial periods ending 2014-
2016
(Source: Telstra.com.au, 2018)
With the help of vertical analysis, it could be seen that Telstra has incurred additional
cost in labour, goods and services and other expenses. The labour expenses have varied from
18.50% to 19%, while the expenses related to goods and services have varied from 25.50% to
27% over the years 2014-2016 (Refer to Appendices, Appendix 6). In addition, the other
expenses have remained within 15% to 16%; however, they have been on the increasing scale.
As a result, the operating profit of the organisation has declined over the years and the trend is
inherent in case of net profit as well. Thus, from the income statement analysis, it could be stated
that the financial performance of Telstra Corporation has declined in 2016.
3. Balance sheet statement:
In the words of Altman et al., (2017), the balance sheet statement, also called the
statement of financial position, helps in depicting the financial condition of an organisation at a
Labour Goods
and
services
purchased
Other
expenses Operating
profit Net profit
0.00%
5.00%
10.00%
15.00%
20.00%
25.00%
30.00%
Selected factors as percentage of
total income
Percent in 2014
Percent in 2015
Percent in 2016
Figure 3: Selected factors as percentage of total income for financial periods ending 2014-
2016
(Source: Telstra.com.au, 2018)
With the help of vertical analysis, it could be seen that Telstra has incurred additional
cost in labour, goods and services and other expenses. The labour expenses have varied from
18.50% to 19%, while the expenses related to goods and services have varied from 25.50% to
27% over the years 2014-2016 (Refer to Appendices, Appendix 6). In addition, the other
expenses have remained within 15% to 16%; however, they have been on the increasing scale.
As a result, the operating profit of the organisation has declined over the years and the trend is
inherent in case of net profit as well. Thus, from the income statement analysis, it could be stated
that the financial performance of Telstra Corporation has declined in 2016.
3. Balance sheet statement:
In the words of Altman et al., (2017), the balance sheet statement, also called the
statement of financial position, helps in depicting the financial condition of an organisation at a
Paraphrase This Document
Need a fresh take? Get an instant paraphrase of this document with our AI Paraphraser
7ACCOUNTING AND FINANCE FOR MANAGERS
particular point of time. It depicts all the resources that an organisation controls and its overall
obligations.
Percentage change in total assets, total liabilities and total equity:
Percent change
in 2014 Percent change
in 2015 Percent change
in 2016-2.00%
0.00%
2.00%
4.00%
6.00%
8.00%
10.00%
12.00%
Percentage change in total assets,
total liabilities and total equity
Total assets
Total liabilities
Total equity
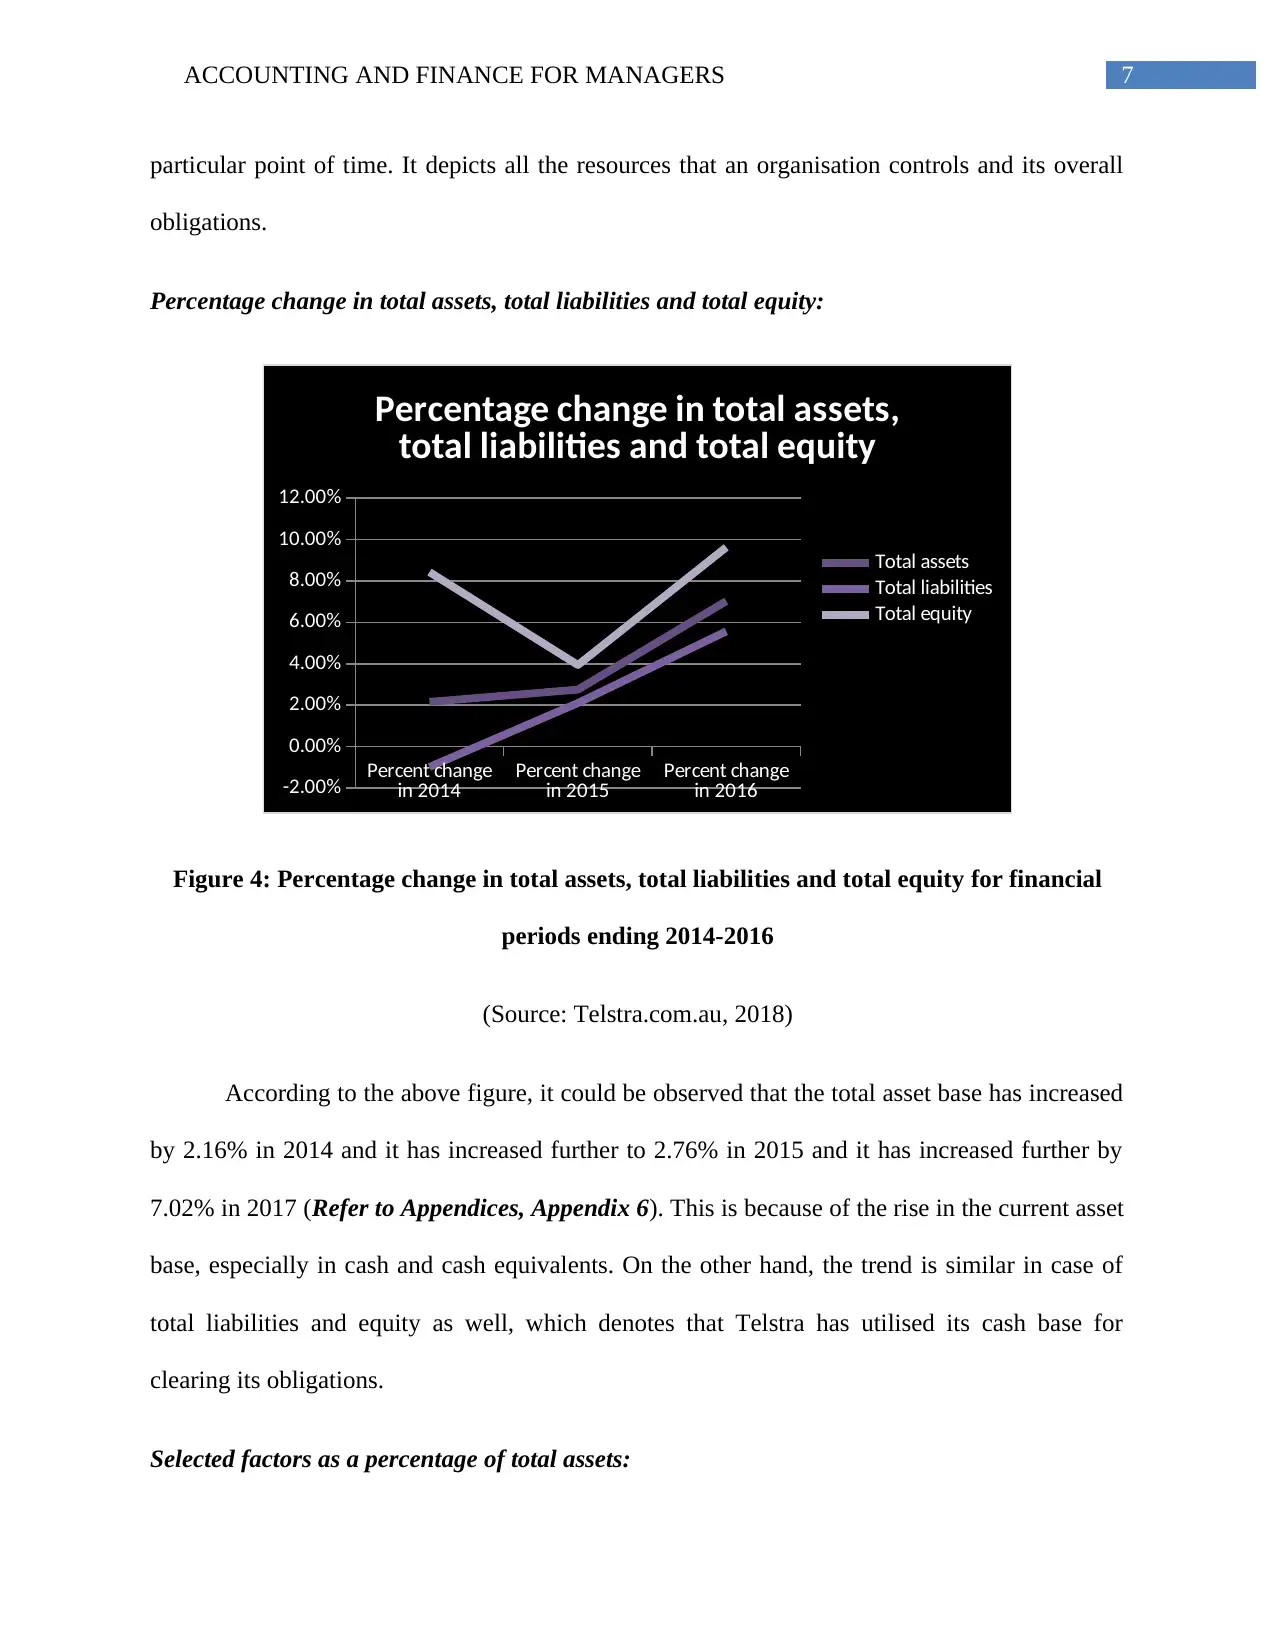
Figure 4: Percentage change in total assets, total liabilities and total equity for financial
periods ending 2014-2016
(Source: Telstra.com.au, 2018)
According to the above figure, it could be observed that the total asset base has increased
by 2.16% in 2014 and it has increased further to 2.76% in 2015 and it has increased further by
7.02% in 2017 (Refer to Appendices, Appendix 6). This is because of the rise in the current asset
base, especially in cash and cash equivalents. On the other hand, the trend is similar in case of
total liabilities and equity as well, which denotes that Telstra has utilised its cash base for
clearing its obligations.
Selected factors as a percentage of total assets:
particular point of time. It depicts all the resources that an organisation controls and its overall
obligations.
Percentage change in total assets, total liabilities and total equity:
Percent change
in 2014 Percent change
in 2015 Percent change
in 2016-2.00%
0.00%
2.00%
4.00%
6.00%
8.00%
10.00%
12.00%
Percentage change in total assets,
total liabilities and total equity
Total assets
Total liabilities
Total equity
Figure 4: Percentage change in total assets, total liabilities and total equity for financial
periods ending 2014-2016
(Source: Telstra.com.au, 2018)
According to the above figure, it could be observed that the total asset base has increased
by 2.16% in 2014 and it has increased further to 2.76% in 2015 and it has increased further by
7.02% in 2017 (Refer to Appendices, Appendix 6). This is because of the rise in the current asset
base, especially in cash and cash equivalents. On the other hand, the trend is similar in case of
total liabilities and equity as well, which denotes that Telstra has utilised its cash base for
clearing its obligations.
Selected factors as a percentage of total assets:
8ACCOUNTING AND FINANCE FOR MANAGERS
Cash and
cash
equivalents
Trade and
other
receivables
Inventories Property,
plant and
equipment
Intangible
assets
-100.00%
-50.00%
0.00%
50.00%
100.00%
150.00%
200.00%
Selected factors as percentage of
total assets
2014
2015
2016
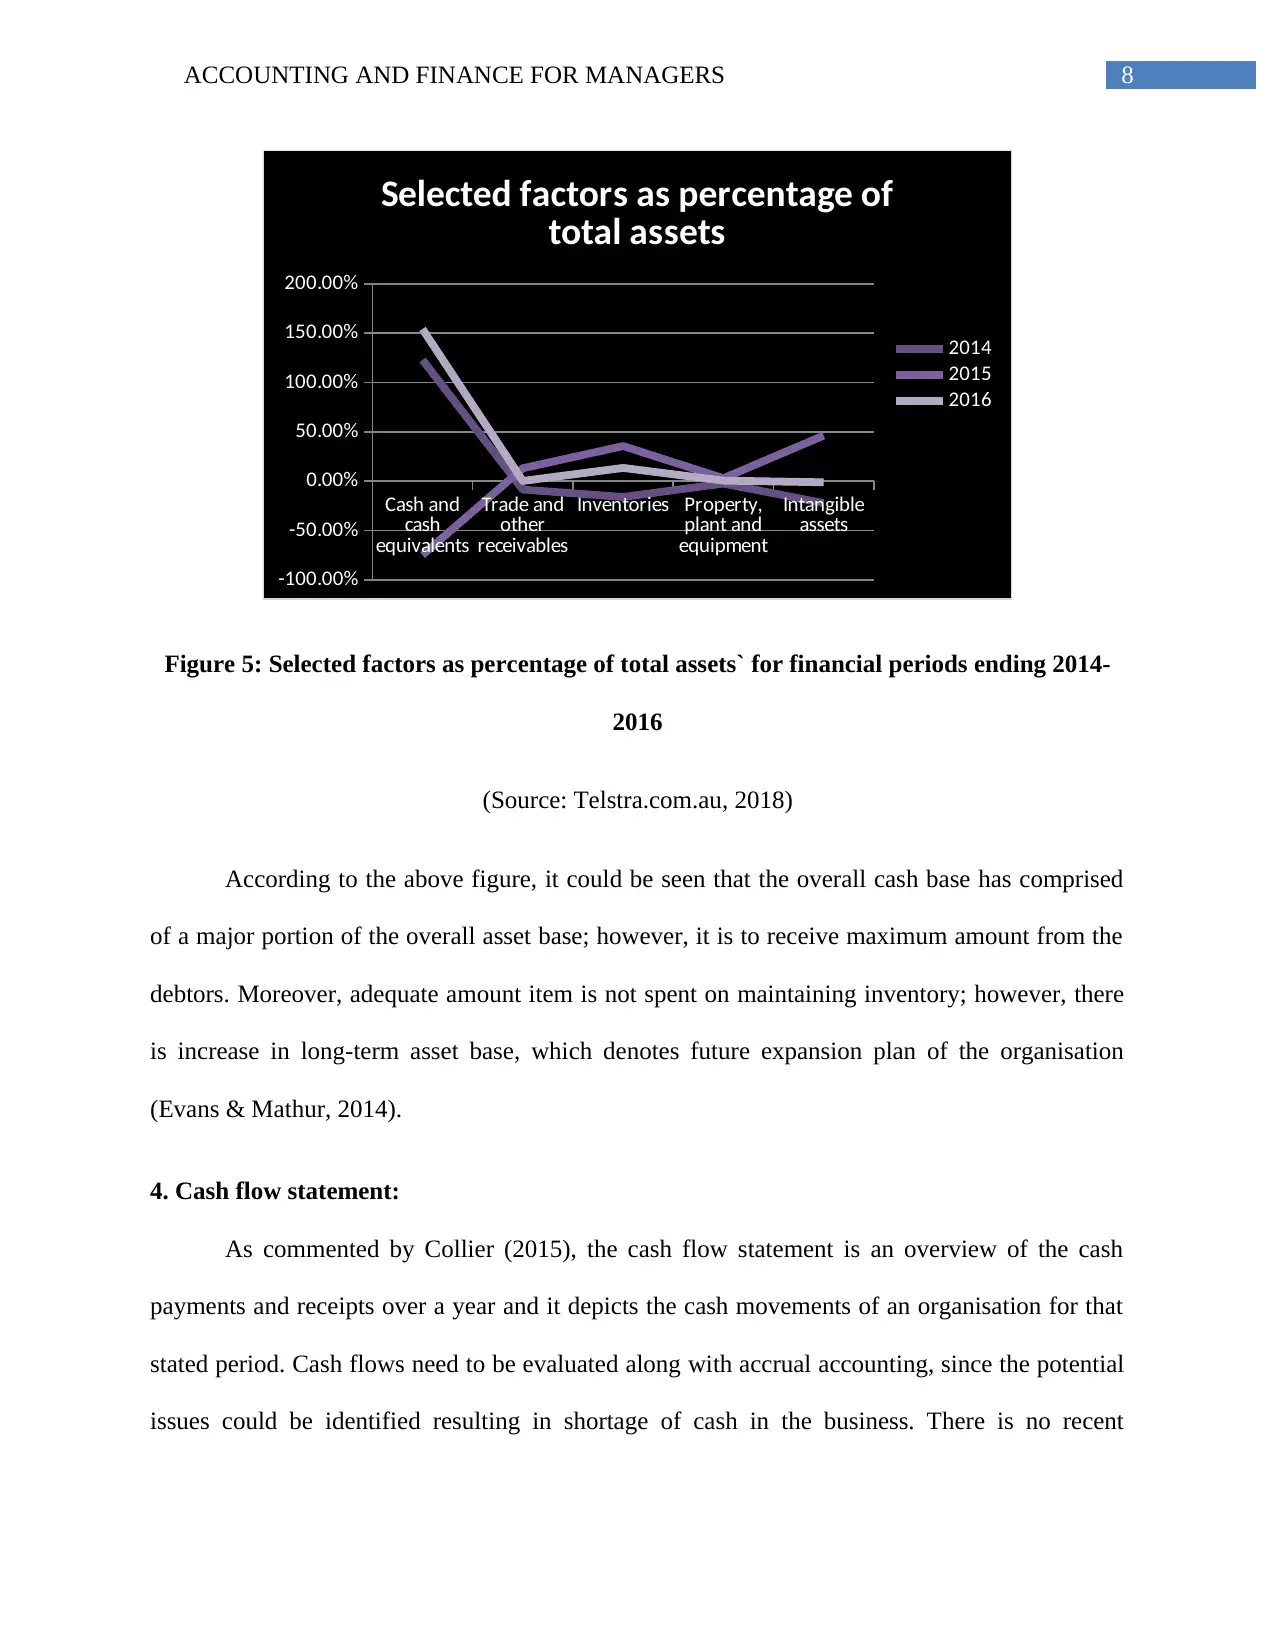
Figure 5: Selected factors as percentage of total assets` for financial periods ending 2014-
2016
(Source: Telstra.com.au, 2018)
According to the above figure, it could be seen that the overall cash base has comprised
of a major portion of the overall asset base; however, it is to receive maximum amount from the
debtors. Moreover, adequate amount item is not spent on maintaining inventory; however, there
is increase in long-term asset base, which denotes future expansion plan of the organisation
(Evans & Mathur, 2014).
4. Cash flow statement:
As commented by Collier (2015), the cash flow statement is an overview of the cash
payments and receipts over a year and it depicts the cash movements of an organisation for that
stated period. Cash flows need to be evaluated along with accrual accounting, since the potential
issues could be identified resulting in shortage of cash in the business. There is no recent
Cash and
cash
equivalents
Trade and
other
receivables
Inventories Property,
plant and
equipment
Intangible
assets
-100.00%
-50.00%
0.00%
50.00%
100.00%
150.00%
200.00%
Selected factors as percentage of
total assets
2014
2015
2016
Figure 5: Selected factors as percentage of total assets` for financial periods ending 2014-
2016
(Source: Telstra.com.au, 2018)
According to the above figure, it could be seen that the overall cash base has comprised
of a major portion of the overall asset base; however, it is to receive maximum amount from the
debtors. Moreover, adequate amount item is not spent on maintaining inventory; however, there
is increase in long-term asset base, which denotes future expansion plan of the organisation
(Evans & Mathur, 2014).
4. Cash flow statement:
As commented by Collier (2015), the cash flow statement is an overview of the cash
payments and receipts over a year and it depicts the cash movements of an organisation for that
stated period. Cash flows need to be evaluated along with accrual accounting, since the potential
issues could be identified resulting in shortage of cash in the business. There is no recent
⊘ This is a preview!⊘
Do you want full access?
Subscribe today to unlock all pages.
Trusted by 1+ million students worldwide
9ACCOUNTING AND FINANCE FOR MANAGERS
diversification on the part of Telstra Corporation due to the fall in inventory base and
prepayments.
Cash flows from operating activities:
It has been observed that the operating cash flows of the organisation have declined from
$10,387 million in 2014 to $10,066 million in 2015 and the decline is inherent further to $9,993
million in 2016 (Refer to Appendices, Appendix 8 and Appendix 9). This is because of the
additional payment made to the staffs and suppliers, which questions the ability of the
organisation in questioning its cash flow consistency.
Cash flows from investing activities:
It has been observed that the investing cash flows of the organisation have declined from
$1,130 million in 2014 to $5,692 million in 2015; however, the increase is significant to $2,207
million in 2016. This is because of the fall in payments associated with property, plant and
equipment and less proceeds.
Cash flows from financing activities:
It has been identified that the investing cash flows of the organisation have increased
from $4,430 million in 2014 to $6,882 million in 2015; however, there is decline in the same to
$3,777 million in 2016. The reasons identified behind such trend include the lower buyback of
shares and lower repayment of borrowings (Gippel, Smith & Zhu, 2015).
Due to these reasons, there has been fall in closing cash balance at the end of 2016, which
depicts that Telstra Corporation is suffering from cash flow problems.
Paraphrase This Document
Need a fresh take? Get an instant paraphrase of this document with our AI Paraphraser
10ACCOUNTING AND FINANCE FOR MANAGERS
5. Financial ratio analysis:
5.1 Profitability ratios:
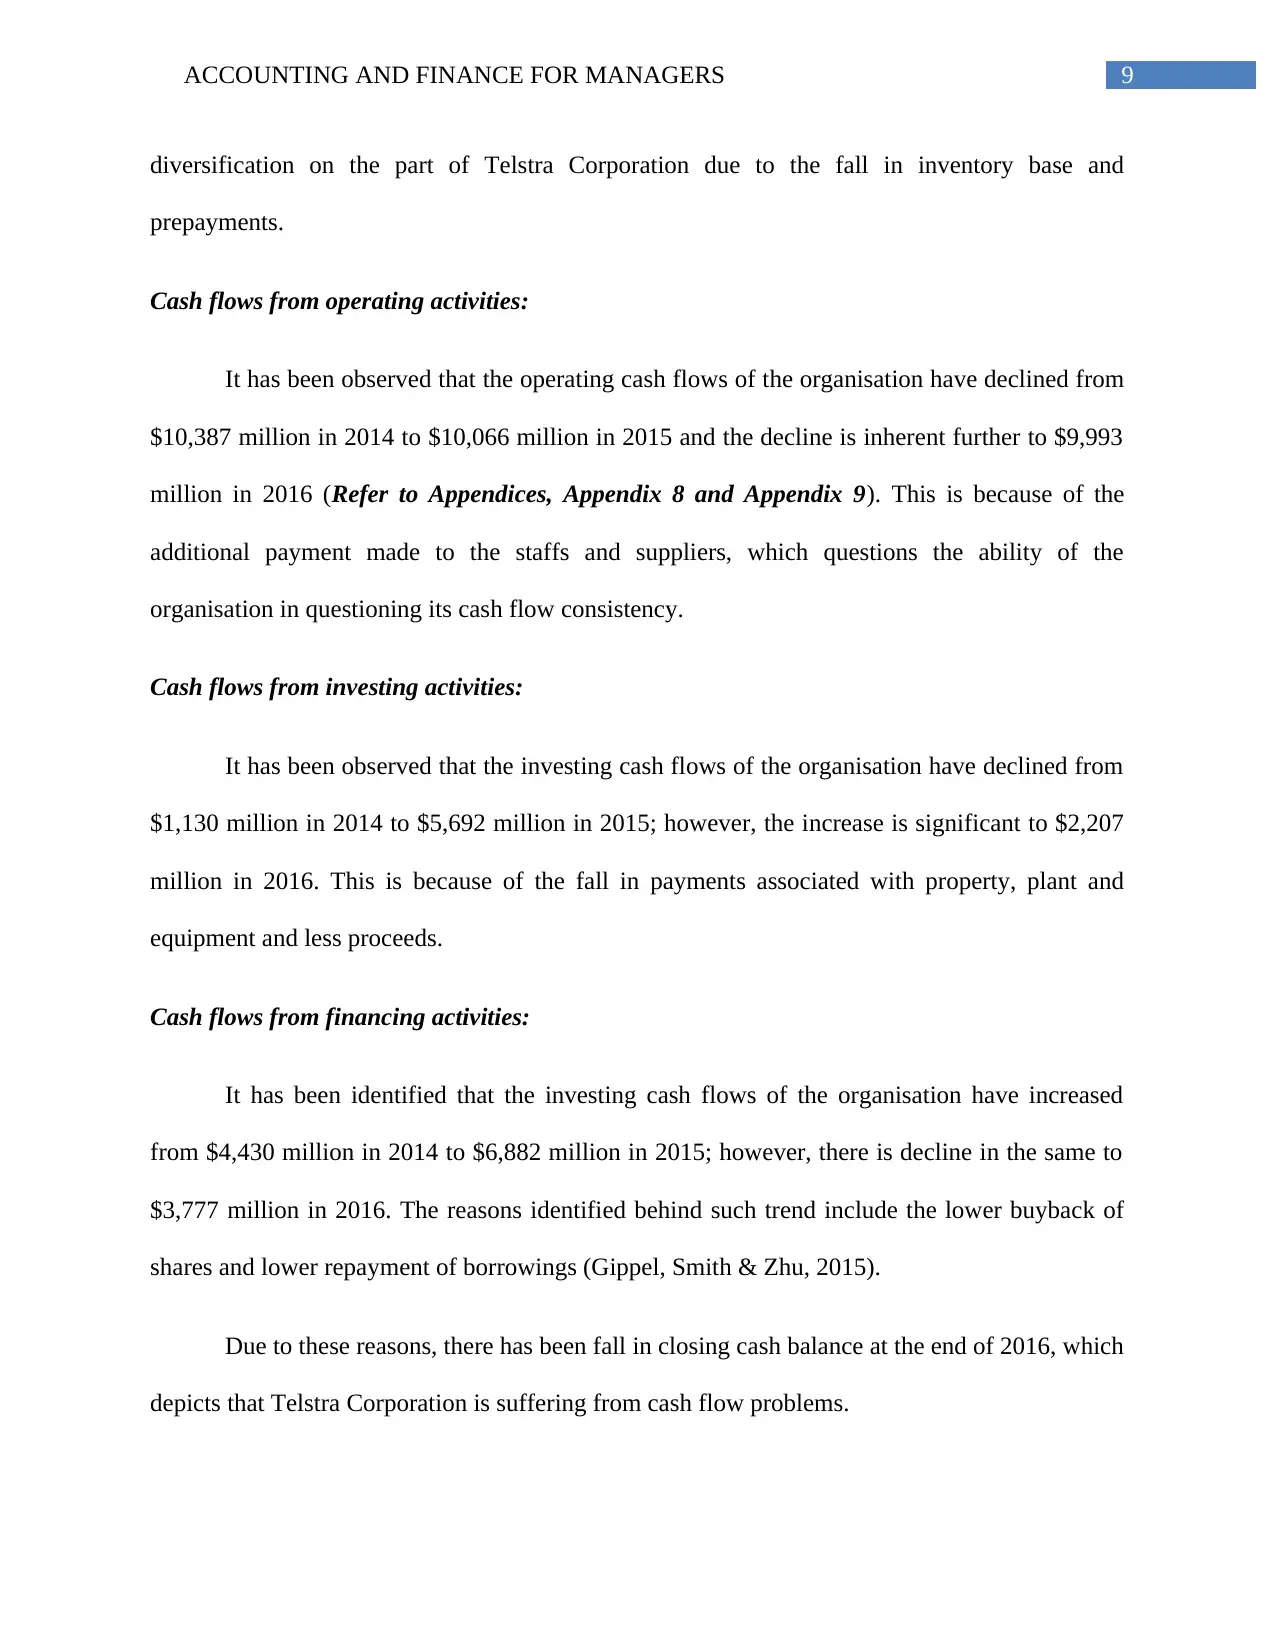
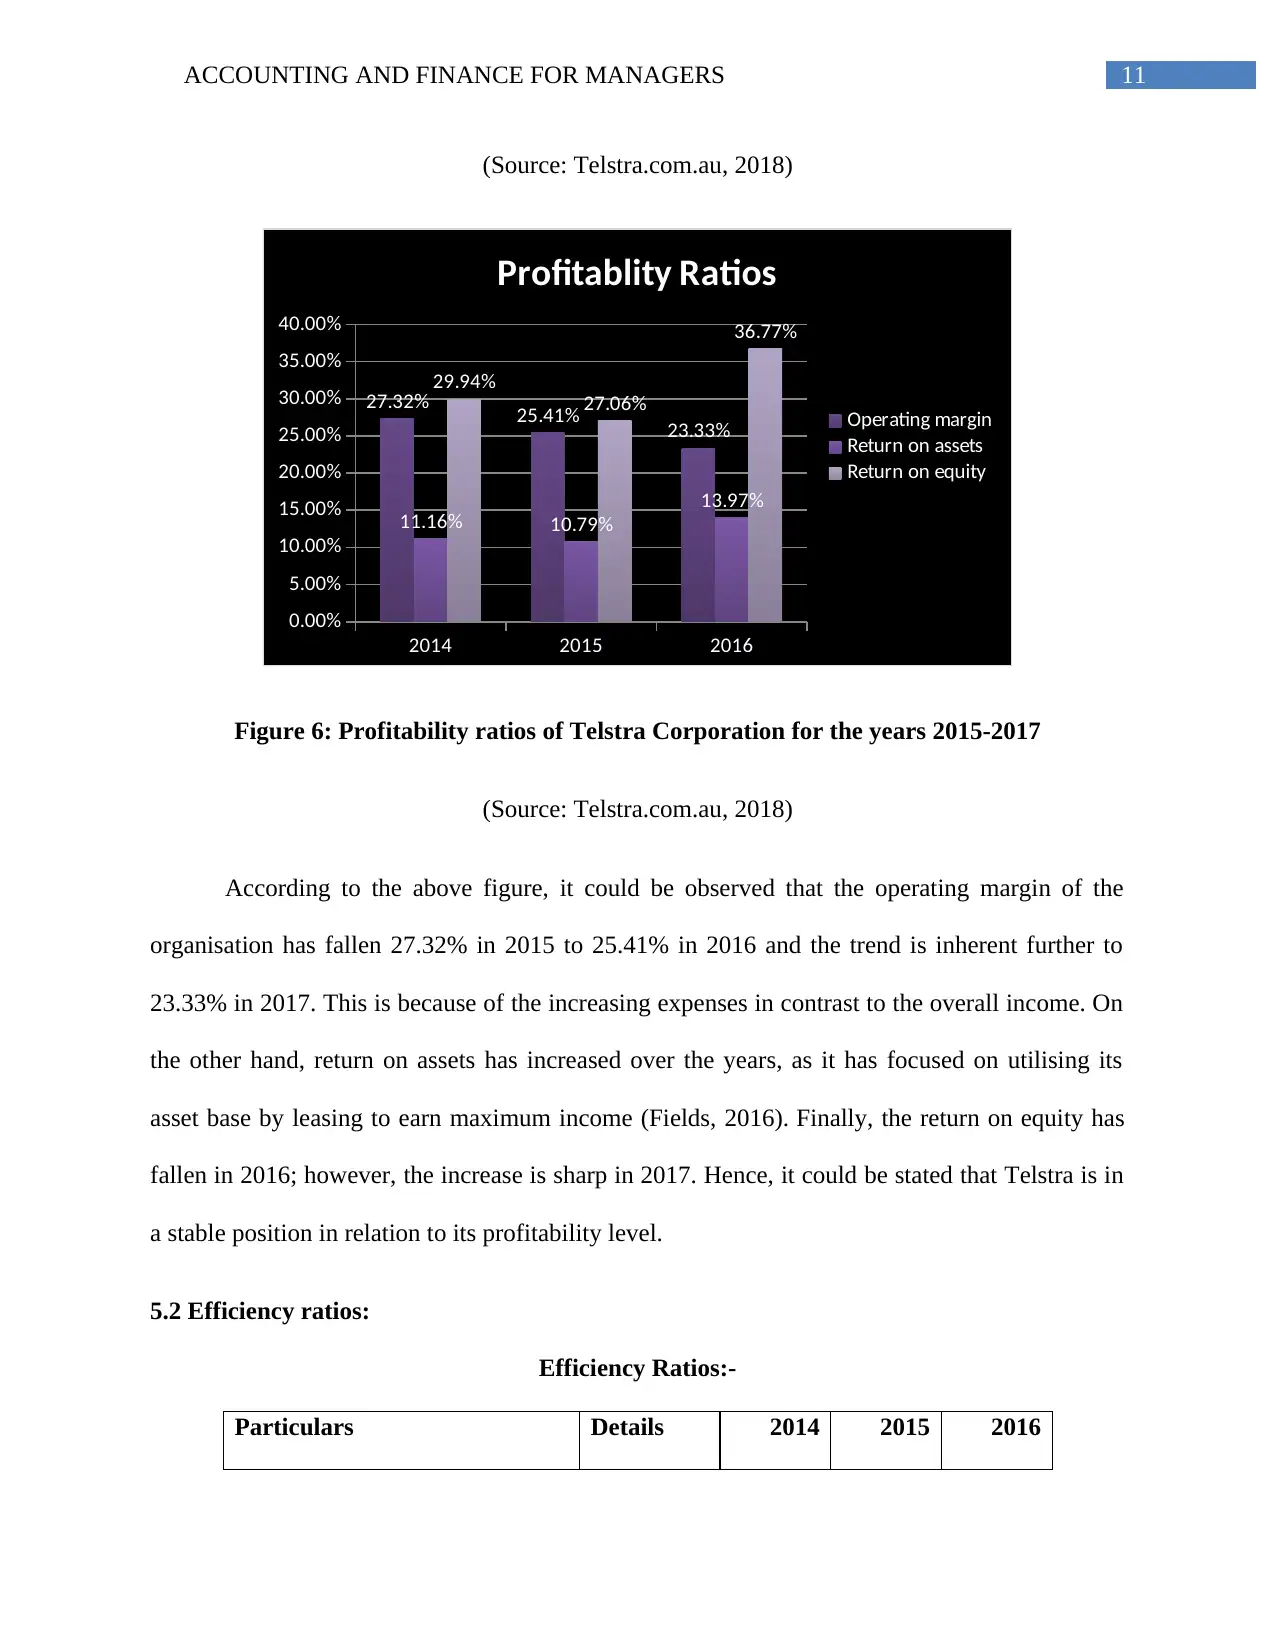
Particulars Details 2014 2015 2016
Revenue A
26,29
6
26,60
7
27,05
0
Operating profit B
7,18
5
6,76
2
6,31
0
Net profit C
4,34
5
4,30
5
5,84
9
Opening total assets D
38,52
7
39,36
0
40,44
5
Closing total assets E
39,36
0
40,44
5
43,28
6
Average total assets
F=(D+E)/
2
38,94
4
39,90
3
41,86
6
Shareholders' equity G
14,51
0
15,90
7
15,90
7
Operating margin B/A 27.32% 25.41% 23.33%
Return on assets C/F 11.16% 10.79% 13.97%
Return on equity C/G 29.94% 27.06% 36.77%
Table 1: Profitability ratios of Telstra Corporation for the years 2014-2016
5. Financial ratio analysis:
5.1 Profitability ratios:
Particulars Details 2014 2015 2016
Revenue A
26,29
6
26,60
7
27,05
0
Operating profit B
7,18
5
6,76
2
6,31
0
Net profit C
4,34
5
4,30
5
5,84
9
Opening total assets D
38,52
7
39,36
0
40,44
5
Closing total assets E
39,36
0
40,44
5
43,28
6
Average total assets
F=(D+E)/
2
38,94
4
39,90
3
41,86
6
Shareholders' equity G
14,51
0
15,90
7
15,90
7
Operating margin B/A 27.32% 25.41% 23.33%
Return on assets C/F 11.16% 10.79% 13.97%
Return on equity C/G 29.94% 27.06% 36.77%
Table 1: Profitability ratios of Telstra Corporation for the years 2014-2016
11ACCOUNTING AND FINANCE FOR MANAGERS
(Source: Telstra.com.au, 2018)
2014 2015 2016
0.00%
5.00%
10.00%
15.00%
20.00%
25.00%
30.00%
35.00%
40.00%
27.32% 25.41% 23.33%
11.16% 10.79%
13.97%
29.94%
27.06%
36.77%
Profitablity Ratios
Operating margin
Return on assets
Return on equity
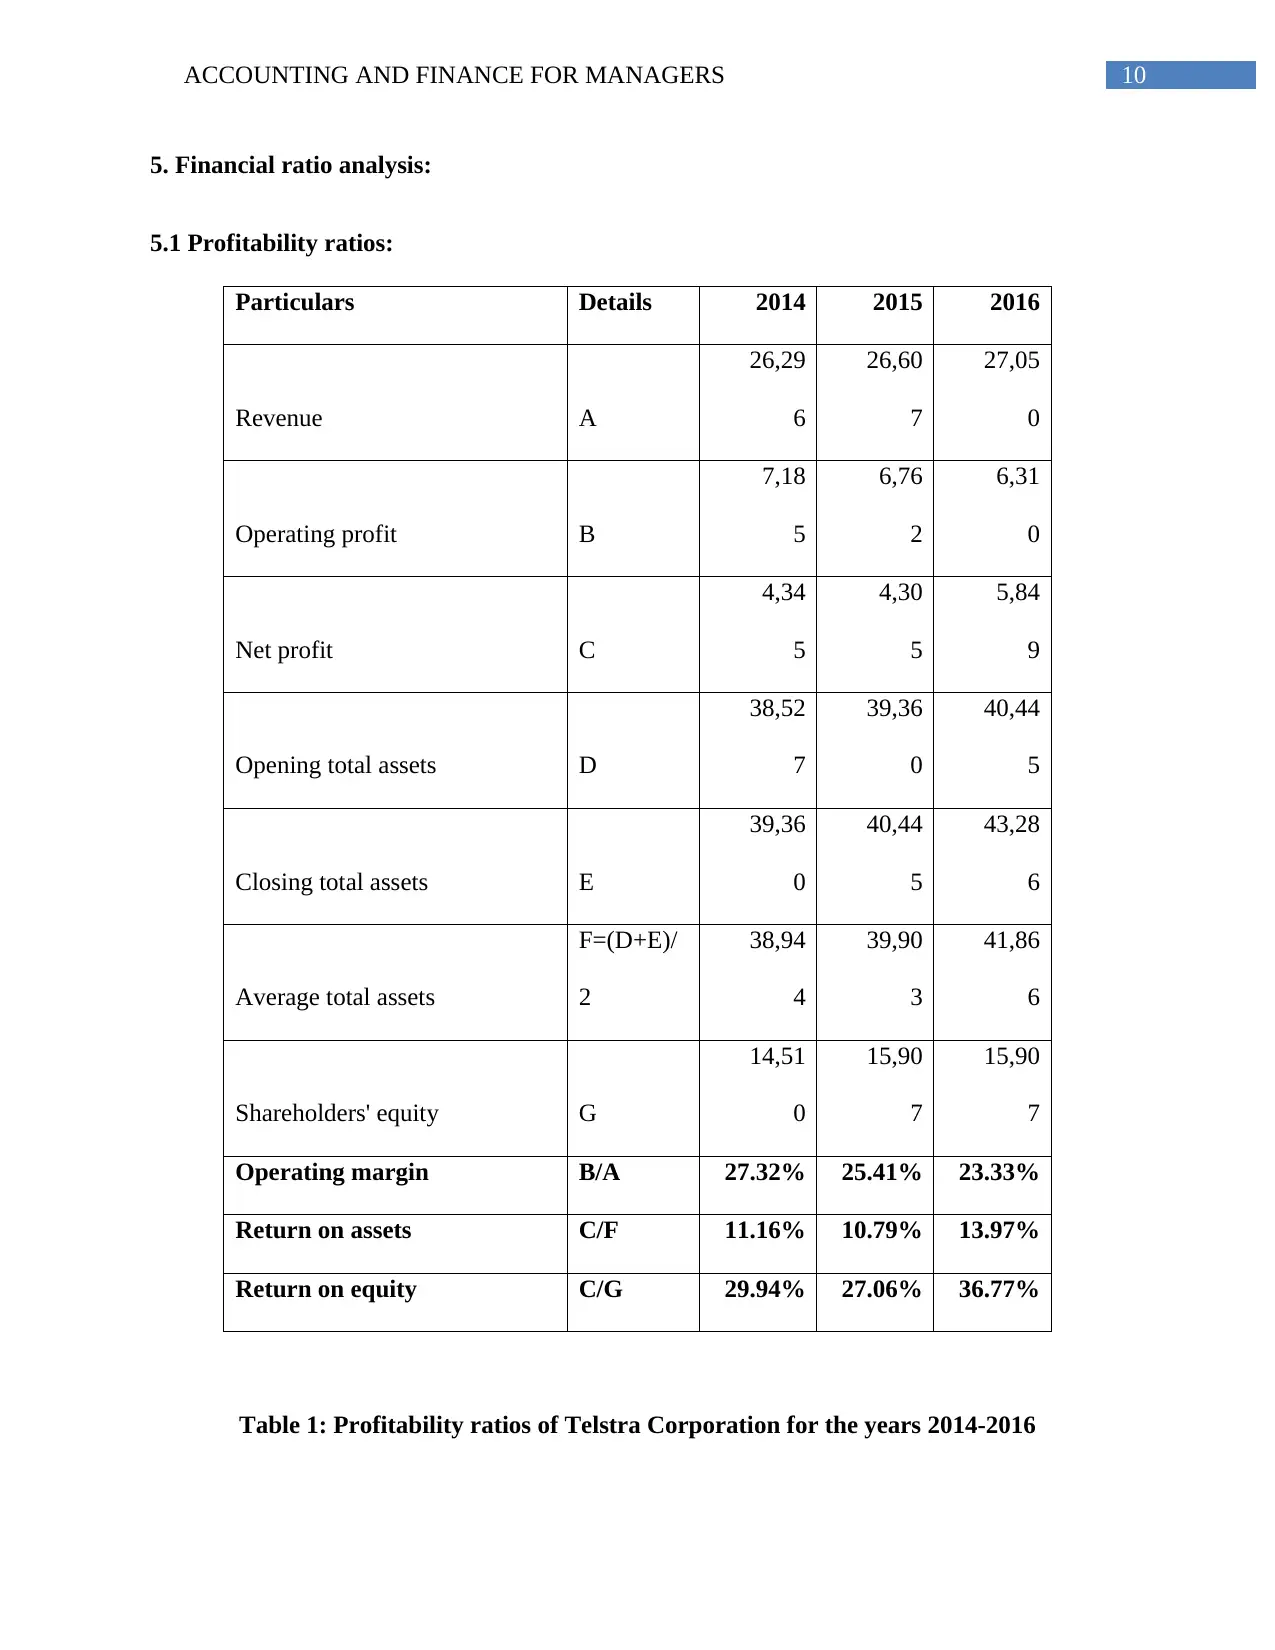
Figure 6: Profitability ratios of Telstra Corporation for the years 2015-2017
(Source: Telstra.com.au, 2018)
According to the above figure, it could be observed that the operating margin of the
organisation has fallen 27.32% in 2015 to 25.41% in 2016 and the trend is inherent further to
23.33% in 2017. This is because of the increasing expenses in contrast to the overall income. On
the other hand, return on assets has increased over the years, as it has focused on utilising its
asset base by leasing to earn maximum income (Fields, 2016). Finally, the return on equity has
fallen in 2016; however, the increase is sharp in 2017. Hence, it could be stated that Telstra is in
a stable position in relation to its profitability level.
5.2 Efficiency ratios:
Efficiency Ratios:-
Particulars Details 2014 2015 2016
(Source: Telstra.com.au, 2018)
2014 2015 2016
0.00%
5.00%
10.00%
15.00%
20.00%
25.00%
30.00%
35.00%
40.00%
27.32% 25.41% 23.33%
11.16% 10.79%
13.97%
29.94%
27.06%
36.77%
Profitablity Ratios
Operating margin
Return on assets
Return on equity
Figure 6: Profitability ratios of Telstra Corporation for the years 2015-2017
(Source: Telstra.com.au, 2018)
According to the above figure, it could be observed that the operating margin of the
organisation has fallen 27.32% in 2015 to 25.41% in 2016 and the trend is inherent further to
23.33% in 2017. This is because of the increasing expenses in contrast to the overall income. On
the other hand, return on assets has increased over the years, as it has focused on utilising its
asset base by leasing to earn maximum income (Fields, 2016). Finally, the return on equity has
fallen in 2016; however, the increase is sharp in 2017. Hence, it could be stated that Telstra is in
a stable position in relation to its profitability level.
5.2 Efficiency ratios:
Efficiency Ratios:-
Particulars Details 2014 2015 2016
⊘ This is a preview!⊘
Do you want full access?
Subscribe today to unlock all pages.
Trusted by 1+ million students worldwide
1 out of 34
Related Documents


Your All-in-One AI-Powered Toolkit for Academic Success.
+13062052269
info@desklib.com
Available 24*7 on WhatsApp / Email
![[object Object]](/_next/static/media/star-bottom.7253800d.svg)
Unlock your academic potential
Copyright © 2020–2026 A2Z Services. All Rights Reserved. Developed and managed by ZUCOL.