Telstra Corporation's Financial Performance: A Comprehensive Analysis
VerifiedAdded on 2021/05/30
|17
|4256
|179
Report
AI Summary
This report provides a comprehensive financial analysis of Telstra Corporation Limited, examining its performance using various parameters derived from its annual reports. It includes a detailed overview of the company's business, ownership structure, and financial results, including profit and loss accounts, balance sheets, and cash flow statements. The report delves into fundamental ratio analysis, market value ratios, and price movements, comparing Telstra's performance with the All Ordinaries Index. It also explores significant announcements impacting the company's share prices, calculates beta and the required rate of return using the CAPM, determines the weighted average cost of capital, and assesses the company's debt ratios and dividend policy. Finally, the report concludes with a letter of recommendation to a client, advocating for Telstra's inclusion in their investment portfolio.
FINANCE FOR
BUSINESS
ASSIGNMENT
BUSINESS
ASSIGNMENT
Paraphrase This Document
Need a fresh take? Get an instant paraphrase of this document with our AI Paraphraser
1
By student name
Professor
University
Date: 25 April 2018.
1 | P a g e
By student name
Professor
University
Date: 25 April 2018.
1 | P a g e
2
Executive Summary
A report has been prepared to analyse the financial performance of the selected company using
various parameters. An in depth analysis has been done using the last annual report of the
company including the profit and loss account, the balance sheet and the cash flow statement.
The report includes a brief description of the company and its business, its financial results, the
ratio analysis, factors influencing the share price of the company, calculation of the beta and
required rate of return for the shareholders of the company. The debt ratios of the company has
also been computed over the to comment on the overall capital structure of the company and to
suggest a way forward. Finally, the dividend policy of the company has been discussed about
and a letter of recommendation has been written to the client as to why the company should form
a part of his investment portfolio.
2 | P a g e
⊘ This is a preview!⊘
Do you want full access?
Subscribe today to unlock all pages.
Trusted by 1+ million students worldwide
3
Contents
Introduction – Description of the company.................................................................................................4
Ownership-governance structure................................................................................................................5
Fundamental Ratios.....................................................................................................................................6
Price Graph/Chart movements....................................................................................................................7
Significant Announcements with respect to company – Telstra Corp.........................................................8
Calculation of Beta and rate of return of the company using CAPM...........................................................9
Calculation of Weighted average cost of capital.......................................................................................10
Debt ratio of the company........................................................................................................................11
Dividend Policy..........................................................................................................................................12
Letter of recommendation to the client....................................................................................................13
References.................................................................................................................................................15
3 | P a g e
Paraphrase This Document
Need a fresh take? Get an instant paraphrase of this document with our AI Paraphraser
4
Introduction – Description of the company
The company which has been selected here is Telstra Corporation Limited which is one of the
pioneer companies in Australia. The company was formed in 1975 and has been a famous name
in Australia for its telecommunication and media services. It is in the business of building and
operating telecommunication towers and networks, mobile and broadband and internet services,
television and other entertainment related products and services (Bizfluent, 2017). It is the
largest telecommunication company in Australia and is listed on the Australian Stock exchange.
It originated from the Australia Post which was a government company but the same was
privatised later on. The company plans to venture into the international markets and grow
thereby and furthermore also increase customer eccentricity (Alexander, 2016). The company
currently employs more than 36000 employees and has an international presence with nearly 150
+ subsidiaries all over the world. The main aim of Telstra is to keep the customer as the forefront
and the service provided to be the fundamental objective of doing the business and therefore, the
percentage of customer complaints has gone down by more than 50% in last 5-6 years. Also, the
company has kept the digitization as one of its major objectives, which is evident from the
increase in digital transactions over the last 5 years as the % has increased from 26% to over
60% (Belton, 2017).
4 | P a g e
5
Ownership-governance structure
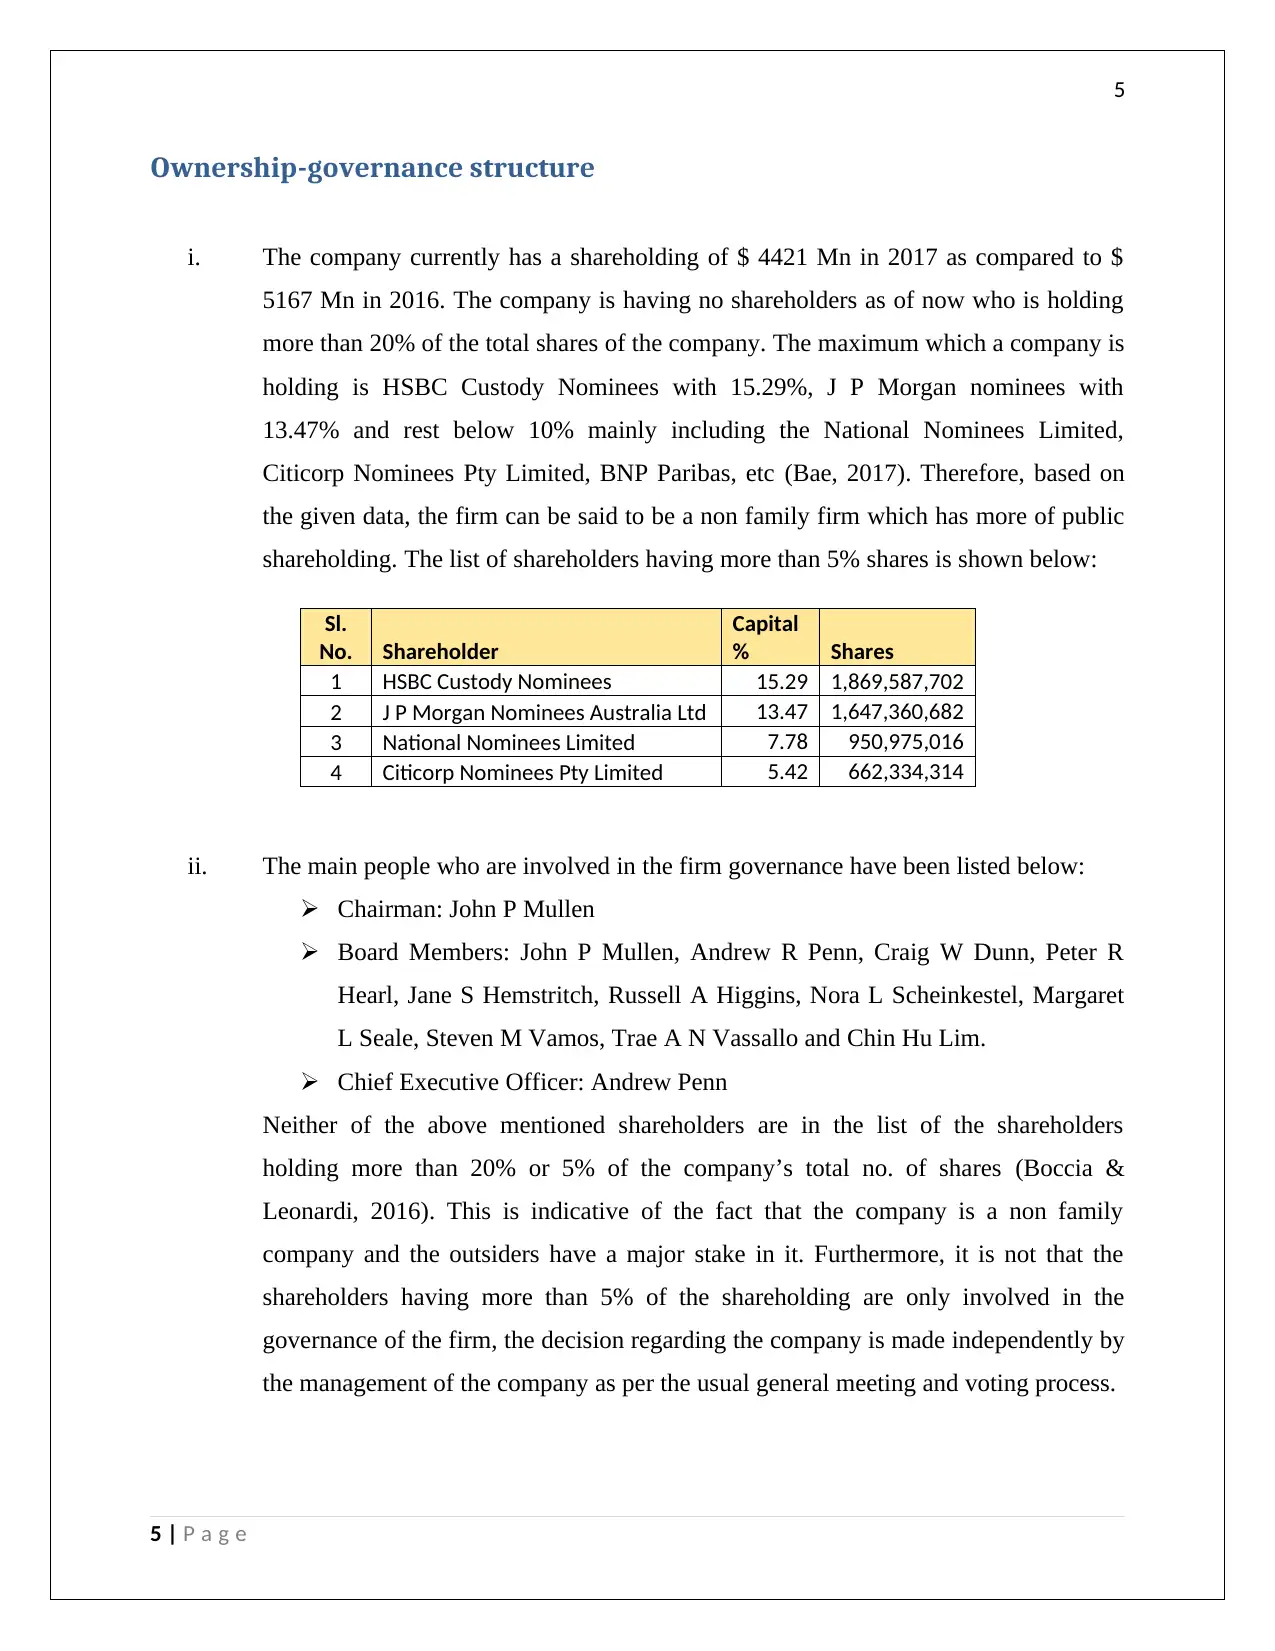
i. The company currently has a shareholding of $ 4421 Mn in 2017 as compared to $
5167 Mn in 2016. The company is having no shareholders as of now who is holding
more than 20% of the total shares of the company. The maximum which a company is
holding is HSBC Custody Nominees with 15.29%, J P Morgan nominees with
13.47% and rest below 10% mainly including the National Nominees Limited,
Citicorp Nominees Pty Limited, BNP Paribas, etc (Bae, 2017). Therefore, based on
the given data, the firm can be said to be a non family firm which has more of public
shareholding. The list of shareholders having more than 5% shares is shown below:
Sl.
No. Shareholder
Capital
% Shares
1 HSBC Custody Nominees 15.29 1,869,587,702
2 J P Morgan Nominees Australia Ltd 13.47 1,647,360,682
3 National Nominees Limited 7.78 950,975,016
4 Citicorp Nominees Pty Limited 5.42 662,334,314
ii. The main people who are involved in the firm governance have been listed below:
Chairman: John P Mullen
Board Members: John P Mullen, Andrew R Penn, Craig W Dunn, Peter R
Hearl, Jane S Hemstritch, Russell A Higgins, Nora L Scheinkestel, Margaret
L Seale, Steven M Vamos, Trae A N Vassallo and Chin Hu Lim.
Chief Executive Officer: Andrew Penn
Neither of the above mentioned shareholders are in the list of the shareholders
holding more than 20% or 5% of the company’s total no. of shares (Boccia &
Leonardi, 2016). This is indicative of the fact that the company is a non family
company and the outsiders have a major stake in it. Furthermore, it is not that the
shareholders having more than 5% of the shareholding are only involved in the
governance of the firm, the decision regarding the company is made independently by
the management of the company as per the usual general meeting and voting process.
5 | P a g e
Ownership-governance structure
i. The company currently has a shareholding of $ 4421 Mn in 2017 as compared to $
5167 Mn in 2016. The company is having no shareholders as of now who is holding
more than 20% of the total shares of the company. The maximum which a company is
holding is HSBC Custody Nominees with 15.29%, J P Morgan nominees with
13.47% and rest below 10% mainly including the National Nominees Limited,
Citicorp Nominees Pty Limited, BNP Paribas, etc (Bae, 2017). Therefore, based on
the given data, the firm can be said to be a non family firm which has more of public
shareholding. The list of shareholders having more than 5% shares is shown below:
Sl.
No. Shareholder
Capital
% Shares
1 HSBC Custody Nominees 15.29 1,869,587,702
2 J P Morgan Nominees Australia Ltd 13.47 1,647,360,682
3 National Nominees Limited 7.78 950,975,016
4 Citicorp Nominees Pty Limited 5.42 662,334,314
ii. The main people who are involved in the firm governance have been listed below:
Chairman: John P Mullen
Board Members: John P Mullen, Andrew R Penn, Craig W Dunn, Peter R
Hearl, Jane S Hemstritch, Russell A Higgins, Nora L Scheinkestel, Margaret
L Seale, Steven M Vamos, Trae A N Vassallo and Chin Hu Lim.
Chief Executive Officer: Andrew Penn
Neither of the above mentioned shareholders are in the list of the shareholders
holding more than 20% or 5% of the company’s total no. of shares (Boccia &
Leonardi, 2016). This is indicative of the fact that the company is a non family
company and the outsiders have a major stake in it. Furthermore, it is not that the
shareholders having more than 5% of the shareholding are only involved in the
governance of the firm, the decision regarding the company is made independently by
the management of the company as per the usual general meeting and voting process.
5 | P a g e
⊘ This is a preview!⊘
Do you want full access?
Subscribe today to unlock all pages.
Trusted by 1+ million students worldwide
6
Fundamental Ratios
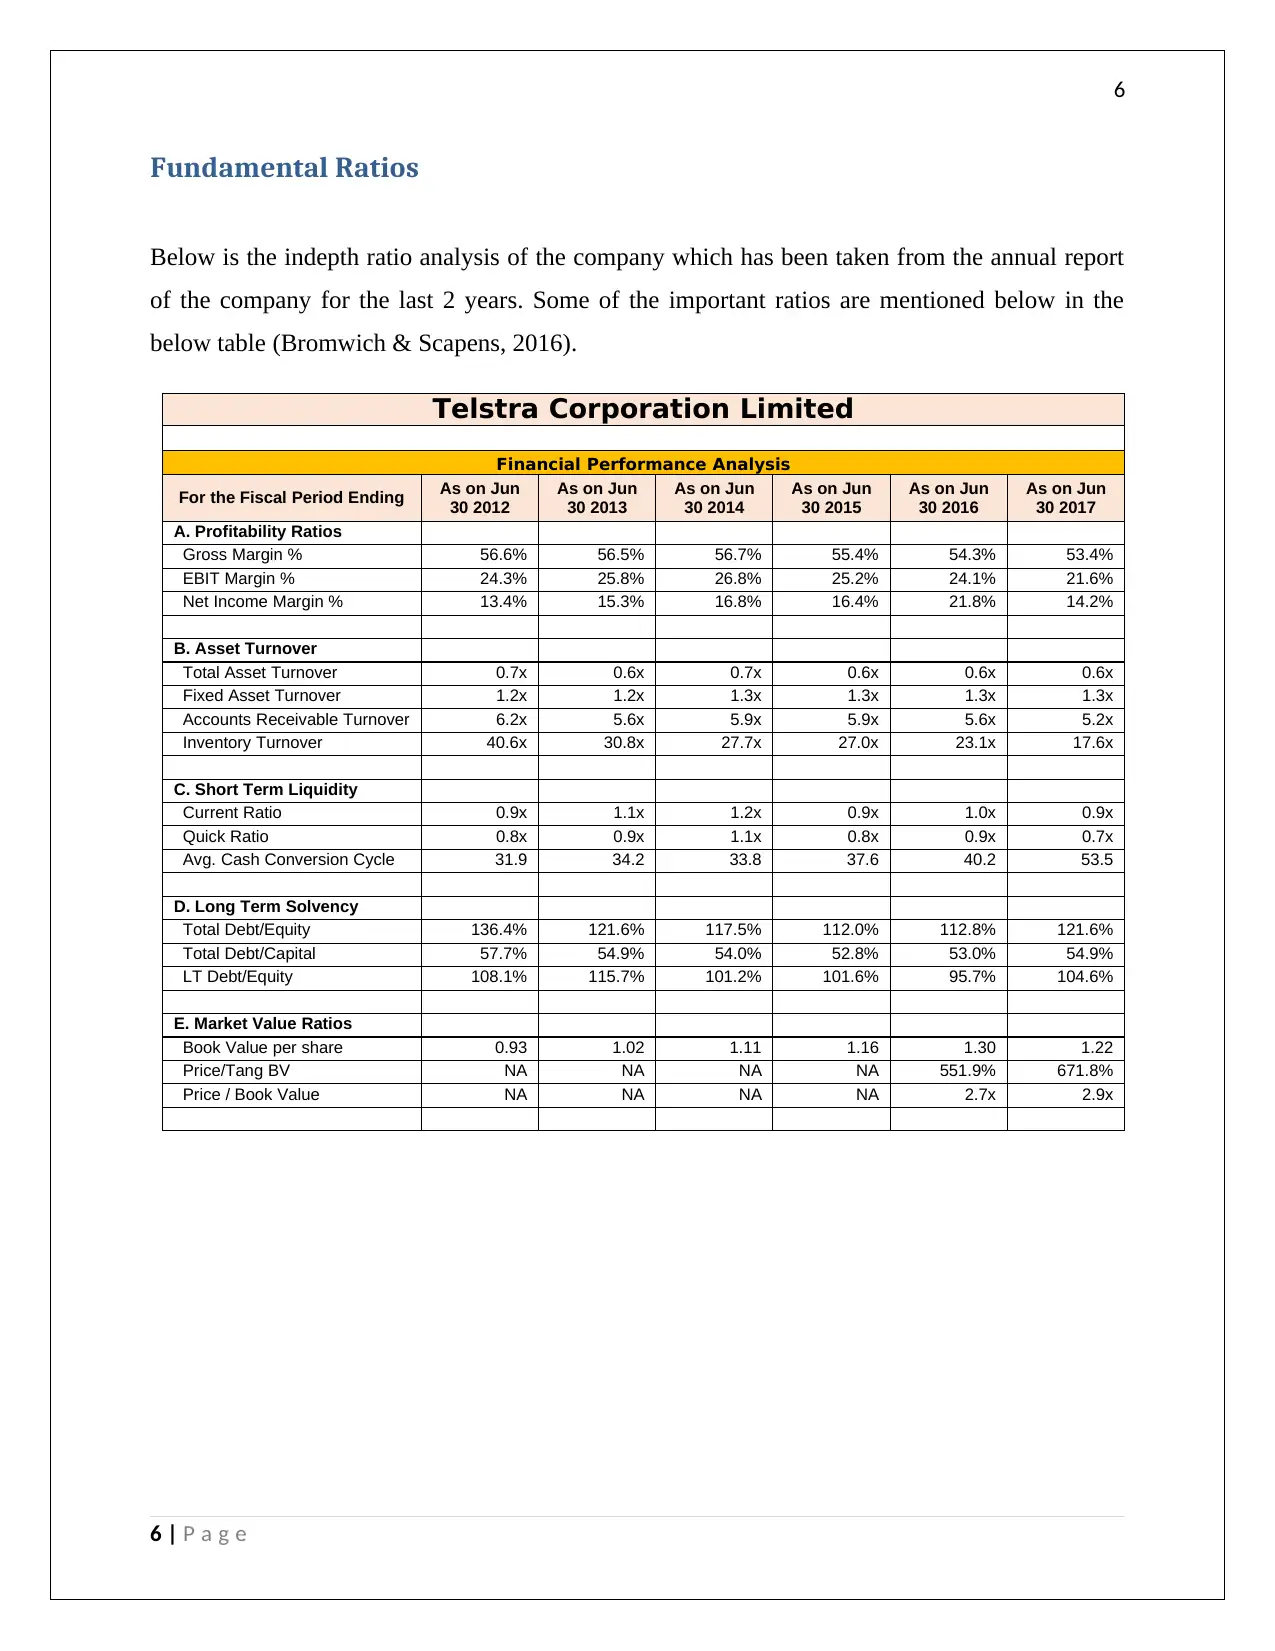
Below is the indepth ratio analysis of the company which has been taken from the annual report
of the company for the last 2 years. Some of the important ratios are mentioned below in the
below table (Bromwich & Scapens, 2016).
Telstra Corporation Limited
Financial Performance Analysis
For the Fiscal Period Ending As on Jun
30 2012
As on Jun
30 2013
As on Jun
30 2014
As on Jun
30 2015
As on Jun
30 2016
As on Jun
30 2017
A. Profitability Ratios
Gross Margin % 56.6% 56.5% 56.7% 55.4% 54.3% 53.4%
EBIT Margin % 24.3% 25.8% 26.8% 25.2% 24.1% 21.6%
Net Income Margin % 13.4% 15.3% 16.8% 16.4% 21.8% 14.2%
B. Asset Turnover
Total Asset Turnover 0.7x 0.6x 0.7x 0.6x 0.6x 0.6x
Fixed Asset Turnover 1.2x 1.2x 1.3x 1.3x 1.3x 1.3x
Accounts Receivable Turnover 6.2x 5.6x 5.9x 5.9x 5.6x 5.2x
Inventory Turnover 40.6x 30.8x 27.7x 27.0x 23.1x 17.6x
C. Short Term Liquidity
Current Ratio 0.9x 1.1x 1.2x 0.9x 1.0x 0.9x
Quick Ratio 0.8x 0.9x 1.1x 0.8x 0.9x 0.7x
Avg. Cash Conversion Cycle 31.9 34.2 33.8 37.6 40.2 53.5
D. Long Term Solvency
Total Debt/Equity 136.4% 121.6% 117.5% 112.0% 112.8% 121.6%
Total Debt/Capital 57.7% 54.9% 54.0% 52.8% 53.0% 54.9%
LT Debt/Equity 108.1% 115.7% 101.2% 101.6% 95.7% 104.6%
E. Market Value Ratios
Book Value per share 0.93 1.02 1.11 1.16 1.30 1.22
Price/Tang BV NA NA NA NA 551.9% 671.8%
Price / Book Value NA NA NA NA 2.7x 2.9x
6 | P a g e
Fundamental Ratios
Below is the indepth ratio analysis of the company which has been taken from the annual report
of the company for the last 2 years. Some of the important ratios are mentioned below in the
below table (Bromwich & Scapens, 2016).
Telstra Corporation Limited
Financial Performance Analysis
For the Fiscal Period Ending As on Jun
30 2012
As on Jun
30 2013
As on Jun
30 2014
As on Jun
30 2015
As on Jun
30 2016
As on Jun
30 2017
A. Profitability Ratios
Gross Margin % 56.6% 56.5% 56.7% 55.4% 54.3% 53.4%
EBIT Margin % 24.3% 25.8% 26.8% 25.2% 24.1% 21.6%
Net Income Margin % 13.4% 15.3% 16.8% 16.4% 21.8% 14.2%
B. Asset Turnover
Total Asset Turnover 0.7x 0.6x 0.7x 0.6x 0.6x 0.6x
Fixed Asset Turnover 1.2x 1.2x 1.3x 1.3x 1.3x 1.3x
Accounts Receivable Turnover 6.2x 5.6x 5.9x 5.9x 5.6x 5.2x
Inventory Turnover 40.6x 30.8x 27.7x 27.0x 23.1x 17.6x
C. Short Term Liquidity
Current Ratio 0.9x 1.1x 1.2x 0.9x 1.0x 0.9x
Quick Ratio 0.8x 0.9x 1.1x 0.8x 0.9x 0.7x
Avg. Cash Conversion Cycle 31.9 34.2 33.8 37.6 40.2 53.5
D. Long Term Solvency
Total Debt/Equity 136.4% 121.6% 117.5% 112.0% 112.8% 121.6%
Total Debt/Capital 57.7% 54.9% 54.0% 52.8% 53.0% 54.9%
LT Debt/Equity 108.1% 115.7% 101.2% 101.6% 95.7% 104.6%
E. Market Value Ratios
Book Value per share 0.93 1.02 1.11 1.16 1.30 1.22
Price/Tang BV NA NA NA NA 551.9% 671.8%
Price / Book Value NA NA NA NA 2.7x 2.9x
6 | P a g e
Paraphrase This Document
Need a fresh take? Get an instant paraphrase of this document with our AI Paraphraser
7
Price Graph/Chart movements
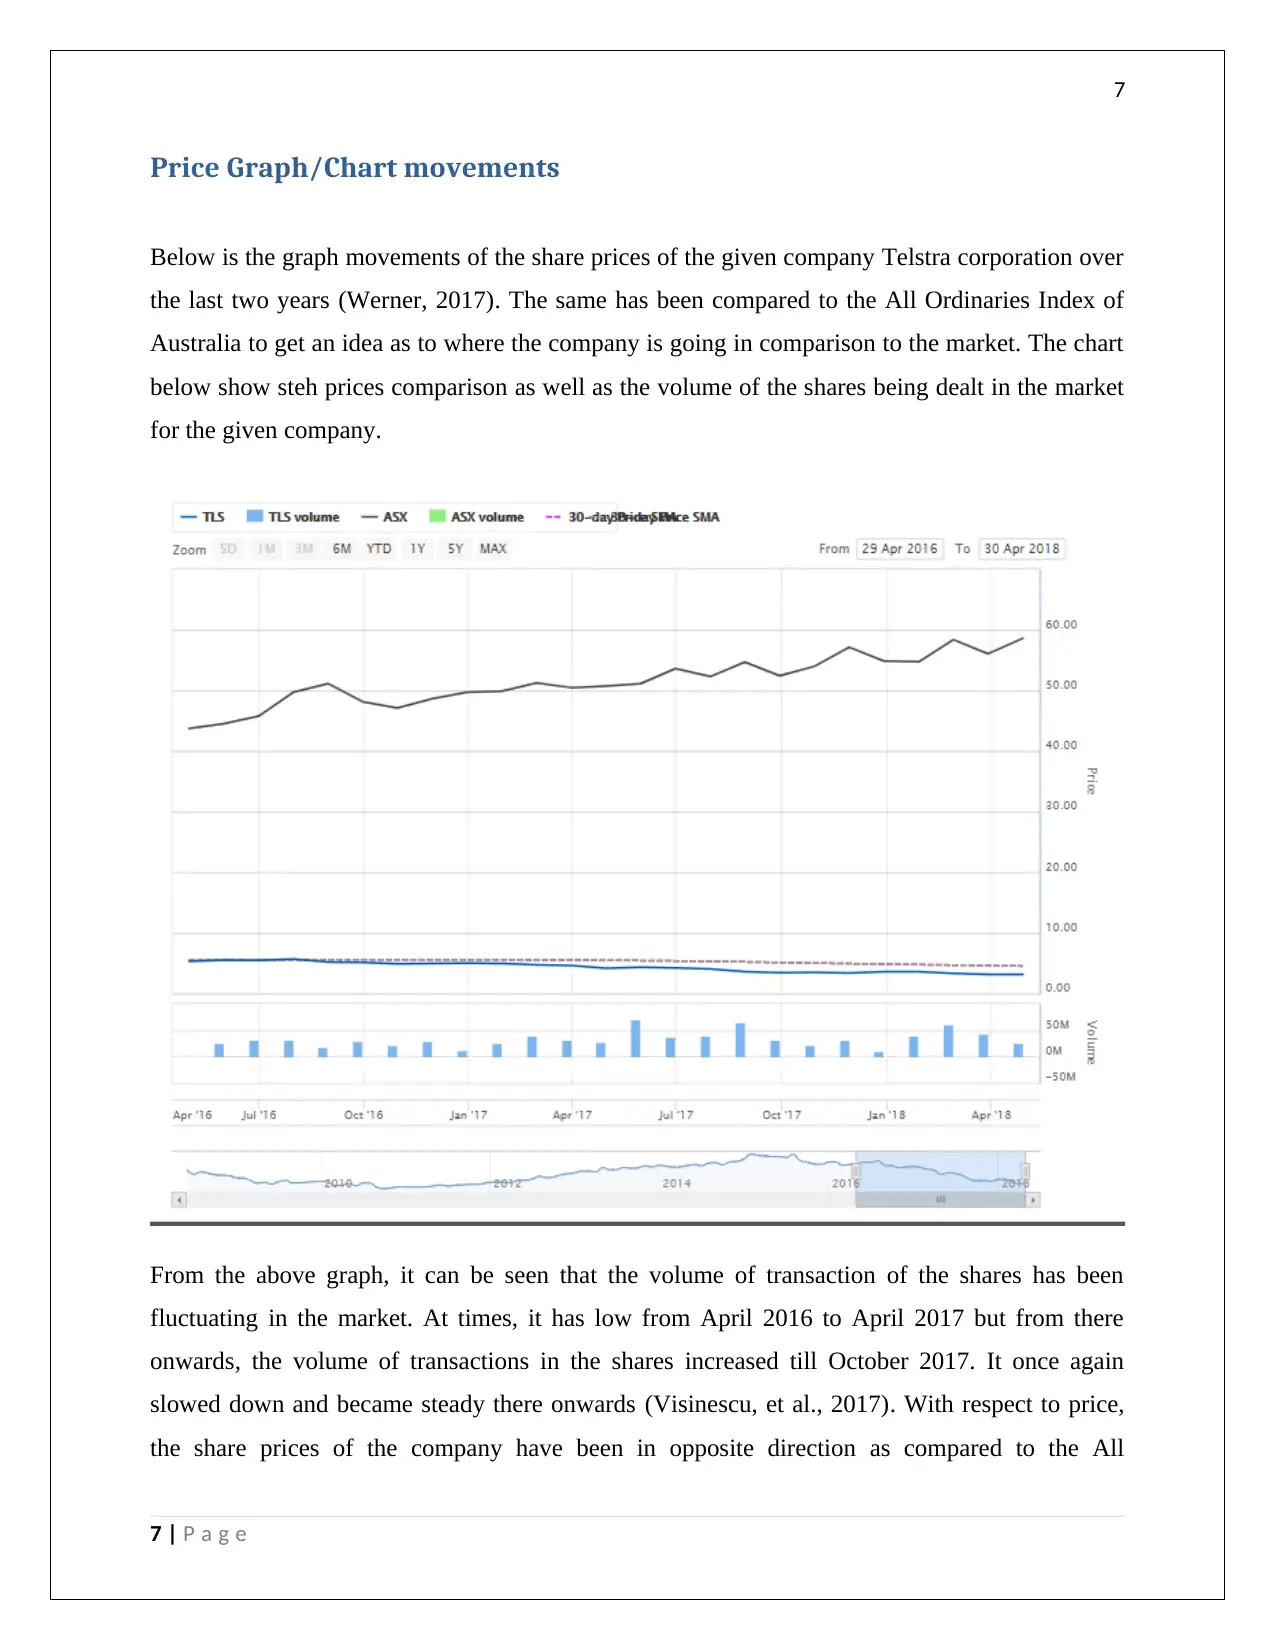
Below is the graph movements of the share prices of the given company Telstra corporation over
the last two years (Werner, 2017). The same has been compared to the All Ordinaries Index of
Australia to get an idea as to where the company is going in comparison to the market. The chart
below show steh prices comparison as well as the volume of the shares being dealt in the market
for the given company.
From the above graph, it can be seen that the volume of transaction of the shares has been
fluctuating in the market. At times, it has low from April 2016 to April 2017 but from there
onwards, the volume of transactions in the shares increased till October 2017. It once again
slowed down and became steady there onwards (Visinescu, et al., 2017). With respect to price,
the share prices of the company have been in opposite direction as compared to the All
7 | P a g e
Price Graph/Chart movements
Below is the graph movements of the share prices of the given company Telstra corporation over
the last two years (Werner, 2017). The same has been compared to the All Ordinaries Index of
Australia to get an idea as to where the company is going in comparison to the market. The chart
below show steh prices comparison as well as the volume of the shares being dealt in the market
for the given company.
From the above graph, it can be seen that the volume of transaction of the shares has been
fluctuating in the market. At times, it has low from April 2016 to April 2017 but from there
onwards, the volume of transactions in the shares increased till October 2017. It once again
slowed down and became steady there onwards (Visinescu, et al., 2017). With respect to price,
the share prices of the company have been in opposite direction as compared to the All
7 | P a g e
8
Ordinaries Index. Where the index has increased over the last 2 years with small fluctuations in
between, the share prices of Telstra has been going down in the last 2 years. Therefore, it can be
said that the Telstra’s graph has been below the All Ordinaries Index. However, the volatility in
the Telstra has been less as compared to ASX which can be seen from the graph as Telstra’s
graph is much flatter than the ASX’s graph (Vieira, et al., 2017).
Significant Announcements with respect to company – Telstra Corp.
There may be many reasons for the change in prices of the company. The factors may be internal
or external, those affecting the company or the industry as a whole. These factors may be
systematic as well as unsystematic. Some of the factors which may influence the prices of the
company include change in managements’ estiamtes of the sales, profits or earnings, divestiture
or a new investment, merger or acquisition by the subject company, unusual write off in the
books or some abnormal items, significant management changes or industry wide changes,
change in the focus of company or the macroeconomic factors, impact of competitors or legal
proceedings on the business, etc (Erik & Jan, 2017). In the given case, some of the recent
announcements regarding Telstra include signing of the digitization deal by Rabobank with
Telstra, giving a boost to the future earnings and business, leading to the boost in the share
prices. Also, Telstra has ventured into the 5G business off late showing the intensity to enter into
digitization. The company also entered into the cloud voice services deal with Microsoft. The
company also recently announced the declaration and distribution of dividend in mid March
leading a boost to the share prices. In the month of March however, the company announced the
impairment of its US based intelligent video business and marked down its value to zero (Choy,
2018). On thop of this, the company also estimated the impairment charges of A$ 273 Mn
against non current assets and the goodwill. This news came down as a heavy impact on the
share prices leading it to fall down. The company also made an announcement on FY18 guidance
for nbn by stating that the revenue will fall down and that it would cease the sales of HFC
technology for the coming six to nine months which again led the share prices to fall in the
period of December to January.
8 | P a g e
⊘ This is a preview!⊘
Do you want full access?
Subscribe today to unlock all pages.
Trusted by 1+ million students worldwide
9
Calculation of Beta and rate of return of the company using CAPM
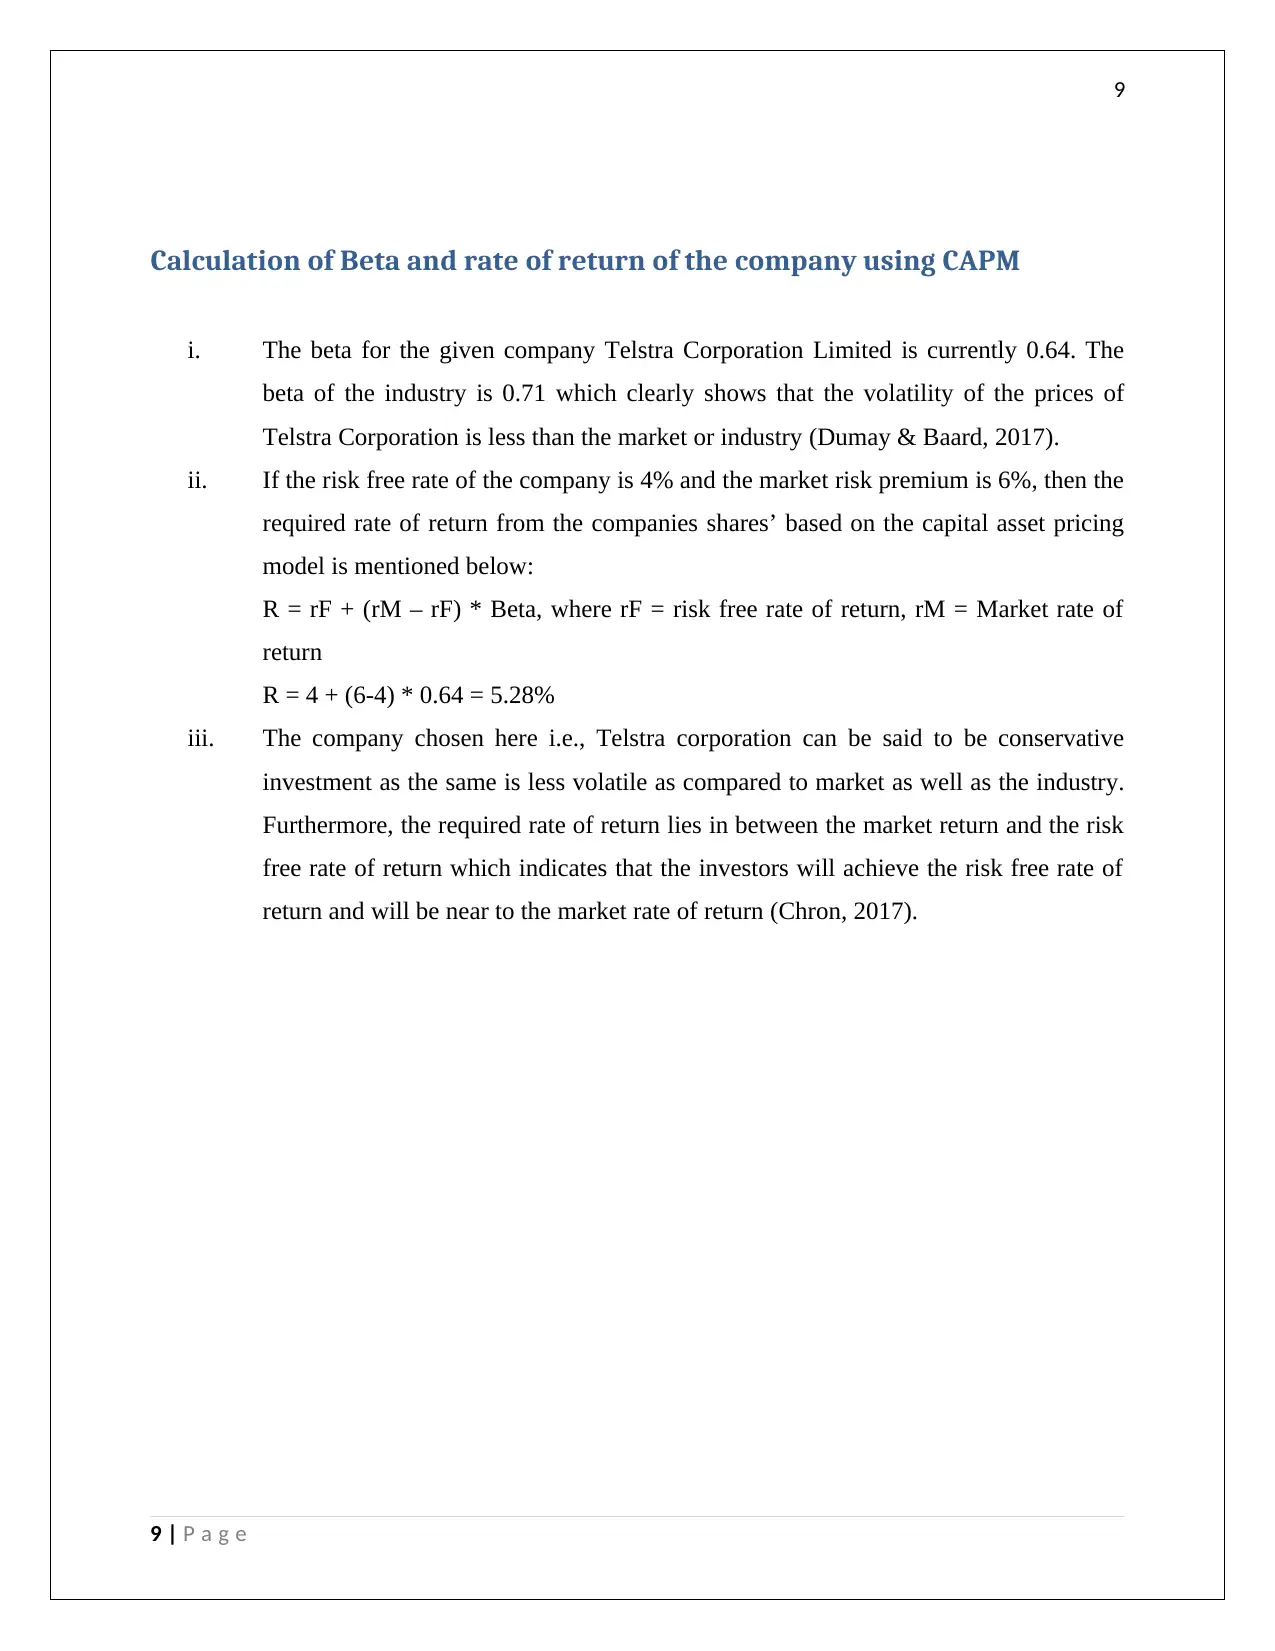
i. The beta for the given company Telstra Corporation Limited is currently 0.64. The
beta of the industry is 0.71 which clearly shows that the volatility of the prices of
Telstra Corporation is less than the market or industry (Dumay & Baard, 2017).
ii. If the risk free rate of the company is 4% and the market risk premium is 6%, then the
required rate of return from the companies shares’ based on the capital asset pricing
model is mentioned below:
R = rF + (rM – rF) * Beta, where rF = risk free rate of return, rM = Market rate of
return
R = 4 + (6-4) * 0.64 = 5.28%
iii. The company chosen here i.e., Telstra corporation can be said to be conservative
investment as the same is less volatile as compared to market as well as the industry.
Furthermore, the required rate of return lies in between the market return and the risk
free rate of return which indicates that the investors will achieve the risk free rate of
return and will be near to the market rate of return (Chron, 2017).
9 | P a g e
Calculation of Beta and rate of return of the company using CAPM
i. The beta for the given company Telstra Corporation Limited is currently 0.64. The
beta of the industry is 0.71 which clearly shows that the volatility of the prices of
Telstra Corporation is less than the market or industry (Dumay & Baard, 2017).
ii. If the risk free rate of the company is 4% and the market risk premium is 6%, then the
required rate of return from the companies shares’ based on the capital asset pricing
model is mentioned below:
R = rF + (rM – rF) * Beta, where rF = risk free rate of return, rM = Market rate of
return
R = 4 + (6-4) * 0.64 = 5.28%
iii. The company chosen here i.e., Telstra corporation can be said to be conservative
investment as the same is less volatile as compared to market as well as the industry.
Furthermore, the required rate of return lies in between the market return and the risk
free rate of return which indicates that the investors will achieve the risk free rate of
return and will be near to the market rate of return (Chron, 2017).
9 | P a g e
Paraphrase This Document
Need a fresh take? Get an instant paraphrase of this document with our AI Paraphraser
10
Calculation of Weighted average cost of capital
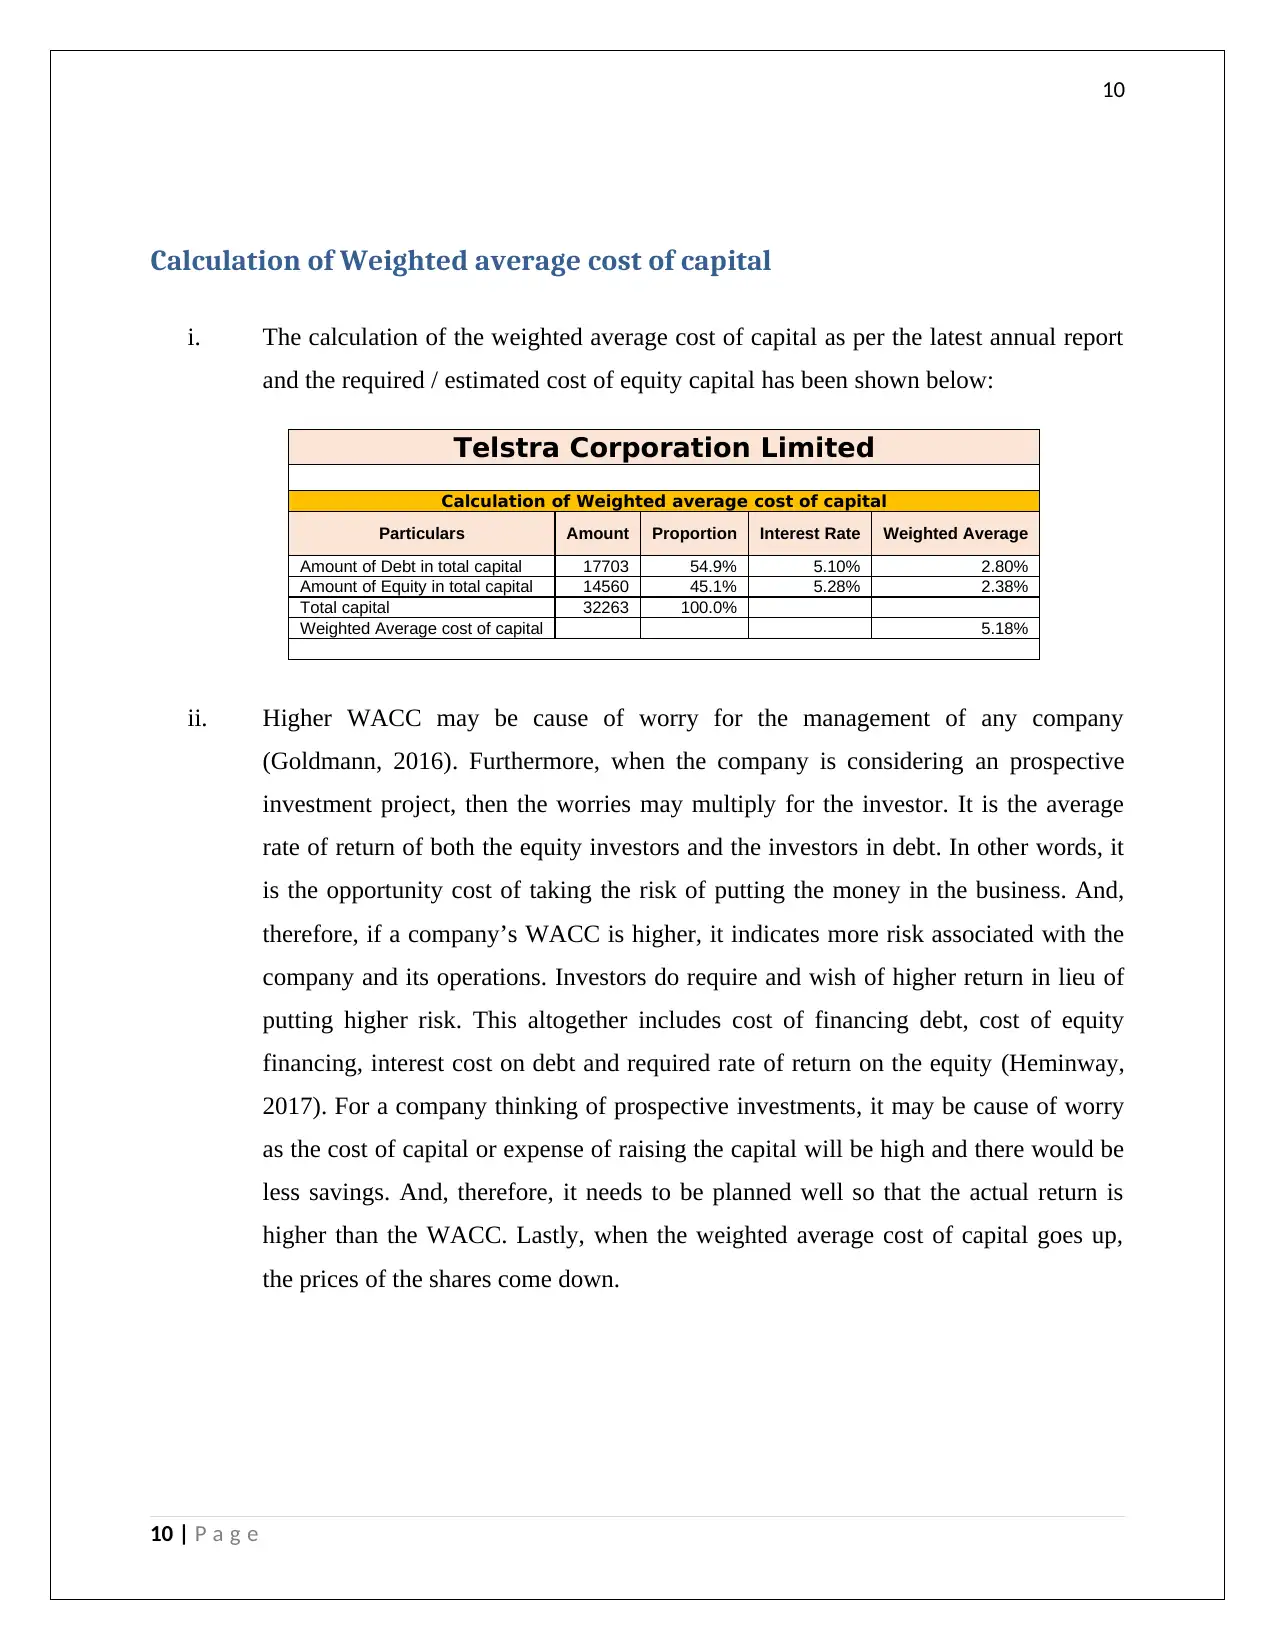
i. The calculation of the weighted average cost of capital as per the latest annual report
and the required / estimated cost of equity capital has been shown below:
Telstra Corporation Limited
Calculation of Weighted average cost of capital
Particulars Amount Proportion Interest Rate Weighted Average
Amount of Debt in total capital 17703 54.9% 5.10% 2.80%
Amount of Equity in total capital 14560 45.1% 5.28% 2.38%
Total capital 32263 100.0%
Weighted Average cost of capital 5.18%
ii. Higher WACC may be cause of worry for the management of any company
(Goldmann, 2016). Furthermore, when the company is considering an prospective
investment project, then the worries may multiply for the investor. It is the average
rate of return of both the equity investors and the investors in debt. In other words, it
is the opportunity cost of taking the risk of putting the money in the business. And,
therefore, if a company’s WACC is higher, it indicates more risk associated with the
company and its operations. Investors do require and wish of higher return in lieu of
putting higher risk. This altogether includes cost of financing debt, cost of equity
financing, interest cost on debt and required rate of return on the equity (Heminway,
2017). For a company thinking of prospective investments, it may be cause of worry
as the cost of capital or expense of raising the capital will be high and there would be
less savings. And, therefore, it needs to be planned well so that the actual return is
higher than the WACC. Lastly, when the weighted average cost of capital goes up,
the prices of the shares come down.
10 | P a g e
Calculation of Weighted average cost of capital
i. The calculation of the weighted average cost of capital as per the latest annual report
and the required / estimated cost of equity capital has been shown below:
Telstra Corporation Limited
Calculation of Weighted average cost of capital
Particulars Amount Proportion Interest Rate Weighted Average
Amount of Debt in total capital 17703 54.9% 5.10% 2.80%
Amount of Equity in total capital 14560 45.1% 5.28% 2.38%
Total capital 32263 100.0%
Weighted Average cost of capital 5.18%
ii. Higher WACC may be cause of worry for the management of any company
(Goldmann, 2016). Furthermore, when the company is considering an prospective
investment project, then the worries may multiply for the investor. It is the average
rate of return of both the equity investors and the investors in debt. In other words, it
is the opportunity cost of taking the risk of putting the money in the business. And,
therefore, if a company’s WACC is higher, it indicates more risk associated with the
company and its operations. Investors do require and wish of higher return in lieu of
putting higher risk. This altogether includes cost of financing debt, cost of equity
financing, interest cost on debt and required rate of return on the equity (Heminway,
2017). For a company thinking of prospective investments, it may be cause of worry
as the cost of capital or expense of raising the capital will be high and there would be
less savings. And, therefore, it needs to be planned well so that the actual return is
higher than the WACC. Lastly, when the weighted average cost of capital goes up,
the prices of the shares come down.
10 | P a g e
11
Debt ratio of the company
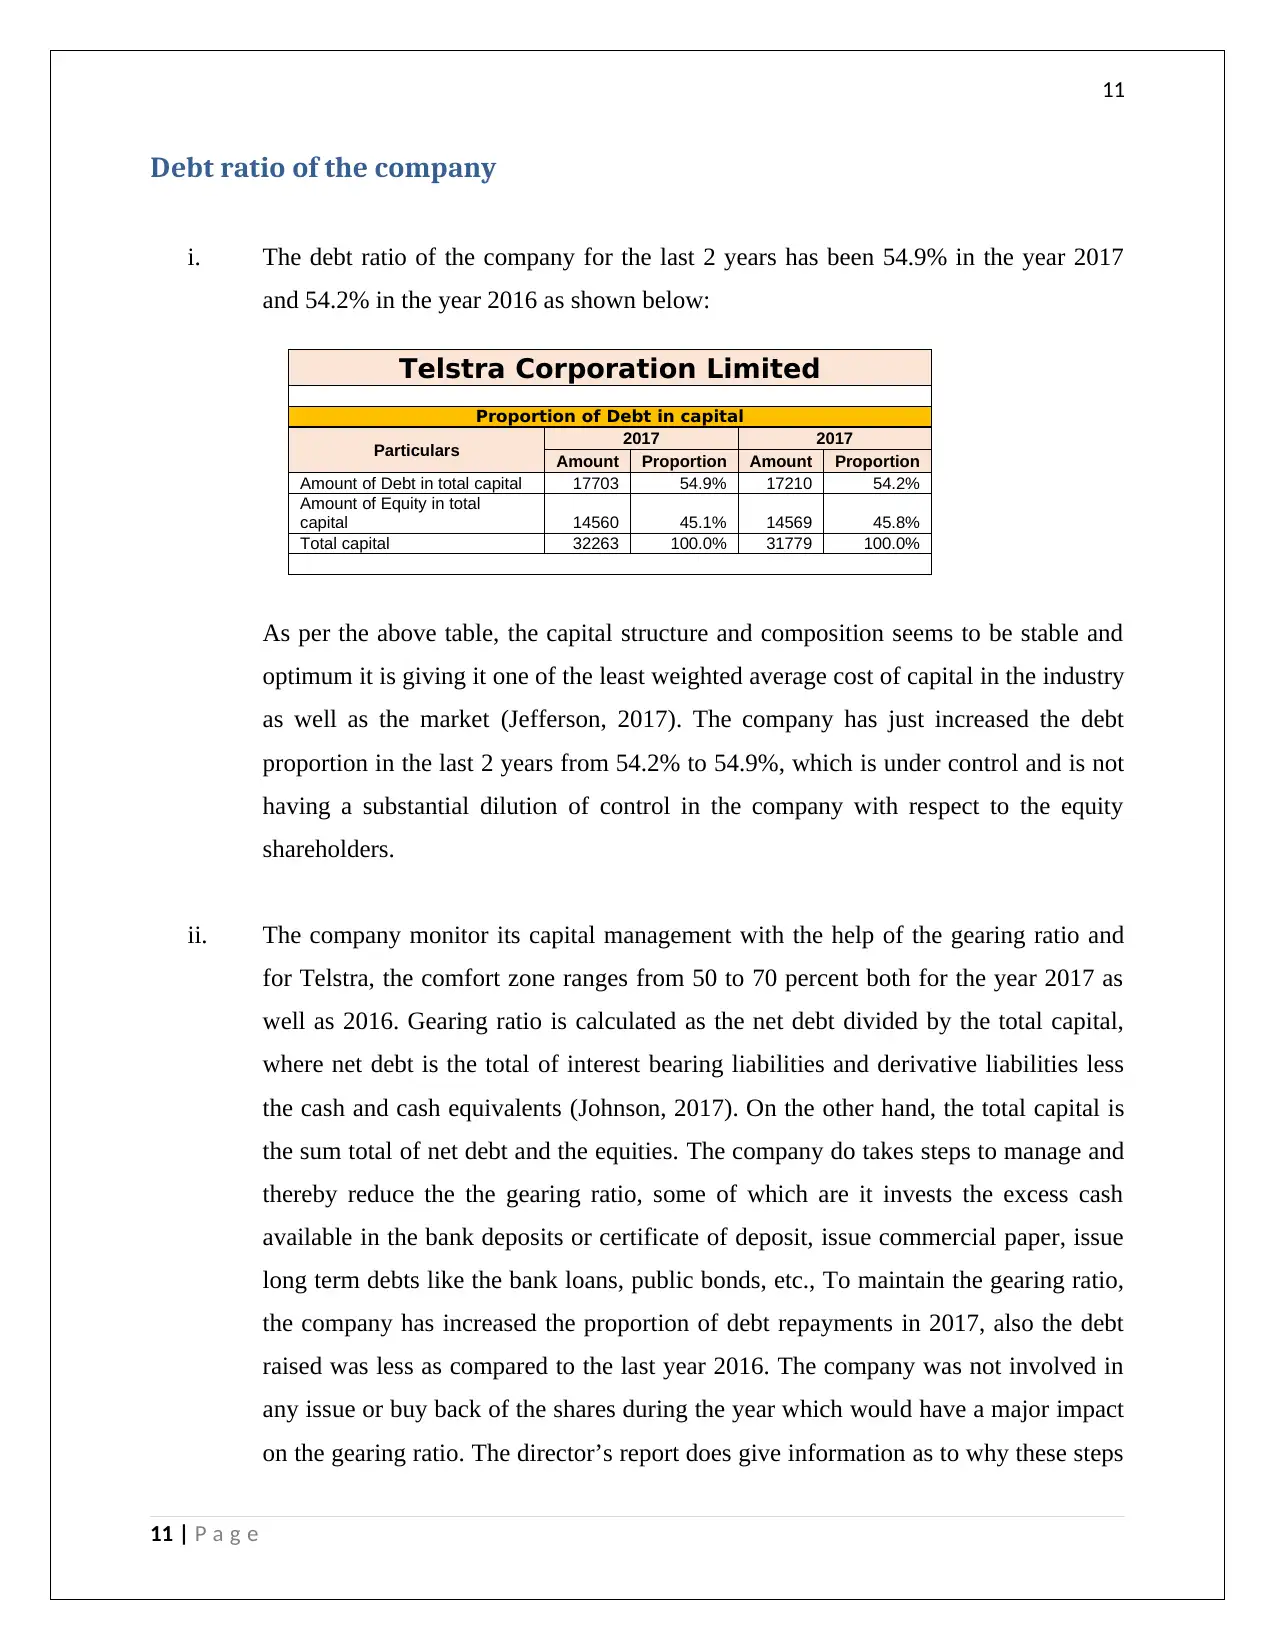
i. The debt ratio of the company for the last 2 years has been 54.9% in the year 2017
and 54.2% in the year 2016 as shown below:
Telstra Corporation Limited
Proportion of Debt in capital
Particulars 2017 2017
Amount Proportion Amount Proportion
Amount of Debt in total capital 17703 54.9% 17210 54.2%
Amount of Equity in total
capital 14560 45.1% 14569 45.8%
Total capital 32263 100.0% 31779 100.0%
As per the above table, the capital structure and composition seems to be stable and
optimum it is giving it one of the least weighted average cost of capital in the industry
as well as the market (Jefferson, 2017). The company has just increased the debt
proportion in the last 2 years from 54.2% to 54.9%, which is under control and is not
having a substantial dilution of control in the company with respect to the equity
shareholders.
ii. The company monitor its capital management with the help of the gearing ratio and
for Telstra, the comfort zone ranges from 50 to 70 percent both for the year 2017 as
well as 2016. Gearing ratio is calculated as the net debt divided by the total capital,
where net debt is the total of interest bearing liabilities and derivative liabilities less
the cash and cash equivalents (Johnson, 2017). On the other hand, the total capital is
the sum total of net debt and the equities. The company do takes steps to manage and
thereby reduce the the gearing ratio, some of which are it invests the excess cash
available in the bank deposits or certificate of deposit, issue commercial paper, issue
long term debts like the bank loans, public bonds, etc., To maintain the gearing ratio,
the company has increased the proportion of debt repayments in 2017, also the debt
raised was less as compared to the last year 2016. The company was not involved in
any issue or buy back of the shares during the year which would have a major impact
on the gearing ratio. The director’s report does give information as to why these steps
11 | P a g e
Debt ratio of the company
i. The debt ratio of the company for the last 2 years has been 54.9% in the year 2017
and 54.2% in the year 2016 as shown below:
Telstra Corporation Limited
Proportion of Debt in capital
Particulars 2017 2017
Amount Proportion Amount Proportion
Amount of Debt in total capital 17703 54.9% 17210 54.2%
Amount of Equity in total
capital 14560 45.1% 14569 45.8%
Total capital 32263 100.0% 31779 100.0%
As per the above table, the capital structure and composition seems to be stable and
optimum it is giving it one of the least weighted average cost of capital in the industry
as well as the market (Jefferson, 2017). The company has just increased the debt
proportion in the last 2 years from 54.2% to 54.9%, which is under control and is not
having a substantial dilution of control in the company with respect to the equity
shareholders.
ii. The company monitor its capital management with the help of the gearing ratio and
for Telstra, the comfort zone ranges from 50 to 70 percent both for the year 2017 as
well as 2016. Gearing ratio is calculated as the net debt divided by the total capital,
where net debt is the total of interest bearing liabilities and derivative liabilities less
the cash and cash equivalents (Johnson, 2017). On the other hand, the total capital is
the sum total of net debt and the equities. The company do takes steps to manage and
thereby reduce the the gearing ratio, some of which are it invests the excess cash
available in the bank deposits or certificate of deposit, issue commercial paper, issue
long term debts like the bank loans, public bonds, etc., To maintain the gearing ratio,
the company has increased the proportion of debt repayments in 2017, also the debt
raised was less as compared to the last year 2016. The company was not involved in
any issue or buy back of the shares during the year which would have a major impact
on the gearing ratio. The director’s report does give information as to why these steps
11 | P a g e
⊘ This is a preview!⊘
Do you want full access?
Subscribe today to unlock all pages.
Trusted by 1+ million students worldwide
1 out of 17
Related Documents


Your All-in-One AI-Powered Toolkit for Academic Success.
+13062052269
info@desklib.com
Available 24*7 on WhatsApp / Email
![[object Object]](/_next/static/media/star-bottom.7253800d.svg)
Unlock your academic potential
Copyright © 2020–2026 A2Z Services. All Rights Reserved. Developed and managed by ZUCOL.