ACCT20071 Assignment 1: Financial Structure of Telstra Corporation
VerifiedAdded on 2022/09/27
|10
|1694
|27
Report
AI Summary
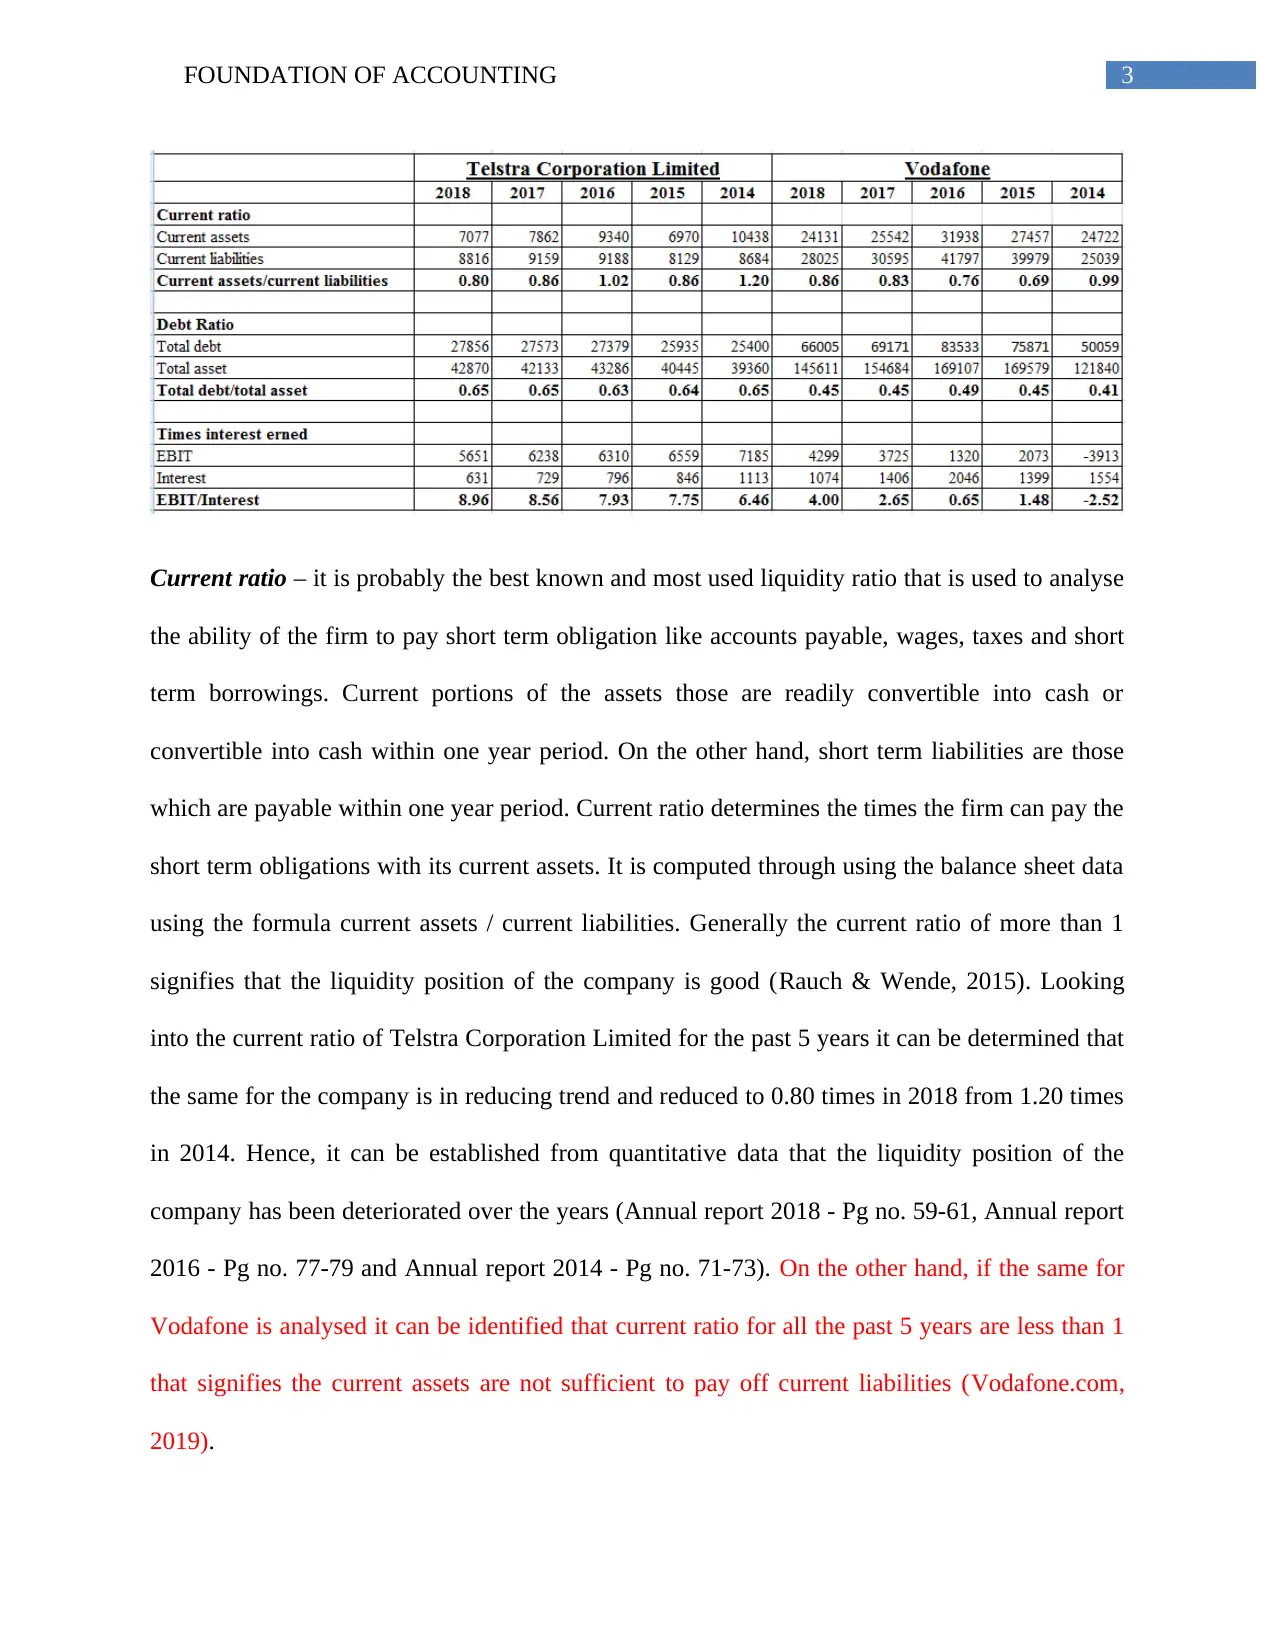
This report provides a comprehensive financial analysis of Telstra Corporation, a leading Australian technology and telecommunications company. The report begins with an overview of Telstra and its industry, including the competitive landscape of the Australian telecommunications sector. It then critically evaluates Telstra's financial structure using ratio analysis, focusing on the current ratio, debt ratio, and times interest earned ratio over a five-year period. The analysis compares Telstra's performance with that of Vodafone. The report also examines the valuation of non-current assets, including property, plant, and equipment (PPE) and intangible assets like goodwill, comparing Telstra's accounting practices with those of Vodafone. Finally, the report concludes with a self-reflection on key learning outcomes and the practical application of the assignment in an accounting career, along with the experience of working in a team environment.

Running head: FOUNDATION OF ACCOUNTING
Foundation of accounting
Name of the student
Name of the university
Student ID
Author note
Foundation of accounting
Name of the student
Name of the university
Student ID
Author note
Paraphrase This Document
Need a fresh take? Get an instant paraphrase of this document with our AI Paraphraser

1FOUNDATION OF ACCOUNTING
Table of Contents
Introduction about the company and its industry............................................................................2
Evaluation of financial structure......................................................................................................2
Valuation of non-current assets.......................................................................................................4
Conclusion.......................................................................................................................................5
Self – reflection................................................................................................................................6
Key learning outcome..................................................................................................................6
Help of the assignment in accounting career...............................................................................6
Experience of working in team group environment....................................................................6
Reference.........................................................................................................................................7
Link of annual reports......................................................................................................................8

2FOUNDATION OF ACCOUNTING
Introduction about the company and its industry
Telstra Corporation is the technology and telecommunication company from Australia.
Main activity of the firm is providing information and telecommunication services for
international and domestic customers. It is the leading technology and telecommunication
company that offers full range of the communication services and competes in the
telecommunication market. Australian telecommunication sector is broadly segregated into the
market for mobile services and for the landline services (Telstra.com.au, 2019). For the landline
services Optus and Telstra is the network owners and are wholesalers and retailers for wide
range of the landline services. However, in recent times the market has been transformed
significantly as Australian Government established government – owned enterprise NBN Co
Limited that is tasked with deploying, designing and operating of high speed next generation
network access all over Australia. Further, the Australian telecommunication industry
competitive as there exists evidence for competition among major service providers of voice
eservices and broadband. In addition to that the smaller providers as well as new entrants have
the potential for providing competitive tension through exercise of some constraints on larger
providers (Telstra.com.au, 2019).
Evaluation of financial structure
One of the techniques that can be used for evaluating the financial structure of the
company is ratio analysis. Ratio analysis is comparison of the line items included in the financial
statements of any company. It is used to analyse various issues of the company including the
financial stability.
⊘ This is a preview!⊘
Do you want full access?
Subscribe today to unlock all pages.

Trusted by 1+ million students worldwide

3FOUNDATION OF ACCOUNTING
Current ratio – it is probably the best known and most used liquidity ratio that is used to analyse
the ability of the firm to pay short term obligation like accounts payable, wages, taxes and short
term borrowings. Current portions of the assets those are readily convertible into cash or
convertible into cash within one year period. On the other hand, short term liabilities are those
which are payable within one year period. Current ratio determines the times the firm can pay the
short term obligations with its current assets. It is computed through using the balance sheet data
using the formula current assets / current liabilities. Generally the current ratio of more than 1
signifies that the liquidity position of the company is good (Rauch & Wende, 2015). Looking
into the current ratio of Telstra Corporation Limited for the past 5 years it can be determined that
the same for the company is in reducing trend and reduced to 0.80 times in 2018 from 1.20 times
in 2014. Hence, it can be established from quantitative data that the liquidity position of the
company has been deteriorated over the years (Annual report 2018 - Pg no. 59-61, Annual report
2016 - Pg no. 77-79 and Annual report 2014 - Pg no. 71-73). On the other hand, if the same for
Vodafone is analysed it can be identified that current ratio for all the past 5 years are less than 1
that signifies the current assets are not sufficient to pay off current liabilities (Vodafone.com,
2019).
Paraphrase This Document
Need a fresh take? Get an instant paraphrase of this document with our AI Paraphraser

4FOUNDATION OF ACCOUNTING
Debt ratio – it is used for measuring asset proportion that is paid for with the debt. It can be used
to conclude about the firm’s solvency. High debt ratio signifies that major proportion of the asset
is obtained through debt which is considered as the risky structure of finance as the borrower will
be exposed to the risk of interest due on the borrowing. On the other hand, low debt ratio
signifies the company’s conservative financing strategy as the company in that case only uses
equity for obtaining assets (Liang et al., 2016). This ratio is further used by creditors and lenders
for estimating the level of lending risk. It is computed through dividing the total liabilities by
total assets. Over the past 5 years debt ratio of the company did not changed much and moving
around 0.63 to 0.65 which is quite high (Annual report 2018 - Pg no. 59-61, Annual report 2016 -
Pg no. 77-79 and Annual report 2014 - Pg no. 71-73). On the other hand, if the same for
Vodafone is analysed it can be identified that debt ratio for all the past 5 years are better than
Telstra Corporation as the debt ratio is ranging between 0.41 and 0.49 (Vodafone.com, 2019).
Times interest earned – it indicates the company’s ability to meet the interest obligation due on
the borrowing. It is computed through dividing the operating profit by finance costs. Higher ratio
signifies that the company is efficient in making its interest payment from the operating profit
(Gatzert & Heidinger, 2018). Analysing the times interest earned of the company for last 5 years
it can be determined that the same is in increasing trend and increased to 8.96 times in 2018 from
6.46 in 2014 (Annual report 2018 - Pg no. 59-61, Annual report 2016 - Pg no. 77-79 and Annual
report 2014 - Pg no. 71-73). On the other hand, if the same for Vodafone is analysed it can be
identified that interest earned ratio for the company is in enhancing trend it is not sufficient and
Telstra is better in this aspect (Vodafone.com, 2019).

5FOUNDATION OF ACCOUNTING
Valuation of non-current assets
Non-current tangible asset of the company like plant property and equipment (PPE) is
reported at the cost for which it has been acquired and reduced by the amount of accumulated
depreciation and impairment, if any. Further, all the non-current tangible assets are tested for
impairment on annual basis or if any indication is there that the asset may be impaired. Goodwill
of the entity that is generated through business combination is valued at cost. On the other hand,
acquired intangibles assets valued at fair value at the acquisition date and is separately
recognised from goodwill. The intangible assets and goodwill with the indefinite life are not
amortised and are tested for impairment at least annually (Telstra.com.au, 2019) (Annual report
2018, Pg 79 – 82). On the other hand, its competitor Vodafone reports the non-current assets like
plant, property and equipment at cost reduced by accumulated depreciation and impairment
losses, if any. Further, Vodafone recognizes the intangible assets while the same is controlled by
the company and likelihood is there that future economic benefit will inflow to the entity
(Vodafone.com, 2019). (Annual report 2018, Pg 125 – 127)
Conclusion
It is established from the above discussion that though the interest earned ratio of the
company has been improved, higher debt ratio and lower current ratio is signifying the solvency
risk of the company. Further, if the solvency status is compared with Vodafone it can be stated
that Vodafone is in better position. Hence, to improve the solvency position Telstra is
recommended to pay off the short term obligation through selling off the obsolete or ideal non-
current assets.
⊘ This is a preview!⊘
Do you want full access?
Subscribe today to unlock all pages.

Trusted by 1+ million students worldwide

6FOUNDATION OF ACCOUNTING
Self – reflection
Key learning outcome
Key learning outcome of the assessment is learning of how to evaluate any company
through ratio analysis by taking data from its financial statement. Further the assessment also
taught the valuation of assets including the intangible asset like goodwill.
Help of the assignment in accounting career
In future, in my accounting career this assessment will help me to analyse the company’s
financial position along with its profitability, solvency and liquidity position. Further, if the
company wants to invest in any other company, I will be able to help in decision making
procedure through analysing that company’s financial performance and evaluating that whether
it is a good decision to invest.
Experience of working in team group environment
Before this assignment, I have worked in group in some of the other subject assessment
those required to work in a group.
Paraphrase This Document
Need a fresh take? Get an instant paraphrase of this document with our AI Paraphraser

7FOUNDATION OF ACCOUNTING
Reference
Gatzert, N., & Heidinger, D. (2018). An Empirical Analysis of Market Reactions to the First
Solvency and Financial Condition Reports in the European Insurance Industry. Journal of
Risk and Insurance.
Liang, D., Lu, C. C., Tsai, C. F., & Shih, G. A. (2016). Financial ratios and corporate governance
indicators in bankruptcy prediction: A comprehensive study. European Journal of
Operational Research, 252(2), 561-572.
Rauch, J., & Wende, S. (2015). Solvency prediction for property-liability insurance companies:
Evidence from the financial crisis. The Geneva Papers on Risk and Insurance-Issues and
Practice, 40(1), 47-65.
Telstra.com.au. (2019). Telstra - mobile phones, prepaid phones, broadband, internet, home
phones, business phones. Retrieved 15 August 2019, from https://www.telstra.com.au/
Vodafone.com. (2019). Retrieved 16 August 2019, from
https://www.vodafone.com/content/annualreport/annual_report14/downloads/
full_annual_report_2014.pdf

8FOUNDATION OF ACCOUNTING
⊘ This is a preview!⊘
Do you want full access?
Subscribe today to unlock all pages.

Trusted by 1+ million students worldwide

9FOUNDATION OF ACCOUNTING
Link of annual reports
https://www.telstra.com.au/content/dam/tcom/about-us/investors/pdf%20F/2018-Annual-Report-
singlepages.pdf, Pg no. 59-61
https://www.telstra.com.au/content/dam/tcom/about-us/investors/pdf%20F/FY16-Annual-
Report-single-pages.pdf, Pg no. 77-79
https://www.telstra.com.au/content/dam/tcom/about-us/investors/pdf%20D/telstra-annual-report-
2015.pdf, Pg no. 71-73
1 out of 10
Related Documents
Your All-in-One AI-Powered Toolkit for Academic Success.
+13062052269
info@desklib.com
Available 24*7 on WhatsApp / Email
Unlock your academic potential
Copyright © 2020–2025 A2Z Services. All Rights Reserved. Developed and managed by ZUCOL.


