Financial Performance Analysis Report: Tesco Corporation Analysis
VerifiedAdded on 2022/12/01
|6
|1077
|152
Report
AI Summary
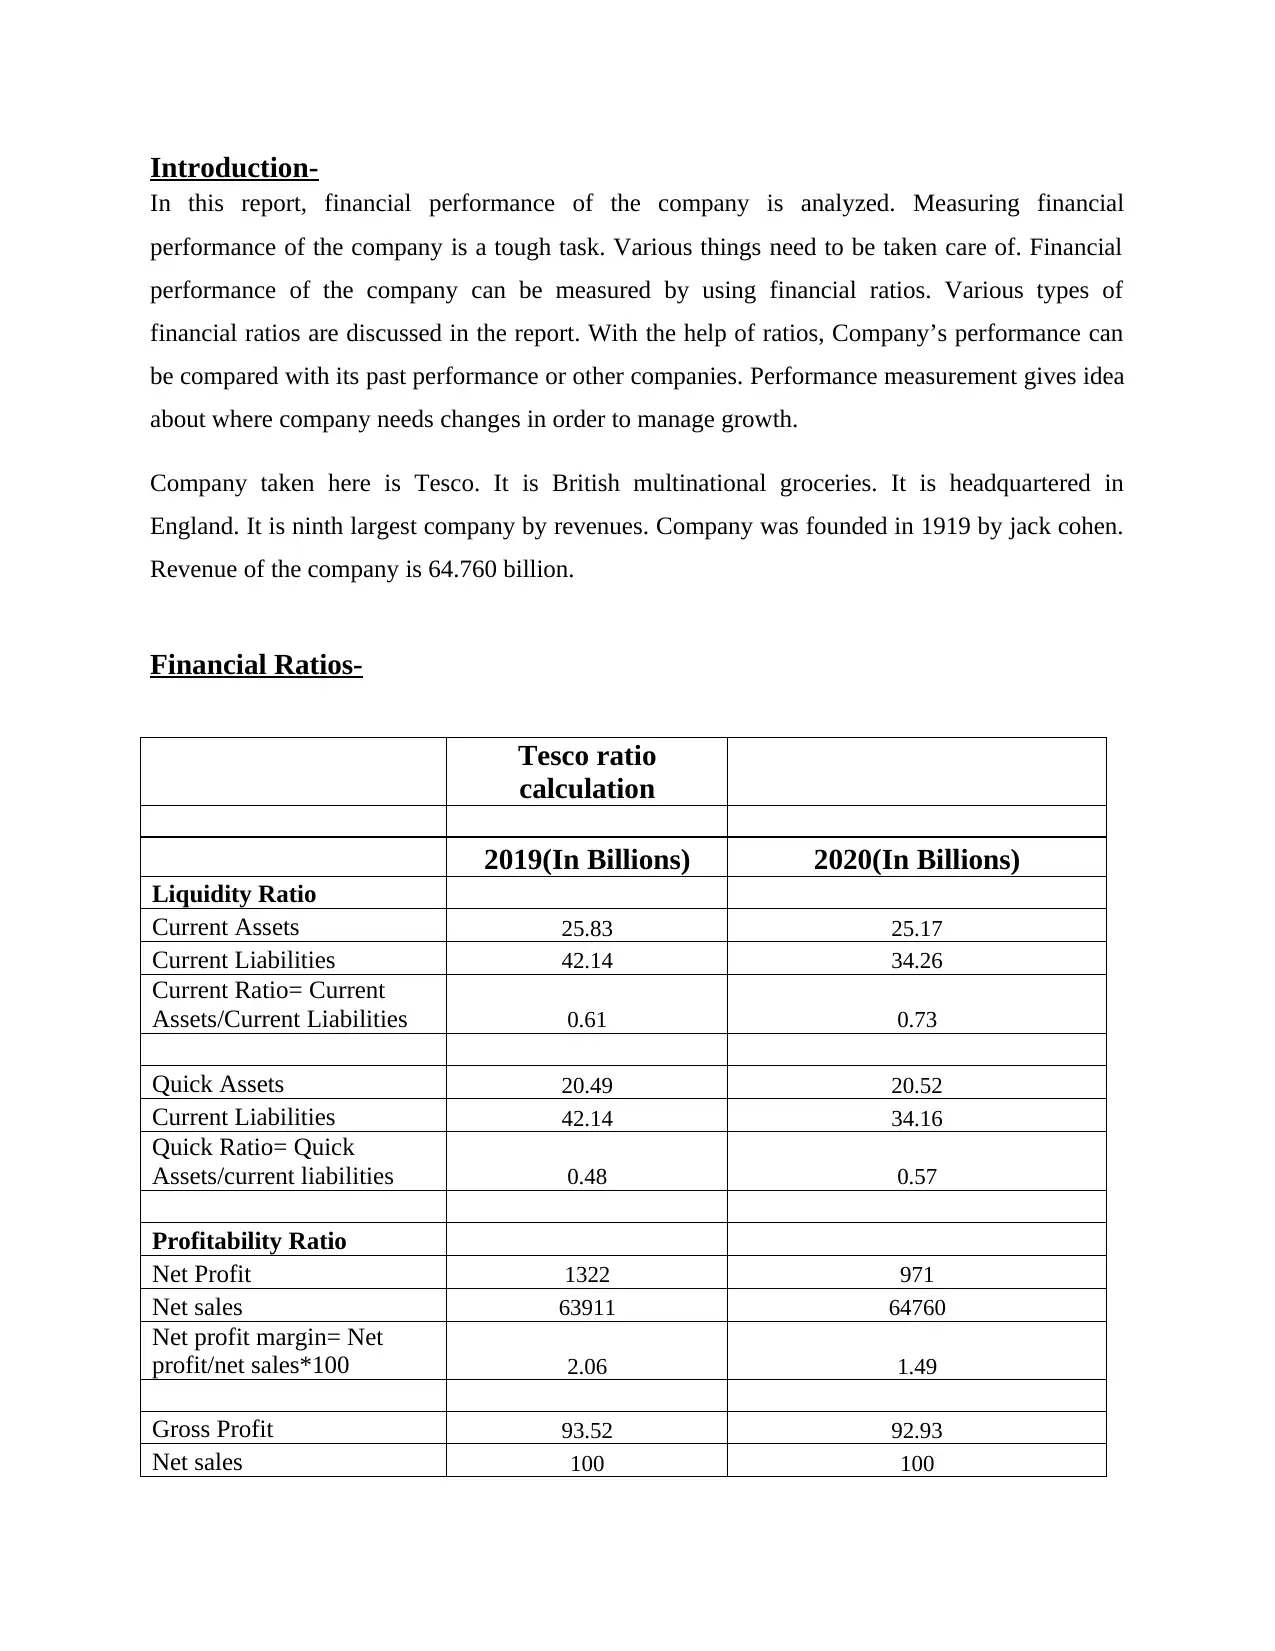
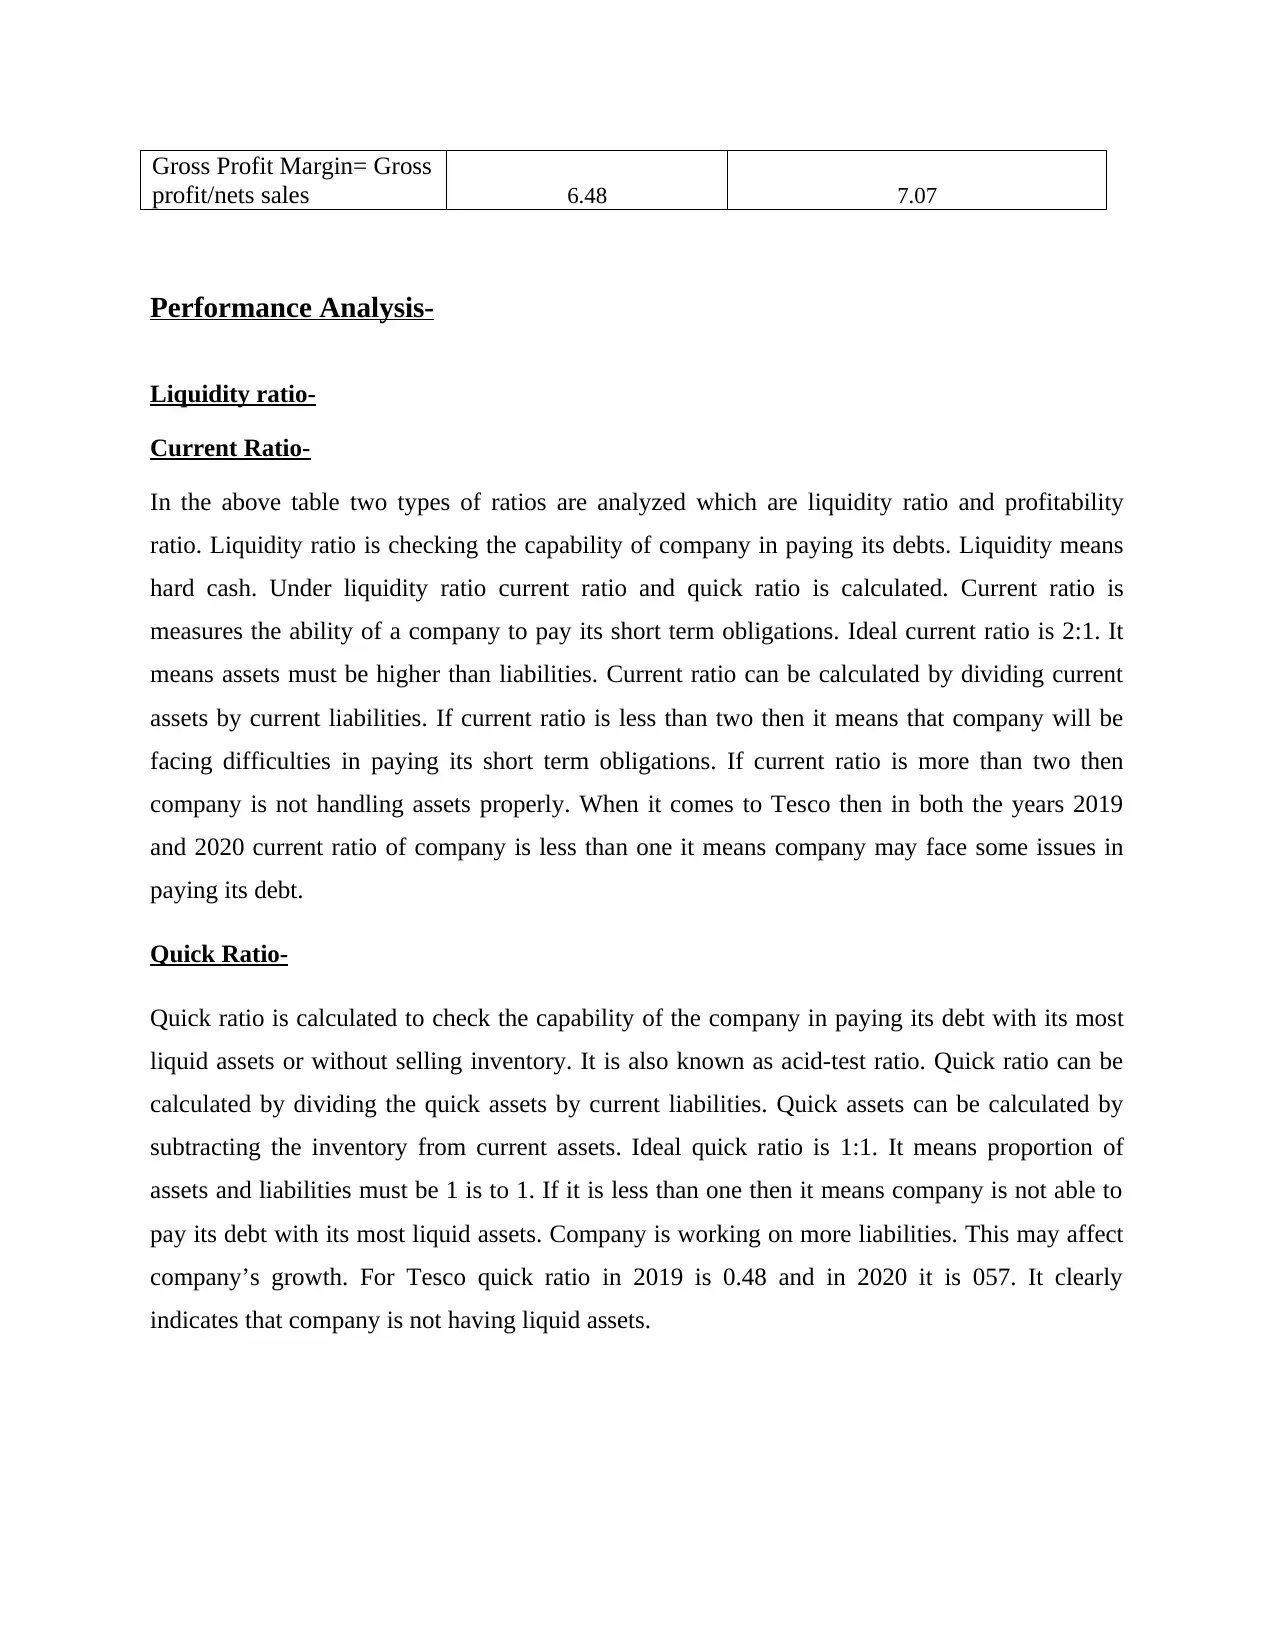
This report provides a financial performance analysis of Tesco Corporation, a British multinational groceries retailer, using financial ratios. The analysis focuses on liquidity and profitability ratios to assess the company's financial health. Liquidity ratios, including the current ratio and quick ratio, are calculated and interpreted to evaluate Tesco's ability to meet its short-term obligations. The report notes that Tesco's current and quick ratios indicate potential challenges in paying short-term debts. Profitability ratios, such as net profit margin and gross profit margin, are also examined to gauge the company's earnings and efficiency. The analysis reveals a decrease in Tesco's net profit margin in 2020 compared to 2019, indicating poorer earnings. However, the gross profit margin increased, suggesting improvements in cost of goods sold. The report concludes that financial ratios are crucial for measuring a company's performance and highlights the importance of these metrics for Tesco's growth and financial management. References to relevant academic sources are included.
1 out of 6
Related Documents


Your All-in-One AI-Powered Toolkit for Academic Success.
+13062052269
info@desklib.com
Available 24*7 on WhatsApp / Email
![[object Object]](/_next/static/media/star-bottom.7253800d.svg)
Copyright © 2020–2026 A2Z Services. All Rights Reserved. Developed and managed by ZUCOL.