Financial Performance Analysis: Tesco, M&S, and Sainsbury's Case Study
VerifiedAdded on 2023/06/18
|16
|3273
|399
Case Study
AI Summary
This case study provides a comprehensive financial analysis of Tesco PLC, Marks & Spencer, and Sainsbury's, evaluating their strategic plans, financial goals, nature of business, and market share. It includes a detailed ratio analysis covering current ratio, quick ratio, gross profit ratio, net profit ratio, and return on equity for each company. The analysis identifies Tesco PLC as a potentially better investment option based on its diversified business activities and market performance. The study also explores the main types of internal and external long-term finance available to listed companies, discussing the impact of finance choices on existing stakeholders. Desklib offers similar solved assignments and past papers for students.
Case Study
Paraphrase This Document
Need a fresh take? Get an instant paraphrase of this document with our AI Paraphraser

Contents
SECTION A...................................................................................................................................................3
1b Ratio analysis......................................................................................................................................5
1c Best performing company...................................................................................................................9
SECTION B..................................................................................................................................................10
2a Main types of internal and external long-term finance available to listed companies..........10
2b Affect of choosing long term finance on interest of existing stakeholders of given company
...............................................................................................................................................................12
REFERENCES..............................................................................................................................................14
⊘ This is a preview!⊘
Do you want full access?
Subscribe today to unlock all pages.
Trusted by 1+ million students worldwide
SECTION A
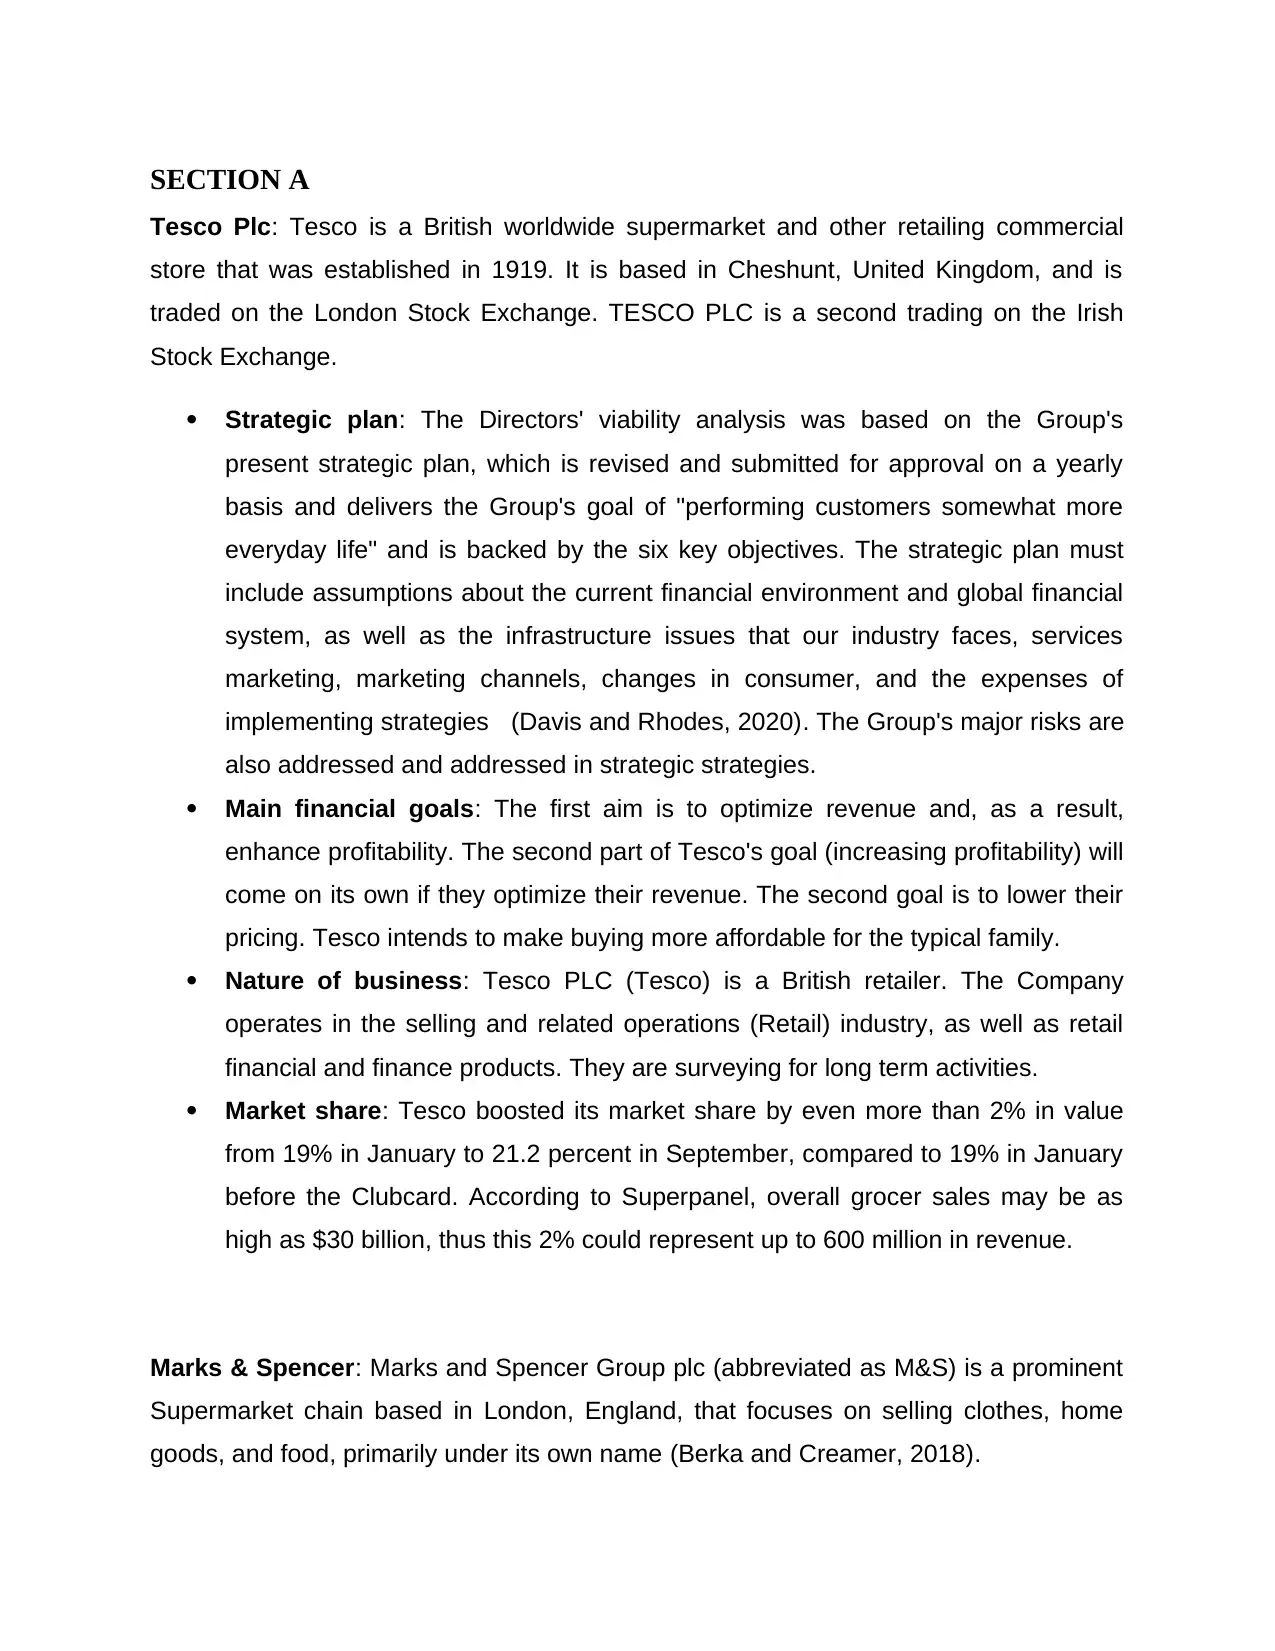
Tesco Plc: Tesco is a British worldwide supermarket and other retailing commercial
store that was established in 1919. It is based in Cheshunt, United Kingdom, and is
traded on the London Stock Exchange. TESCO PLC is a second trading on the Irish
Stock Exchange.
Strategic plan: The Directors' viability analysis was based on the Group's
present strategic plan, which is revised and submitted for approval on a yearly
basis and delivers the Group's goal of "performing customers somewhat more
everyday life" and is backed by the six key objectives. The strategic plan must
include assumptions about the current financial environment and global financial
system, as well as the infrastructure issues that our industry faces, services
marketing, marketing channels, changes in consumer, and the expenses of
implementing strategies (Davis and Rhodes, 2020). The Group's major risks are
also addressed and addressed in strategic strategies.
Main financial goals: The first aim is to optimize revenue and, as a result,
enhance profitability. The second part of Tesco's goal (increasing profitability) will
come on its own if they optimize their revenue. The second goal is to lower their
pricing. Tesco intends to make buying more affordable for the typical family.
Nature of business: Tesco PLC (Tesco) is a British retailer. The Company
operates in the selling and related operations (Retail) industry, as well as retail
financial and finance products. They are surveying for long term activities.
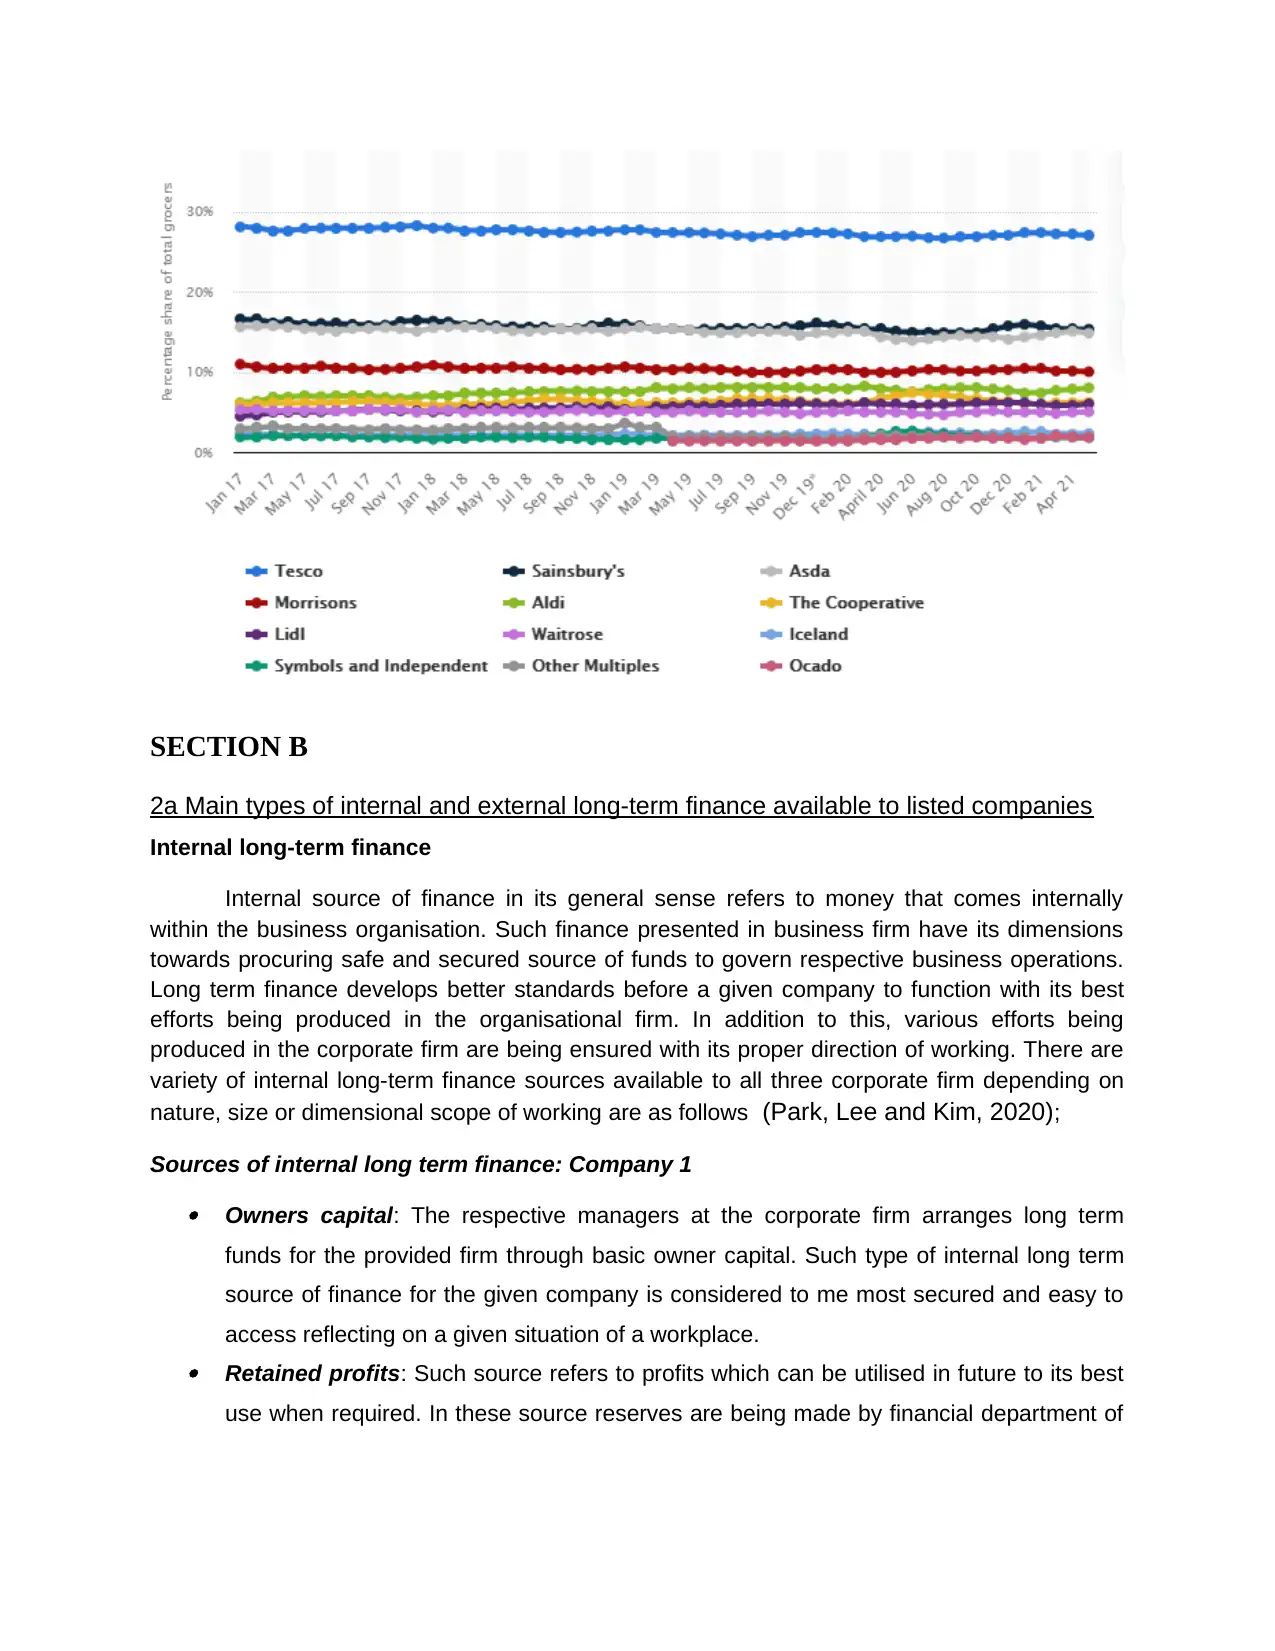
Market share: Tesco boosted its market share by even more than 2% in value
from 19% in January to 21.2 percent in September, compared to 19% in January
before the Clubcard. According to Superpanel, overall grocer sales may be as
high as $30 billion, thus this 2% could represent up to 600 million in revenue.
Marks & Spencer: Marks and Spencer Group plc (abbreviated as M&S) is a prominent
Supermarket chain based in London, England, that focuses on selling clothes, home
goods, and food, primarily under its own name (Berka and Creamer, 2018).
Tesco Plc: Tesco is a British worldwide supermarket and other retailing commercial
store that was established in 1919. It is based in Cheshunt, United Kingdom, and is
traded on the London Stock Exchange. TESCO PLC is a second trading on the Irish
Stock Exchange.
Strategic plan: The Directors' viability analysis was based on the Group's
present strategic plan, which is revised and submitted for approval on a yearly
basis and delivers the Group's goal of "performing customers somewhat more
everyday life" and is backed by the six key objectives. The strategic plan must
include assumptions about the current financial environment and global financial
system, as well as the infrastructure issues that our industry faces, services
marketing, marketing channels, changes in consumer, and the expenses of
implementing strategies (Davis and Rhodes, 2020). The Group's major risks are
also addressed and addressed in strategic strategies.
Main financial goals: The first aim is to optimize revenue and, as a result,
enhance profitability. The second part of Tesco's goal (increasing profitability) will
come on its own if they optimize their revenue. The second goal is to lower their
pricing. Tesco intends to make buying more affordable for the typical family.
Nature of business: Tesco PLC (Tesco) is a British retailer. The Company
operates in the selling and related operations (Retail) industry, as well as retail
financial and finance products. They are surveying for long term activities.
Market share: Tesco boosted its market share by even more than 2% in value
from 19% in January to 21.2 percent in September, compared to 19% in January
before the Clubcard. According to Superpanel, overall grocer sales may be as
high as $30 billion, thus this 2% could represent up to 600 million in revenue.
Marks & Spencer: Marks and Spencer Group plc (abbreviated as M&S) is a prominent
Supermarket chain based in London, England, that focuses on selling clothes, home
goods, and food, primarily under its own name (Berka and Creamer, 2018).
Paraphrase This Document
Need a fresh take? Get an instant paraphrase of this document with our AI Paraphraser
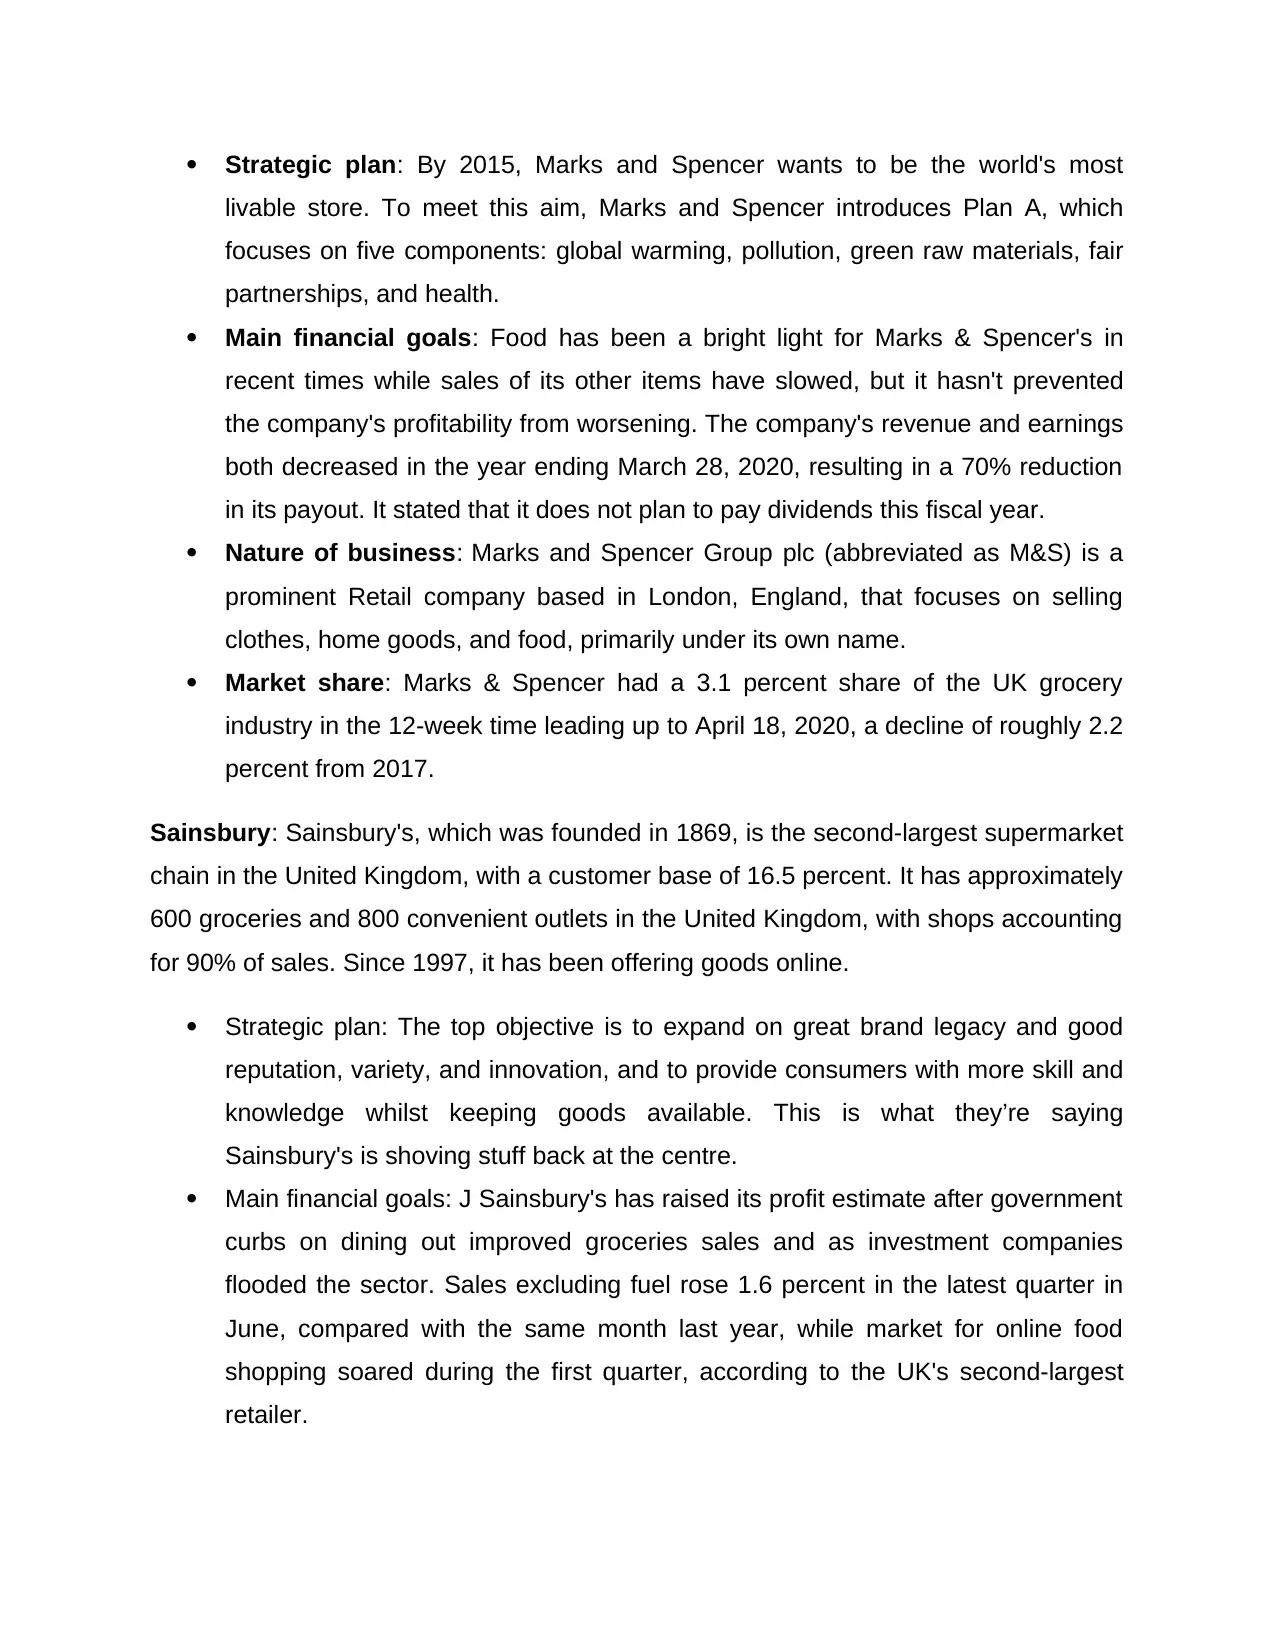
Strategic plan: By 2015, Marks and Spencer wants to be the world's most
livable store. To meet this aim, Marks and Spencer introduces Plan A, which
focuses on five components: global warming, pollution, green raw materials, fair
partnerships, and health.
Main financial goals: Food has been a bright light for Marks & Spencer's in
recent times while sales of its other items have slowed, but it hasn't prevented
the company's profitability from worsening. The company's revenue and earnings
both decreased in the year ending March 28, 2020, resulting in a 70% reduction
in its payout. It stated that it does not plan to pay dividends this fiscal year.
Nature of business: Marks and Spencer Group plc (abbreviated as M&S) is a
prominent Retail company based in London, England, that focuses on selling
clothes, home goods, and food, primarily under its own name.
Market share: Marks & Spencer had a 3.1 percent share of the UK grocery
industry in the 12-week time leading up to April 18, 2020, a decline of roughly 2.2
percent from 2017.
Sainsbury: Sainsbury's, which was founded in 1869, is the second-largest supermarket
chain in the United Kingdom, with a customer base of 16.5 percent. It has approximately
600 groceries and 800 convenient outlets in the United Kingdom, with shops accounting
for 90% of sales. Since 1997, it has been offering goods online.
Strategic plan: The top objective is to expand on great brand legacy and good
reputation, variety, and innovation, and to provide consumers with more skill and
knowledge whilst keeping goods available. This is what they’re saying
Sainsbury's is shoving stuff back at the centre.
Main financial goals: J Sainsbury's has raised its profit estimate after government
curbs on dining out improved groceries sales and as investment companies
flooded the sector. Sales excluding fuel rose 1.6 percent in the latest quarter in
June, compared with the same month last year, while market for online food
shopping soared during the first quarter, according to the UK's second-largest
retailer.
Nature of business: To offer excellent customer service while simultaneously
maximising or providing a good financial benefit to shareholders. Their goal is to
fulfill customers' standards for nutritious, safe, fresh, and flavorful food on a daily
basis to determine their lives simpler.
Market share: Sainsbury's had the greatest market share during the study period,
accounting for 42.3 percent of the market as of May 2021. In March of this year,
Asda's market share overtook Sainsbury's, which may recover second place in
specific week.
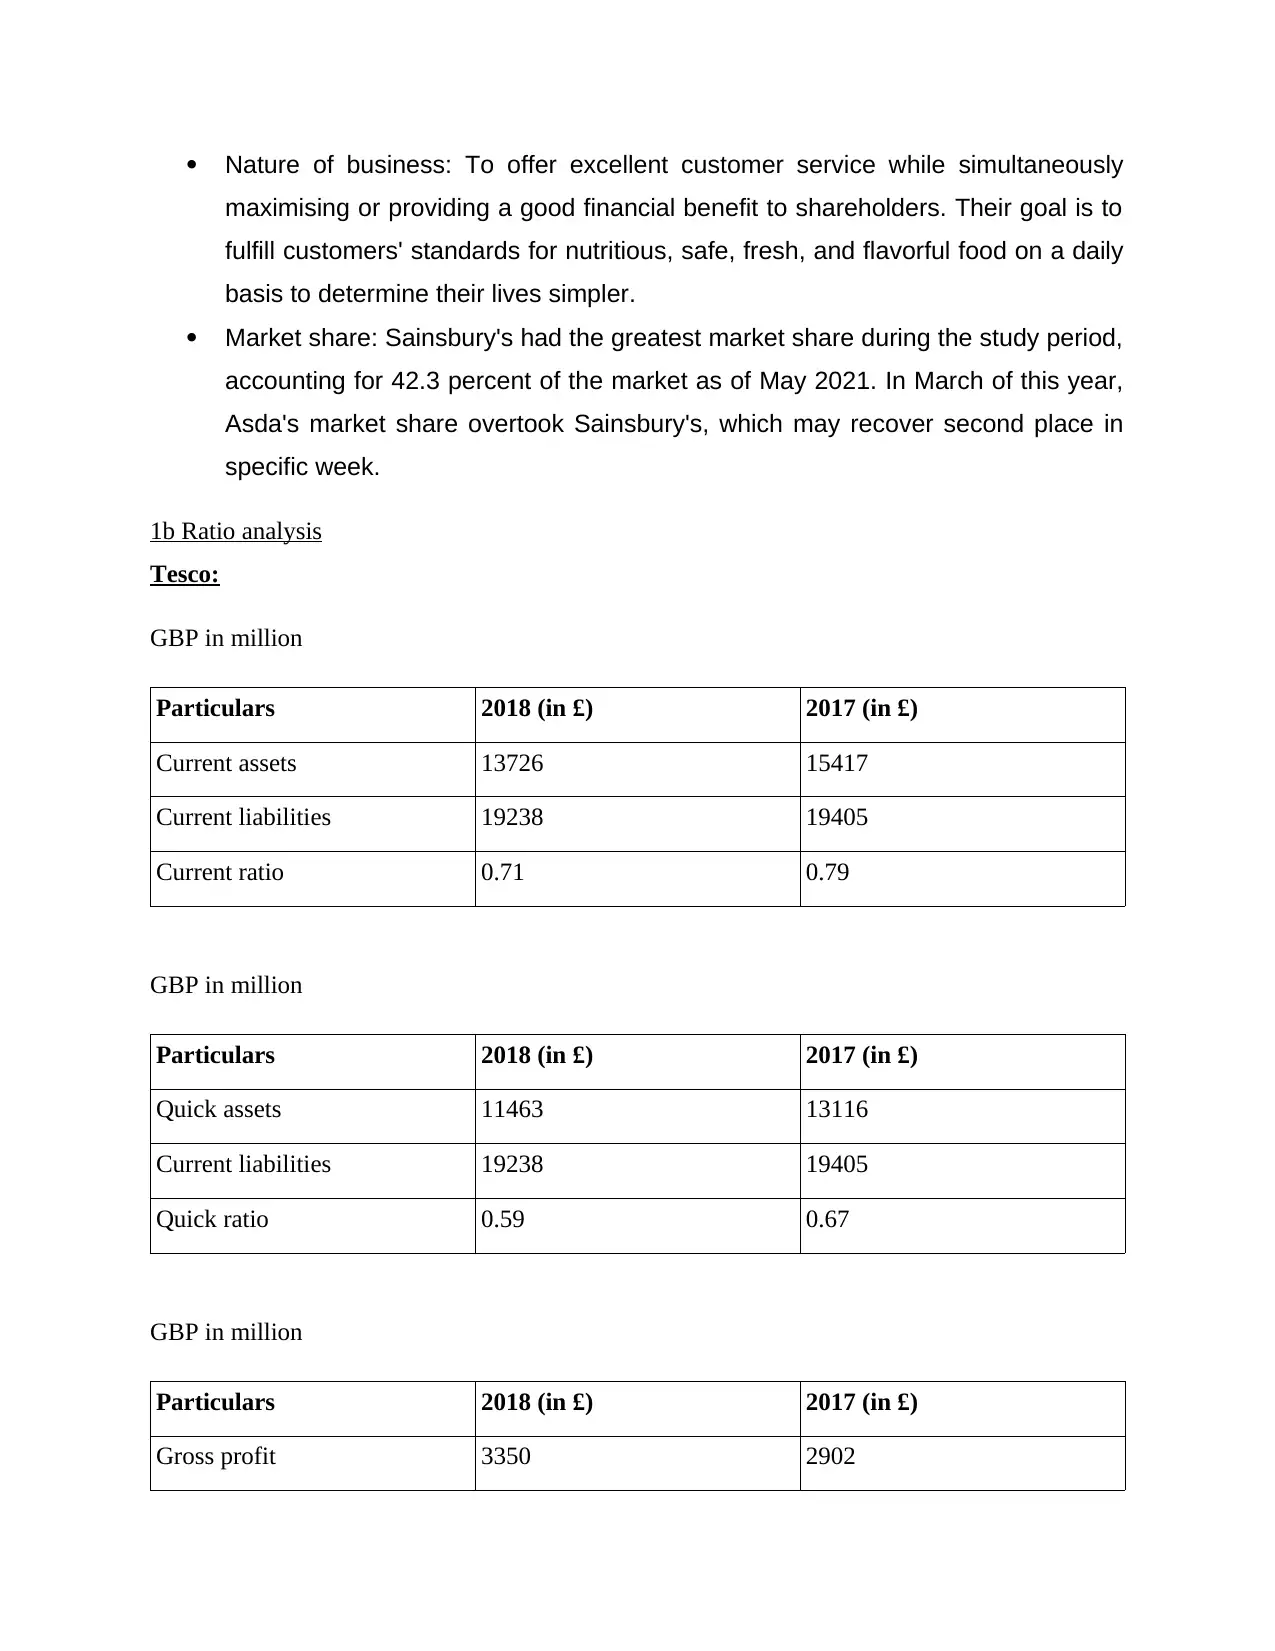
1b Ratio analysis
Tesco:
GBP in million
Particulars 2018 (in £) 2017 (in £)
Current assets 13726 15417
Current liabilities 19238 19405
Current ratio 0.71 0.79
GBP in million
Particulars 2018 (in £) 2017 (in £)
Quick assets 11463 13116
Current liabilities 19238 19405
Quick ratio 0.59 0.67
GBP in million
Particulars 2018 (in £) 2017 (in £)
Gross profit 3350 2902
maximising or providing a good financial benefit to shareholders. Their goal is to
fulfill customers' standards for nutritious, safe, fresh, and flavorful food on a daily
basis to determine their lives simpler.
Market share: Sainsbury's had the greatest market share during the study period,
accounting for 42.3 percent of the market as of May 2021. In March of this year,
Asda's market share overtook Sainsbury's, which may recover second place in
specific week.
1b Ratio analysis
Tesco:
GBP in million
Particulars 2018 (in £) 2017 (in £)
Current assets 13726 15417
Current liabilities 19238 19405
Current ratio 0.71 0.79
GBP in million
Particulars 2018 (in £) 2017 (in £)
Quick assets 11463 13116
Current liabilities 19238 19405
Quick ratio 0.59 0.67
GBP in million
Particulars 2018 (in £) 2017 (in £)
Gross profit 3350 2902
⊘ This is a preview!⊘
Do you want full access?
Subscribe today to unlock all pages.
Trusted by 1+ million students worldwide
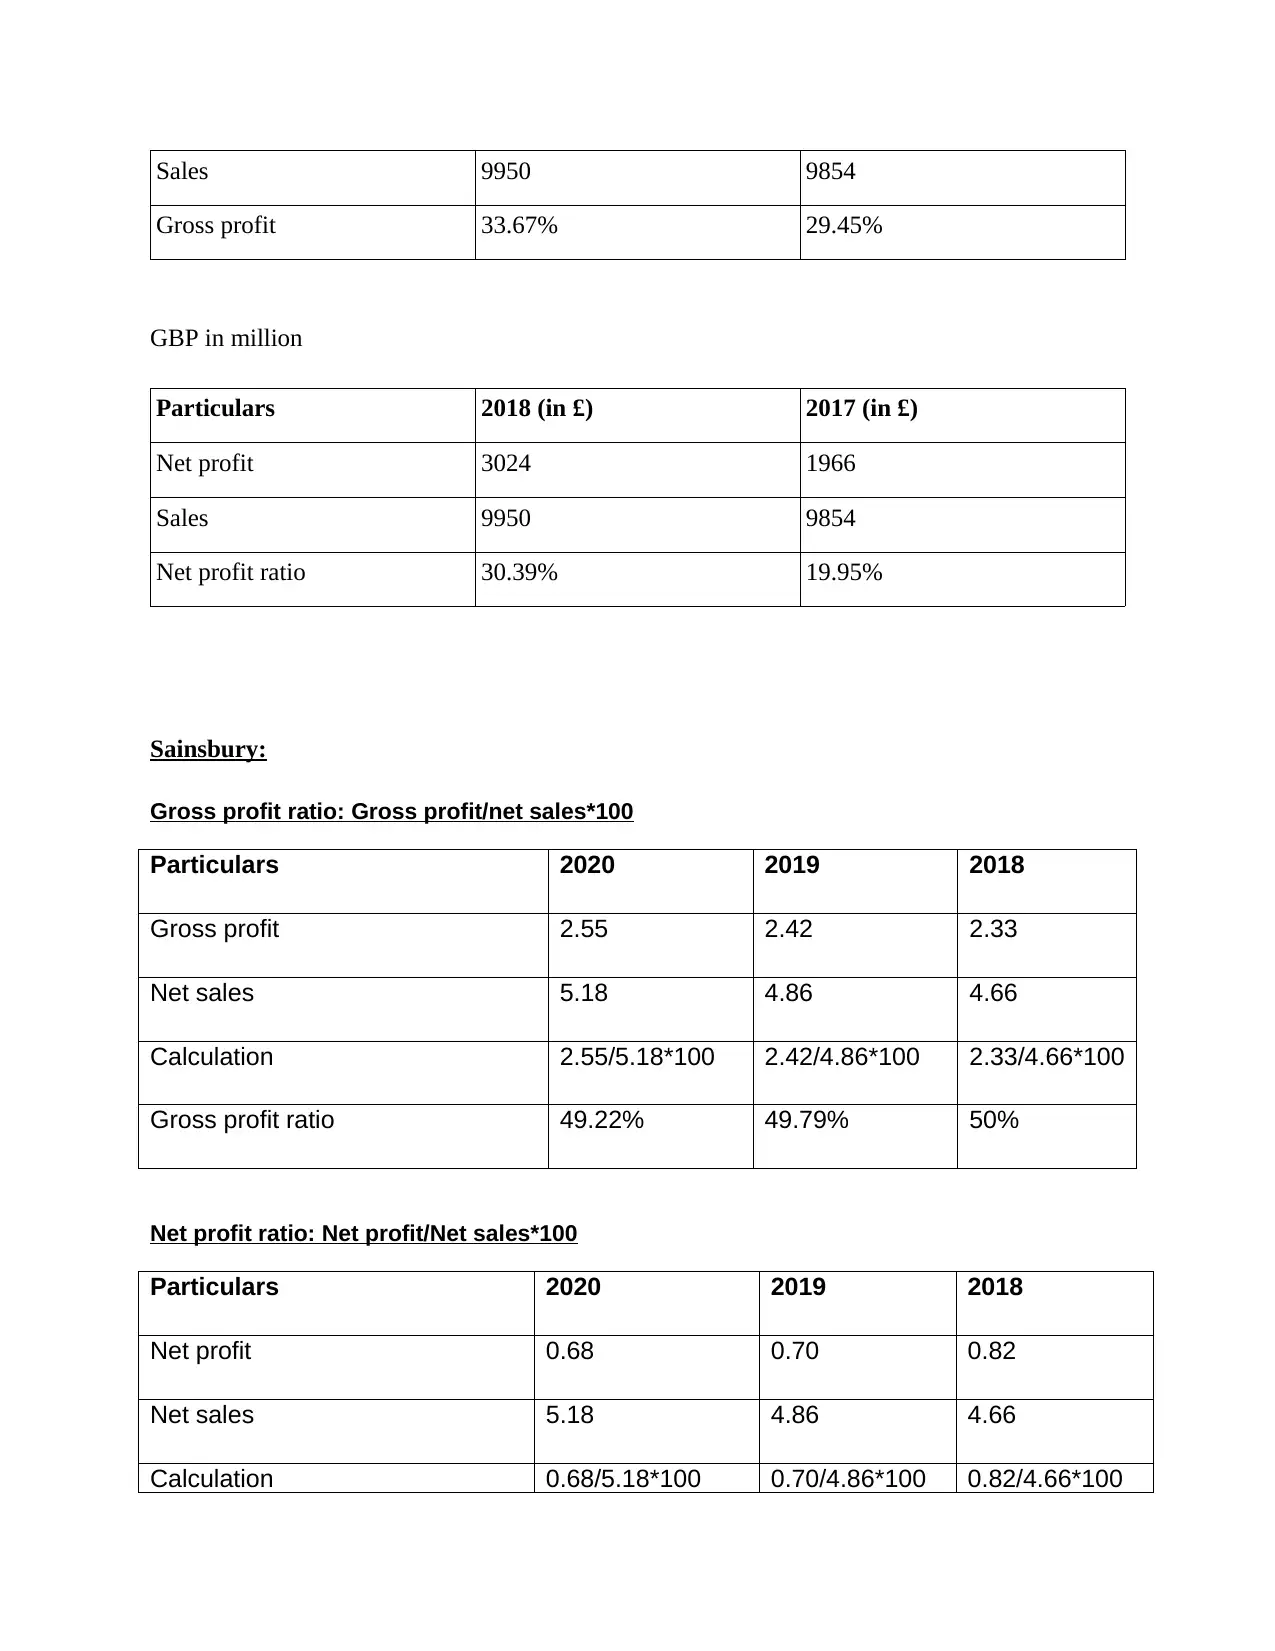
Sales 9950 9854
Gross profit 33.67% 29.45%
GBP in million
Particulars 2018 (in £) 2017 (in £)
Net profit 3024 1966
Sales 9950 9854
Net profit ratio 30.39% 19.95%
Sainsbury:
Gross profit ratio: Gross profit/net sales*100
Particulars 2020 2019 2018
Gross profit 2.55 2.42 2.33
Net sales 5.18 4.86 4.66
Calculation 2.55/5.18*100 2.42/4.86*100 2.33/4.66*100
Gross profit ratio 49.22% 49.79% 50%
Net profit ratio: Net profit/Net sales*100
Particulars 2020 2019 2018
Net profit 0.68 0.70 0.82
Net sales 5.18 4.86 4.66
Calculation 0.68/5.18*100 0.70/4.86*100 0.82/4.66*100
Paraphrase This Document
Need a fresh take? Get an instant paraphrase of this document with our AI Paraphraser
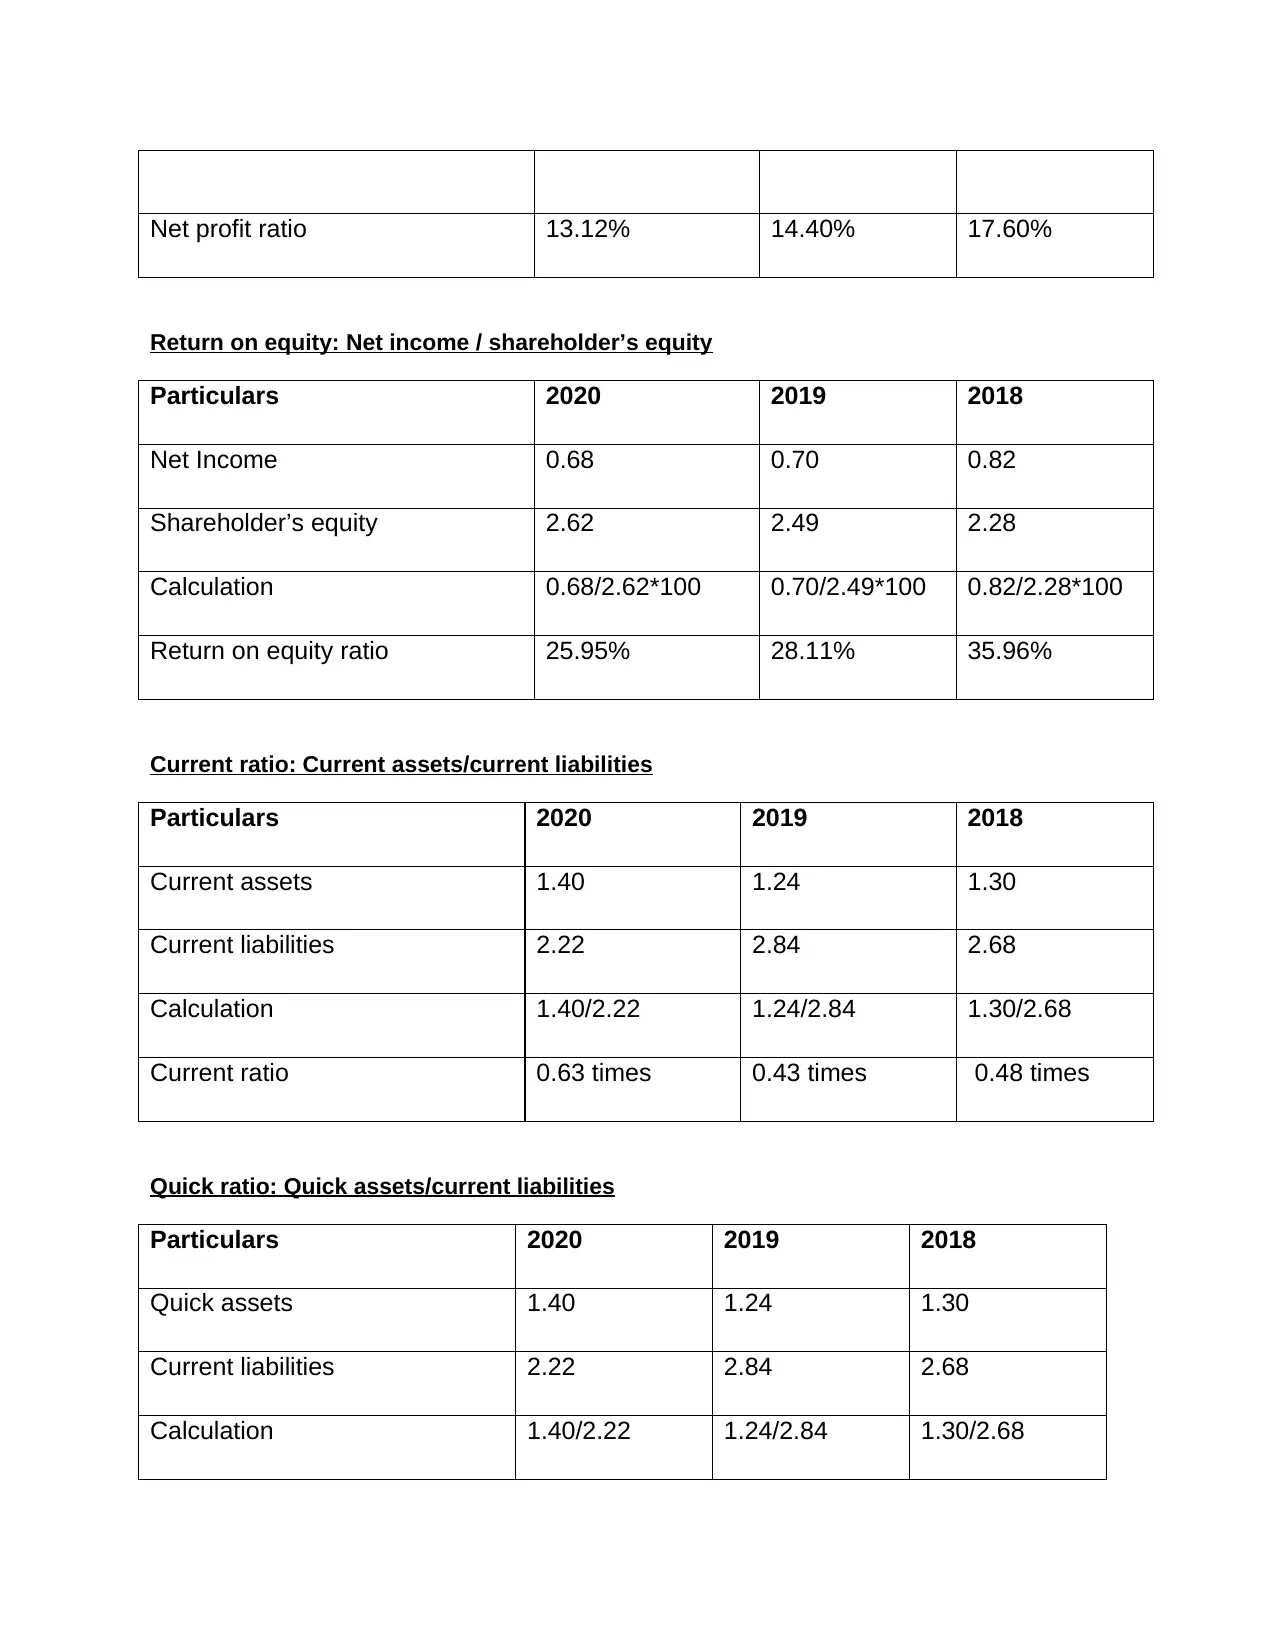
Net profit ratio 13.12% 14.40% 17.60%
Return on equity: Net income / shareholder’s equity
Particulars 2020 2019 2018
Net Income 0.68 0.70 0.82
Shareholder’s equity 2.62 2.49 2.28
Calculation 0.68/2.62*100 0.70/2.49*100 0.82/2.28*100
Return on equity ratio 25.95% 28.11% 35.96%
Current ratio: Current assets/current liabilities
Particulars 2020 2019 2018
Current assets 1.40 1.24 1.30
Current liabilities 2.22 2.84 2.68
Calculation 1.40/2.22 1.24/2.84 1.30/2.68
Current ratio 0.63 times 0.43 times 0.48 times
Quick ratio: Quick assets/current liabilities
Particulars 2020 2019 2018
Quick assets 1.40 1.24 1.30
Current liabilities 2.22 2.84 2.68
Calculation 1.40/2.22 1.24/2.84 1.30/2.68
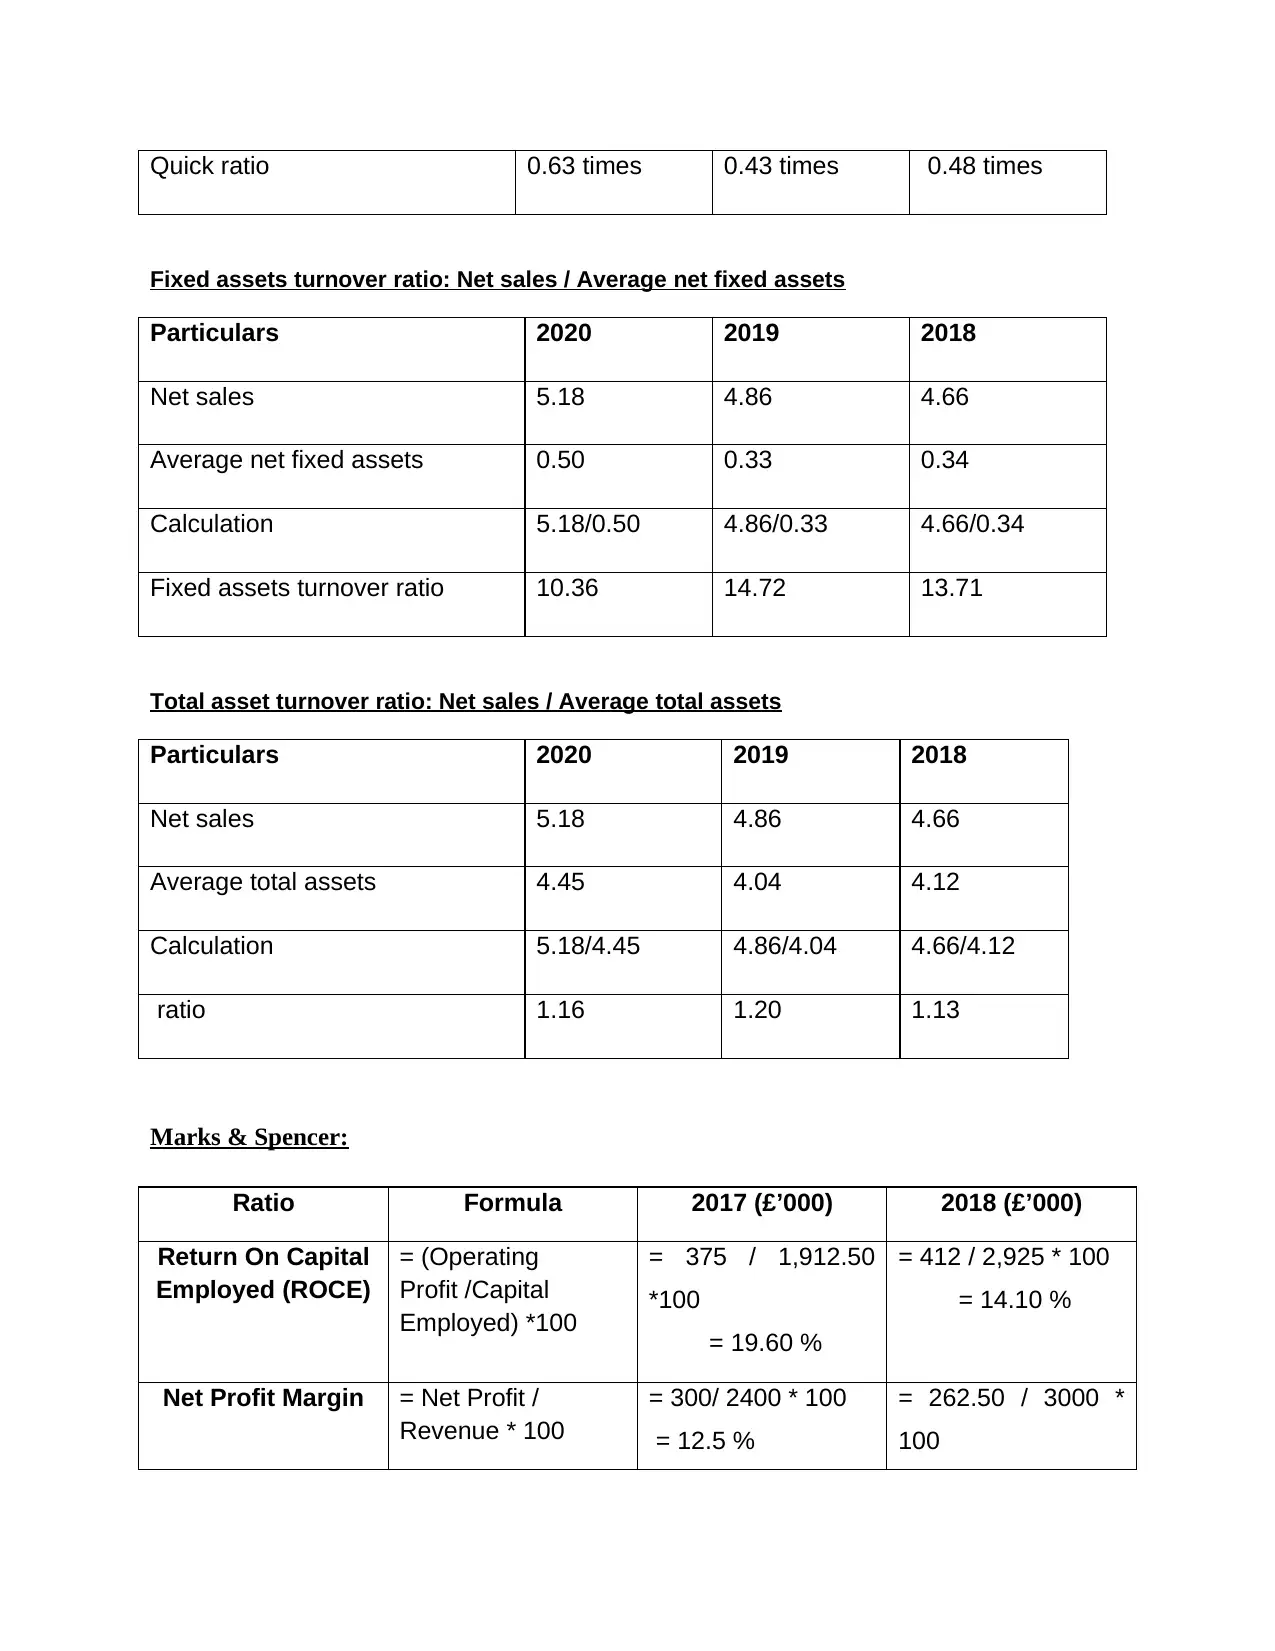
Quick ratio 0.63 times 0.43 times 0.48 times
Fixed assets turnover ratio: Net sales / Average net fixed assets
Particulars 2020 2019 2018
Net sales 5.18 4.86 4.66
Average net fixed assets 0.50 0.33 0.34
Calculation 5.18/0.50 4.86/0.33 4.66/0.34
Fixed assets turnover ratio 10.36 14.72 13.71
Total asset turnover ratio: Net sales / Average total assets
Particulars 2020 2019 2018
Net sales 5.18 4.86 4.66
Average total assets 4.45 4.04 4.12
Calculation 5.18/4.45 4.86/4.04 4.66/4.12
ratio 1.16 1.20 1.13
Marks & Spencer:
Ratio Formula 2017 (£’000) 2018 (£’000)
Return On Capital
Employed (ROCE)
= (Operating
Profit /Capital
Employed) *100
= 375 / 1,912.50
*100
= 19.60 %
= 412 / 2,925 * 100
= 14.10 %
Net Profit Margin = Net Profit /
Revenue * 100
= 300/ 2400 * 100
= 12.5 %
= 262.50 / 3000 *
100
⊘ This is a preview!⊘
Do you want full access?
Subscribe today to unlock all pages.
Trusted by 1+ million students worldwide
= 8.75 %
Current Ratio = Current Assets /
Current Liability
= 757.50 / 322.50
= 2.34 Times
= 1035 / 1110
= 0.93 Times
Debtor Collection
Period
= Receivable /
Sales *365
= 450 / 2400 * 365
= 68.43
= 68 Days
= 600 / 3000 * 365
= 73 Days
Creditor Collection
Period
= Payable /
Purchase * 365
= 285 / 1350 * 365
= 77.05
= 77 Days
= 1050 / 2400 * 365
= 159.68
= 160 Days
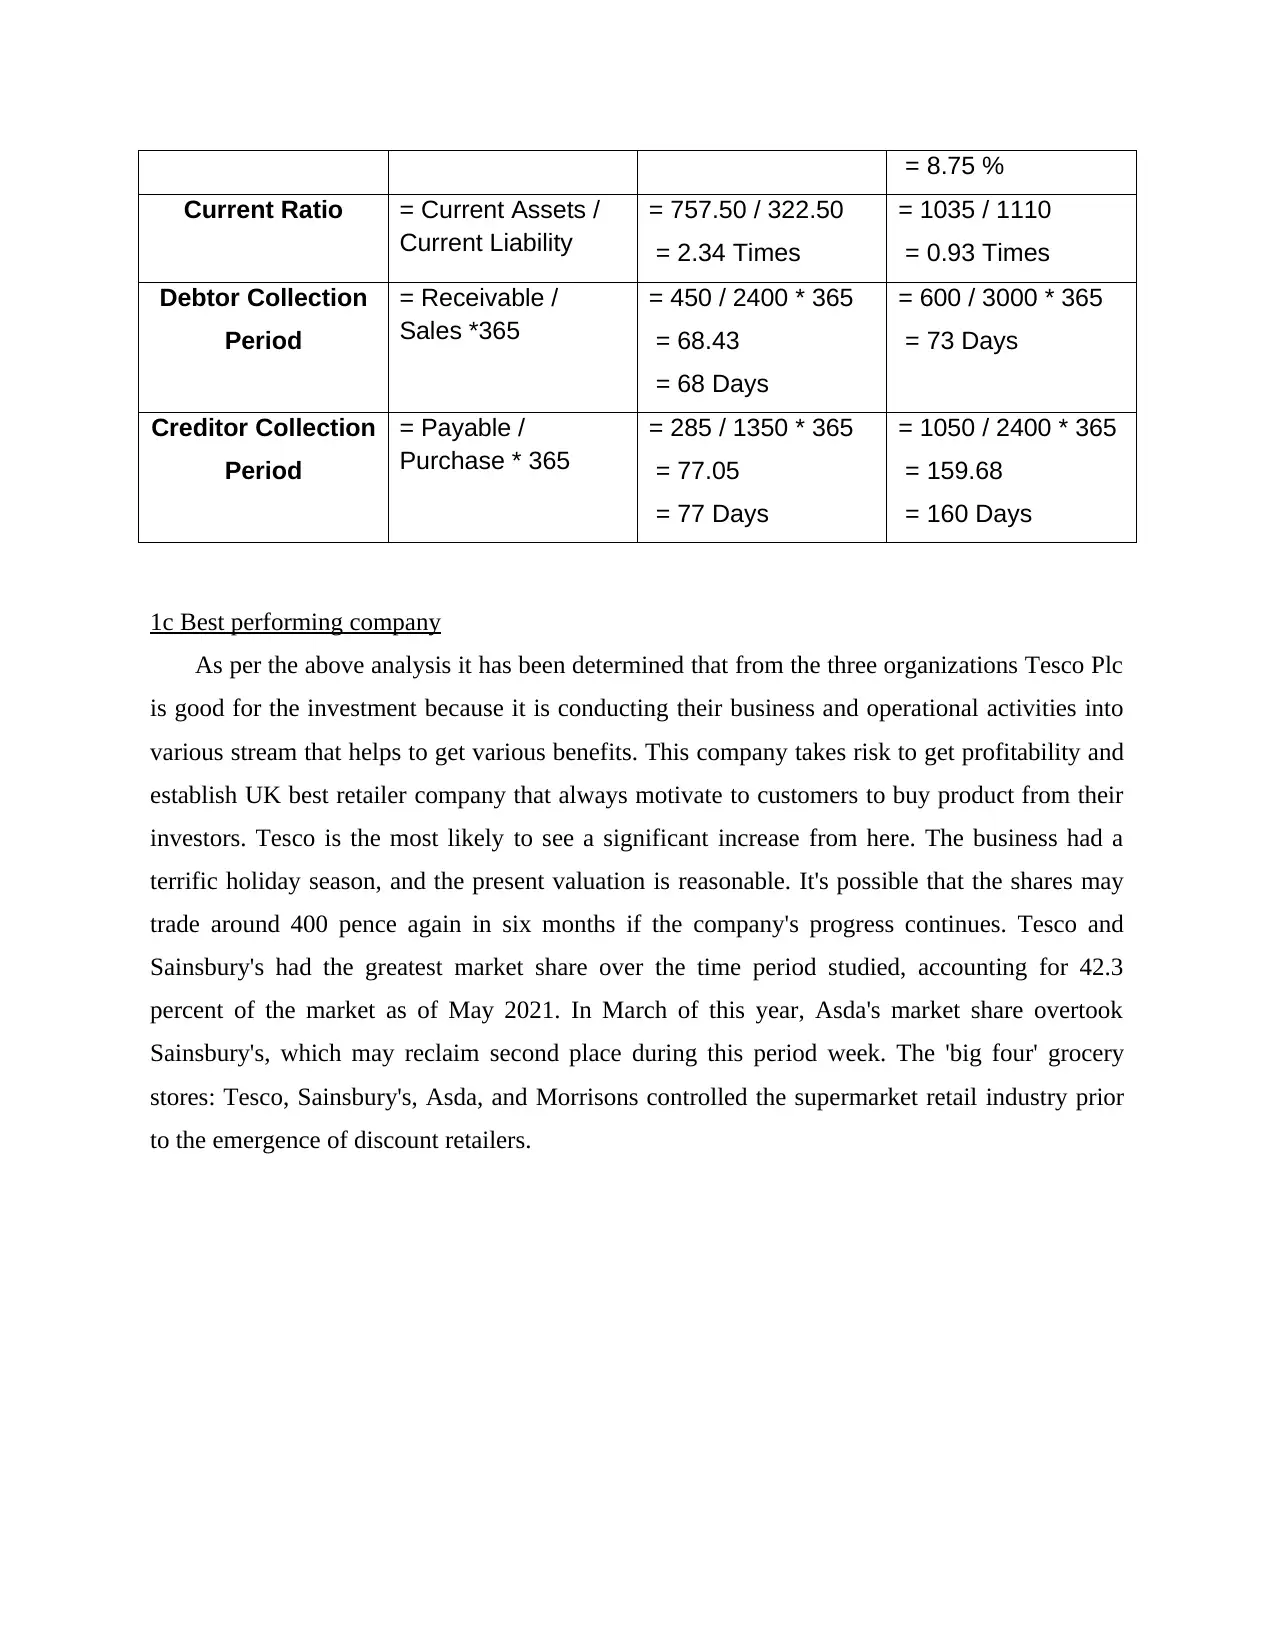
1c Best performing company
As per the above analysis it has been determined that from the three organizations Tesco Plc
is good for the investment because it is conducting their business and operational activities into
various stream that helps to get various benefits. This company takes risk to get profitability and
establish UK best retailer company that always motivate to customers to buy product from their
investors. Tesco is the most likely to see a significant increase from here. The business had a
terrific holiday season, and the present valuation is reasonable. It's possible that the shares may
trade around 400 pence again in six months if the company's progress continues. Tesco and
Sainsbury's had the greatest market share over the time period studied, accounting for 42.3
percent of the market as of May 2021. In March of this year, Asda's market share overtook
Sainsbury's, which may reclaim second place during this period week. The 'big four' grocery
stores: Tesco, Sainsbury's, Asda, and Morrisons controlled the supermarket retail industry prior
to the emergence of discount retailers.
Current Ratio = Current Assets /
Current Liability
= 757.50 / 322.50
= 2.34 Times
= 1035 / 1110
= 0.93 Times
Debtor Collection
Period
= Receivable /
Sales *365
= 450 / 2400 * 365
= 68.43
= 68 Days
= 600 / 3000 * 365
= 73 Days
Creditor Collection
Period
= Payable /
Purchase * 365
= 285 / 1350 * 365
= 77.05
= 77 Days
= 1050 / 2400 * 365
= 159.68
= 160 Days
1c Best performing company
As per the above analysis it has been determined that from the three organizations Tesco Plc
is good for the investment because it is conducting their business and operational activities into
various stream that helps to get various benefits. This company takes risk to get profitability and
establish UK best retailer company that always motivate to customers to buy product from their
investors. Tesco is the most likely to see a significant increase from here. The business had a
terrific holiday season, and the present valuation is reasonable. It's possible that the shares may
trade around 400 pence again in six months if the company's progress continues. Tesco and
Sainsbury's had the greatest market share over the time period studied, accounting for 42.3
percent of the market as of May 2021. In March of this year, Asda's market share overtook
Sainsbury's, which may reclaim second place during this period week. The 'big four' grocery
stores: Tesco, Sainsbury's, Asda, and Morrisons controlled the supermarket retail industry prior
to the emergence of discount retailers.
Paraphrase This Document
Need a fresh take? Get an instant paraphrase of this document with our AI Paraphraser
SECTION B
2a Main types of internal and external long-term finance available to listed companies
Internal long-term finance
Internal source of finance in its general sense refers to money that comes internally
within the business organisation. Such finance presented in business firm have its dimensions
towards procuring safe and secured source of funds to govern respective business operations.
Long term finance develops better standards before a given company to function with its best
efforts being produced in the organisational firm. In addition to this, various efforts being
produced in the corporate firm are being ensured with its proper direction of working. There are
variety of internal long-term finance sources available to all three corporate firm depending on
nature, size or dimensional scope of working are as follows (Park, Lee and Kim, 2020);
Sources of internal long term finance: Company 1 Owners capital: The respective managers at the corporate firm arranges long term
funds for the provided firm through basic owner capital. Such type of internal long term
source of finance for the given company is considered to me most secured and easy to
access reflecting on a given situation of a workplace. Retained profits: Such source refers to profits which can be utilised in future to its best
use when required. In these source reserves are being made by financial department of
the respective firm and are utilised in the firm of internal long term finance for the
respective firm (Geels, 2019).
Sources of internal long term finance: Company 2 Selling asset: The given source of finance can be acquired in a given firm after seeking
of a given asset for the business firm. Such source can prove to reliable, however, it can
also create negative impact over effective or productive working of the corporate firm
seeking to a given price situation in its working environment. Partner's capital: Such type of funds can be acquired through partners in a given firm.
Respective source is treated as safest mechanism to acquire financial resources fo
performing specific task in given business organisation.
Sources of internal long term finance: Company 3 Debt collection: Such sources of internal long term finance in the provided company
can be acquired through collection of debt from several debtors of the given company.
This enables corporate firm to develop better standards of working in terms of attainment
of desired goals and objectives.
Personal investment: Given source of fund can be acquired through withdrawing
personal savings of director or owner of a company in form of internal long term finance
when required (Moon and et. al., 2019).
External long term finance
Such type of finance category is acquired through external sources for a given company
to ensure better effectiveness of long term operations of the corporate firm. For the presented
scenario sources of external long term finance for three companies chosen are as follows;
Sources of external long term finance: Company 1 Share capital: This type of external long term finance in the given company is acquired
through presenting company's share in open market operations. These small units i.e.
share all together form basis of total share capital and is considered to be an effective
long term financial source for the provided company. Debenture: Such source of funds can be related to share capital but the policies or
terms and condition for the same have some differentiation (Loxley, 2019).
Sources of external long term finance: Company 2
⊘ This is a preview!⊘
Do you want full access?
Subscribe today to unlock all pages.
Trusted by 1+ million students worldwide
1 out of 16
Related Documents


Your All-in-One AI-Powered Toolkit for Academic Success.
+13062052269
info@desklib.com
Available 24*7 on WhatsApp / Email
![[object Object]](/_next/static/media/star-bottom.7253800d.svg)
Unlock your academic potential
Copyright © 2020–2026 A2Z Services. All Rights Reserved. Developed and managed by ZUCOL.