Financial Analysis of Tesla Inc. for Stock Market Investment
VerifiedAdded on 2022/02/21
|18
|6562
|12
Report
AI Summary
This report offers a detailed financial analysis of Tesla Inc., focusing on its potential for stock market investment. It begins with a critical analysis of financial ratios, explaining their significance in evaluating a company's performance and their use in assessing Tesla's financial health. The report then delves into Tesla's economic and financial significance, highlighting its impact on the automobile industry, technological advancements, and market disruption. It examines the company's financial statements, including the balance sheet, income statement, and cash flow statement, using horizontal and vertical analysis to assess trends and the structure of its assets and liabilities. The analysis considers various factors such as leadership quality, market dynamics, and the shift towards electric vehicles. The report also addresses the risks associated with investing in Tesla's stock and suggests key strategies to mitigate these risks, providing a comprehensive overview for potential investors.

Accounting and Financial Management
Topic: Financial analysis of Tesla Inc.’ for stock market investment
Word Count: 3286
Topic: Financial analysis of Tesla Inc.’ for stock market investment
Word Count: 3286
Paraphrase This Document
Need a fresh take? Get an instant paraphrase of this document with our AI Paraphraser
Table of Contents
Part 1 – Critical Analysis of Financial Ratios................................................................................................... 3
Part 2 – Financial Analysis of Tesla Inc........................................................................................................... 4
- Economic significance...............................................................................................................................4
- Financial significance.................................................................................................................................5
- Other factors of consideration for Tesla....................................................................................................5
Analysis of Financial Ratios........................................................................................................................... 6
Risk level of Tesla’s stock for investors.......................................................................................................... 9
Key strategies to use to minimize these perceived risks.................................................................................9
Conclusion.................................................................................................................................................... 9
References.................................................................................................................................................. 11
Appendices................................................................................................................................................. 12
2
Part 1 – Critical Analysis of Financial Ratios
The primary aim of financial reporting is to provide information about the financial position
and performance of companies provided by numbers disclosed in financial statements
which acts as a guide for their decisions (Watts, 1977). Accounting information is used to
evaluate and forecast the profitability, equity growth, cash flow and dividends of
corporates’ economic and subsequent decisions, relying on data arising out of financial
statements or its components.
Financial ratios are the oldest and simplest practical tools in evaluating and planning
companies’ performance (Arkan, 2016). It appeared in the mid nineteenth century and was
always used by accountants and financial analysts. Financial ratios were used by internal
and external users for making their economic decisions including investing and performance
evaluation decisions. Many financial and accounting models have been developed over the
past few decades; however, financial ratios are still used for its classical and fundamental
power as models for financial and planning analysis.
One of the main factors that investors monitor when looking for opportunities to invest
additional resources is to give special attention to “stock price”. The use of accounting data
and financial ratios to explain changes in stock prices is frequently referred to in the
literature Using a financial ratio analysis can be largely attributed to changes in stock prices
and has often been discussed by academics and financial analysts (Arkan, 2016).
The main advantage of using financial ratios instead of amounts from the income statement
is that they are independent of the size of the company. The comparison of financial ratios is
used to assess companies’ financial condition, operations, and attractiveness as an
investment, without the need to provide some financial details.
Matar (2010) defines financial analysis as “a process by which exploration or derivation
group of quantitative and qualitative indicators of economic activity around the project
contributes to determine the significance of the properties of the activities of the operations
and financial position, in order to use these indicators in assessing the performance of the
companies with a view to making decisions”.
When analysing the financial statements of companies, many financial ratios could be used,
these ratios can be divided into several groups and each group studies a certain
phenomenon depending on the intended purpose of the financial analysis for example,
short-term debt holders focusing on the study of specific percentages differ from the ratios
that are focused on and studied by owners’ Long-term debt. Financial ratios are divided into
five categories that all highlight different aspects of a company’s financial and operational
performance to measure liquidity, profitability, debt, operating and investment valuation
(Brigham and Gapenski, 1997).
Though ratio analysis is a very useful financial tool, it does not consider the economic
context in which the firm has been operating in. Furthermore, ratios may be distorted
because they are based on period-end figures (Elliot, 2019), which are fixed and may not
display an accurate representation of the entire business, especially if it is seasonal.
3
⊘ This is a preview!⊘
Do you want full access?
Subscribe today to unlock all pages.
Trusted by 1+ million students worldwide
However, ratios can be used in conjunction with formulae, to give a more holistic view of
the performance of firm, since they can show a one-sided view.
Part 2 – Financial Analysis of Tesla Inc.
This report discusses a potential investment opportunity for a growth-oriented client
inclined towards the automobile stock market in the United States. The company chosen for
the client is Tesla Motors, Inc. The investor will seek to optimize the long-term potential for
price growth based on its principal. Tesla's stock price is subject to price changes, which the
investor must accept while ignoring all the squeak and noise (Vanguard Group Inc., 2021).
This report analyses Tesla’s stock potential for growth, total returns, price volatility and
financial position for an investor that notably possesses a long-term investment plan.
Tesla Motors, Inc. is the first fully electric car company, and is widely regarded as
remarkable, due to consumer enthusiasm for its sports utility vehicles, sedans, and solar
energy storage systems. They design, develop, manufacture, and distribute high-end electric
automobiles and solar energy storage products in the United States, Europe, China, and
other global markets. Electric sedans and sports utility vehicles are the company's
mainstays.
- Economic significance
Hayes (2020) defines business valuation as “a general process of determining the economic
value of a whole business or company unit. Tesla is a corporation with cutting-edge products
and technologies that have the potential to disrupt large segments of the economy and
boost US economic growth for decades, thus proving to have had a significant impact on the
automobile industry. It has established sales channels with no distributors, as well as
breakthrough technology such as solar energy storage, all have deeper implications for both
the energy and transport sectors.
The firm is poised for growth, as will be seen in the stock analysis later in this report. The
current known nature of Tesla makes it vital for the economy in specific areas related to
employment and inflation, and therefore, of interest to any investors. Tesla has automated
most of its manufacturing processes to save costs on human labour (Hawkins, 2018).
Tesla has significantly embraced new technologies to reduce the overall headcount in the
factory – a move that has suppressed growth in wages. This approach has assisted the
company to mitigate issues associated with skyrocketing labour costs and other
uncompetitive labour practices. Consequently, allowing it to save significantly on employee
compensation and benefits.
Further, Tesla has embarked on disrupting the traditional model of a car dealership by
focusing on online car sales, few showrooms, and almost no advertisement expenses. Tesla
is an exemplar of technological realization and its disruption in economies. Although the
company has a smaller production number relative to gasoline-fuelled cars, the company’s
production capacity is expected to rise each year as demand increases.
4
Paraphrase This Document
Need a fresh take? Get an instant paraphrase of this document with our AI Paraphraser
Keen analysts and investors have noted that the number of electric cars on the road in the
US will reach five percent by the year 2025. This project will ultimately shift oil consumption
in the US leading to a decline in oil demand. The demand reduction would be attributed to
the significant number of electric vehicles on the road, leading to low oil prices, allowing
Tesla to influence the economy significantly.
- Financial significance
To make informed management decisions, inflationary adjustment of financial reporting
data is necessary, which is the basis for financial decisions and to justify investment projects
for the acquisition and development of a business, the company management must have
the information about the value of the entire enterprise or part of its assets (Konchitchki,
2011). Current financial reports indicate that Tesla is a loss-making firm and is not likely to
be profitable until the end of the decade. Nevertheless, the company has continued to
realize increased revenues because of year-over-year growing demands and sales.
Tesla does not pay its investors dividend, it instead focuses on enhanced investment in
research and development (R&D) to revamp its autopilot technologies, longer battery lives,
and introduce new advanced models at affordable prices. The continued investment shows
that Tesla executives have better growth opportunities to invest earnings and shareholders’
funds. To this end, the financial significance of the company to the economy or investors is
negligible, but it continues to shape the investment in R&D.
Relative to competitors, Tesla appreciates that its rivals have greater financial, marketing,
manufacturing, and technical resources, which they can use to facilitate the production,
sales, and promotions of new cars. Moreover, the company lacks massive financial
resources generated from revenues because of less extensive customer bases and industry
relations, limited operating history, and inordinate name recognition.
Tesla stock is, therefore, suitable for the patient and long-term investors. According to
experts, Tesla stock offers an important opportunity for investors who are keen and can
absorb some risks because it is one of the best long-term stocks currently available (Gurdus,
2021). It also noted that the company has gained about 500% in share price since its IPO in
2010. That is, its IPO at $17 per share in June 2010 had achieved a maximum of $280 per
share in 2014.
- Other factors of consideration for Tesla
The quality of leadership in Tesla is interesting, as Elon Musk is now considered the most
innovative, futurist CEO on earth with his ability to identify values that others fail to
recognize. His innovation on cars, lithium-ion batteries, solar, and innovative business
models have all shaped Tesla’s entrepreneurship. The home battery, for example, is meant
for everyday use to allow owners to store energy and use during high-cost tariffs. The use of
direct sales ensures that Tesla can maintain the required inventory around while
simultaneously eliminating dealers with diverse business agendas (D’Allegro, 2015).
Ultimately, the company cannot go wrong with such approaches.
5
Further, the decline in prices of gasoline should not be a factor of concern for investors
because the shift toward electric cars is not driven by gasoline prices. Instead, it is a general
shift, which promotes environmental conservation. It is expected that by the year 2025,
there would be more Tesla cars on the road than imagined (D’Allegro, 2015). Therefore,
Tesla’s stock price will continue to improve as revenues rise, making it a good bet the
investors.
Analysis of Financial Ratios
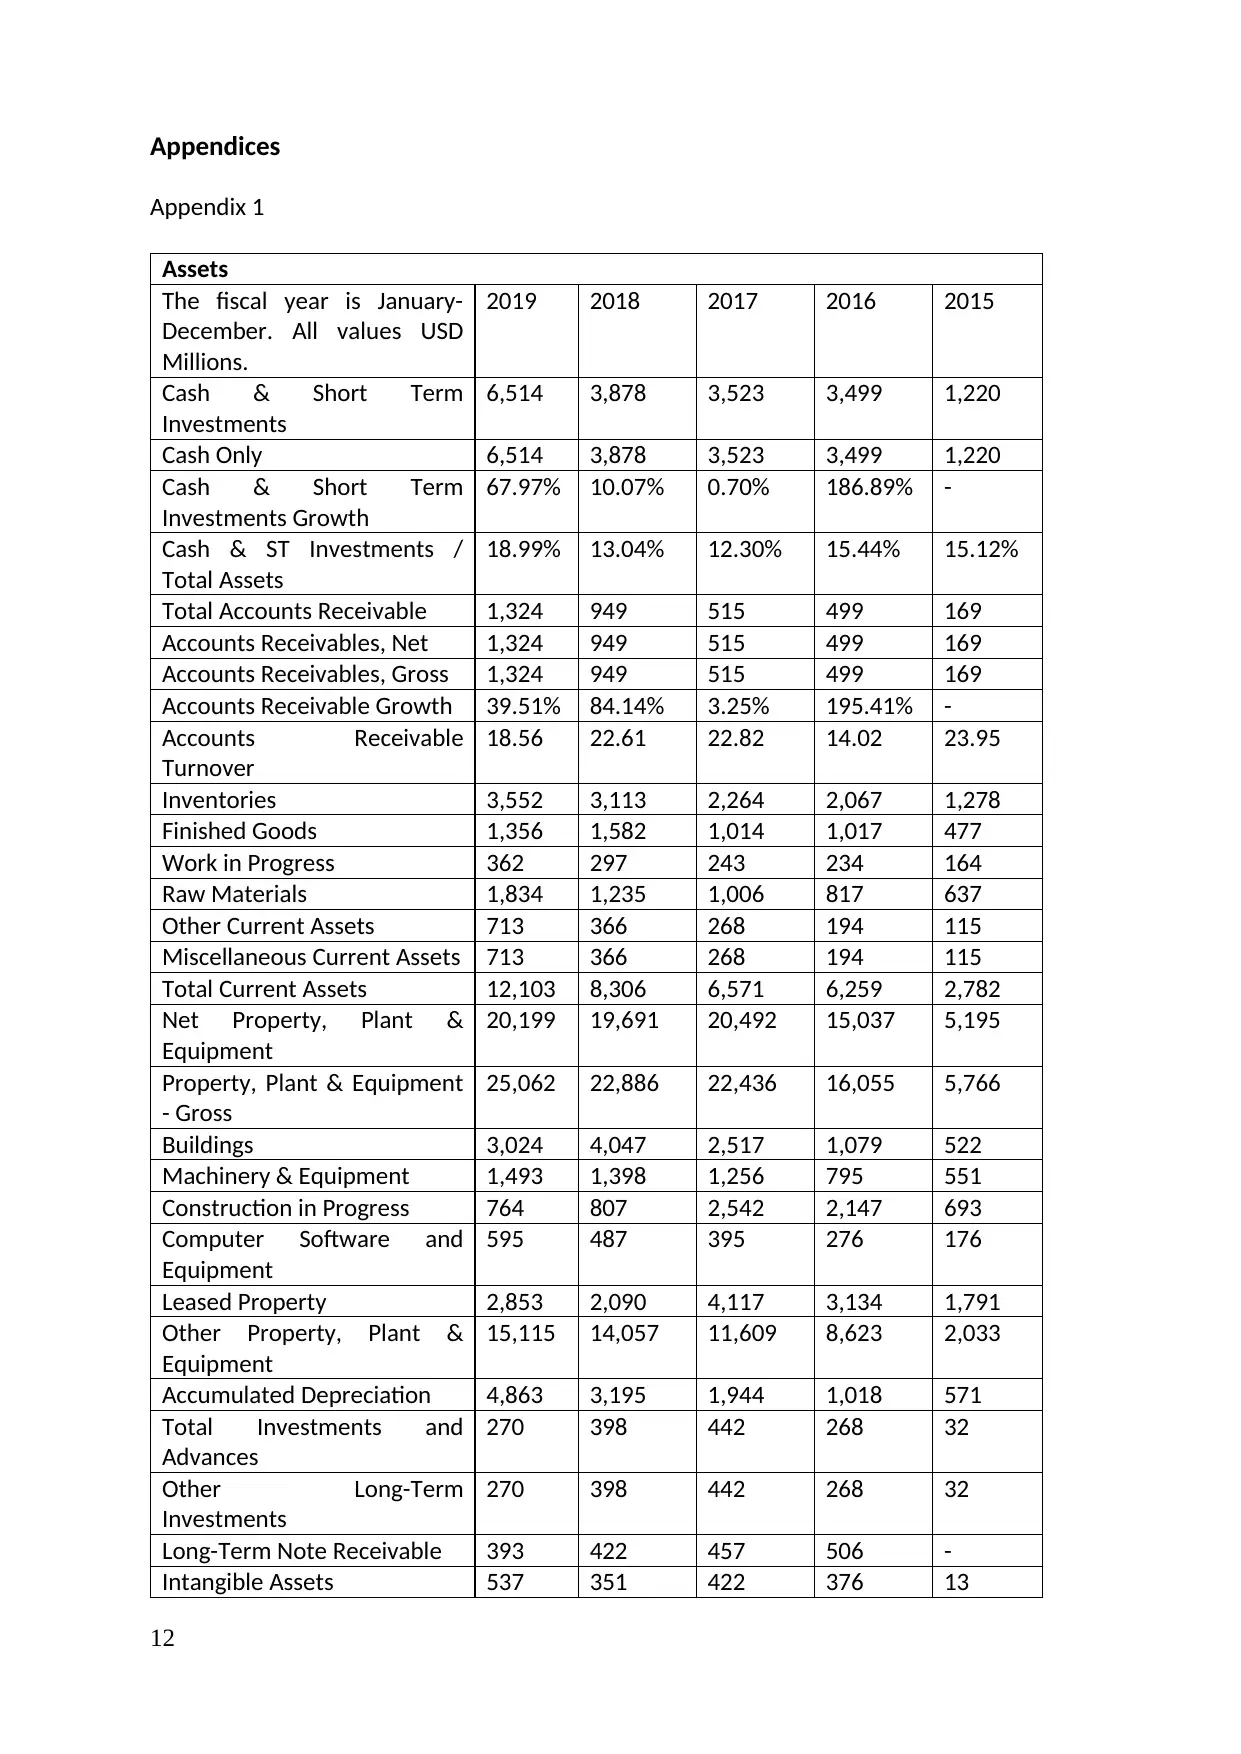
The financial statements of Tesla Inc. are presented in appendix 1. The financial statements
considered within this analysis are; the balance sheet of the company, income statement,
and cash flow statement.
Horizontal analysis (analysis of growth and trends) of the main lines of the balance sheet of
Tesla Inc. is shown in table 1 in appendix 2. It can be seen that the assets of Tesla Inc. have
been continuously growing for the last five years: the major growth is recorded in 2016,
compared to 2015 figures (181%). It is also evident that the current assets of the company
have been growing every year from 2015. Looking at the net property, plant, and
equipment, it can be noted that its value has grown by 189% in 2016, in 2017 the growth
slowed to just over 36% and the value of net property plant and equipment in 2019 stayed
almost the same as in 2017.
The consistent growth of total liabilities is evident for the last five years. Looking at the
common equity it can be noted that it grew by 338% in 2016, dropped by negative 10% in
2017, and grew again in 2018 and 2019 by 16% and 34% respectively. However, it can also
be seen that the retained earnings of the company have been negative for the last five years
and the negative figure is becoming larger, reaching USD 6,083 million in 2019, which is just
under the total value of the common equity of Tesla Inc. (USD 6,618 millions) as can be seen
in the balance sheet of the company shown in appendix 1. This means that the company
achieves the positive value of its common equity by the constant inflow of external
investment at the amount almost double of the value of the common equity every year for
the last five years, to maintain the perceived value of Tesla Inc. on the books, which is also
evident from the company balance sheet (see appendix 1).
It is also important to assess the structure of the main lines of the balance sheet of Tesla
Inc., using vertical analysis (see table 2 in appendix 2). It can be seen that the largest share
of the company’s assets is property, plant, and equipment – non-current assets, which take
59% of assets in 2019. However, it can also be seen that its share has been becoming
smaller for the last five years. Current assets make up about a third of the company’s assets
for the last five years.
Assess the liabilities, it can be seen that the total company debt in 2019 was over 76% of
company total liabilities and equity, which is a reduction from 87% in 2015, but still a very
large number. It is also evident that yearly inflows of external investments make up the
value of about a third of the company’s assets.
6
because the shift toward electric cars is not driven by gasoline prices. Instead, it is a general
shift, which promotes environmental conservation. It is expected that by the year 2025,
there would be more Tesla cars on the road than imagined (D’Allegro, 2015). Therefore,
Tesla’s stock price will continue to improve as revenues rise, making it a good bet the
investors.
Analysis of Financial Ratios
The financial statements of Tesla Inc. are presented in appendix 1. The financial statements
considered within this analysis are; the balance sheet of the company, income statement,
and cash flow statement.
Horizontal analysis (analysis of growth and trends) of the main lines of the balance sheet of
Tesla Inc. is shown in table 1 in appendix 2. It can be seen that the assets of Tesla Inc. have
been continuously growing for the last five years: the major growth is recorded in 2016,
compared to 2015 figures (181%). It is also evident that the current assets of the company
have been growing every year from 2015. Looking at the net property, plant, and
equipment, it can be noted that its value has grown by 189% in 2016, in 2017 the growth
slowed to just over 36% and the value of net property plant and equipment in 2019 stayed
almost the same as in 2017.
The consistent growth of total liabilities is evident for the last five years. Looking at the
common equity it can be noted that it grew by 338% in 2016, dropped by negative 10% in
2017, and grew again in 2018 and 2019 by 16% and 34% respectively. However, it can also
be seen that the retained earnings of the company have been negative for the last five years
and the negative figure is becoming larger, reaching USD 6,083 million in 2019, which is just
under the total value of the common equity of Tesla Inc. (USD 6,618 millions) as can be seen
in the balance sheet of the company shown in appendix 1. This means that the company
achieves the positive value of its common equity by the constant inflow of external
investment at the amount almost double of the value of the common equity every year for
the last five years, to maintain the perceived value of Tesla Inc. on the books, which is also
evident from the company balance sheet (see appendix 1).
It is also important to assess the structure of the main lines of the balance sheet of Tesla
Inc., using vertical analysis (see table 2 in appendix 2). It can be seen that the largest share
of the company’s assets is property, plant, and equipment – non-current assets, which take
59% of assets in 2019. However, it can also be seen that its share has been becoming
smaller for the last five years. Current assets make up about a third of the company’s assets
for the last five years.
Assess the liabilities, it can be seen that the total company debt in 2019 was over 76% of
company total liabilities and equity, which is a reduction from 87% in 2015, but still a very
large number. It is also evident that yearly inflows of external investments make up the
value of about a third of the company’s assets.
6
⊘ This is a preview!⊘
Do you want full access?
Subscribe today to unlock all pages.
Trusted by 1+ million students worldwide
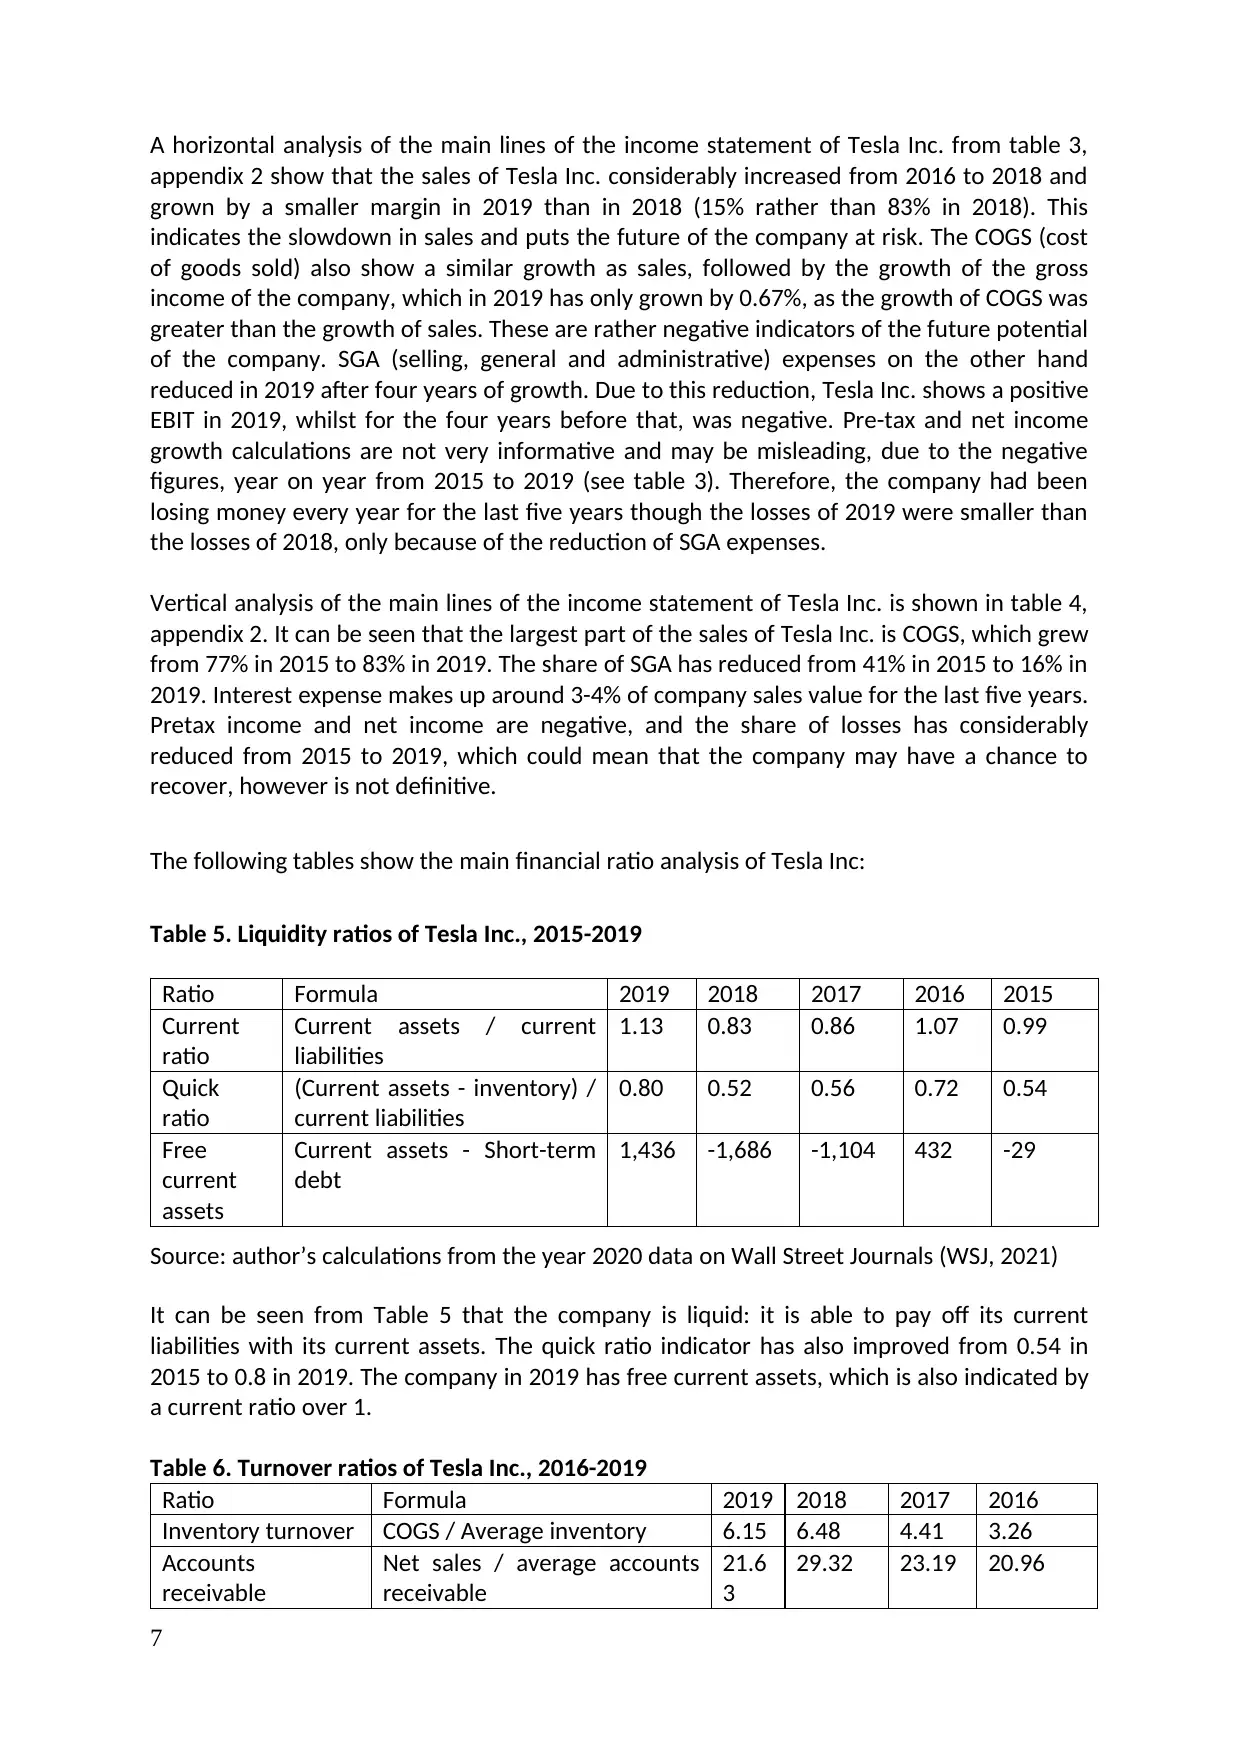
A horizontal analysis of the main lines of the income statement of Tesla Inc. from table 3,
appendix 2 show that the sales of Tesla Inc. considerably increased from 2016 to 2018 and
grown by a smaller margin in 2019 than in 2018 (15% rather than 83% in 2018). This
indicates the slowdown in sales and puts the future of the company at risk. The COGS (cost
of goods sold) also show a similar growth as sales, followed by the growth of the gross
income of the company, which in 2019 has only grown by 0.67%, as the growth of COGS was
greater than the growth of sales. These are rather negative indicators of the future potential
of the company. SGA (selling, general and administrative) expenses on the other hand
reduced in 2019 after four years of growth. Due to this reduction, Tesla Inc. shows a positive
EBIT in 2019, whilst for the four years before that, was negative. Pre-tax and net income
growth calculations are not very informative and may be misleading, due to the negative
figures, year on year from 2015 to 2019 (see table 3). Therefore, the company had been
losing money every year for the last five years though the losses of 2019 were smaller than
the losses of 2018, only because of the reduction of SGA expenses.
Vertical analysis of the main lines of the income statement of Tesla Inc. is shown in table 4,
appendix 2. It can be seen that the largest part of the sales of Tesla Inc. is COGS, which grew
from 77% in 2015 to 83% in 2019. The share of SGA has reduced from 41% in 2015 to 16% in
2019. Interest expense makes up around 3-4% of company sales value for the last five years.
Pretax income and net income are negative, and the share of losses has considerably
reduced from 2015 to 2019, which could mean that the company may have a chance to
recover, however is not definitive.
The following tables show the main financial ratio analysis of Tesla Inc:
Table 5. Liquidity ratios of Tesla Inc., 2015-2019
Ratio Formula 2019 2018 2017 2016 2015
Current
ratio
Current assets / current
liabilities
1.13 0.83 0.86 1.07 0.99
Quick
ratio
(Current assets - inventory) /
current liabilities
0.80 0.52 0.56 0.72 0.54
Free
current
assets
Current assets - Short-term
debt
1,436 -1,686 -1,104 432 -29
Source: author’s calculations from the year 2020 data on Wall Street Journals (WSJ, 2021)
It can be seen from Table 5 that the company is liquid: it is able to pay off its current
liabilities with its current assets. The quick ratio indicator has also improved from 0.54 in
2015 to 0.8 in 2019. The company in 2019 has free current assets, which is also indicated by
a current ratio over 1.
Table 6. Turnover ratios of Tesla Inc., 2016-2019
Ratio Formula 2019 2018 2017 2016
Inventory turnover COGS / Average inventory 6.15 6.48 4.41 3.26
Accounts
receivable
Net sales / average accounts
receivable
21.6
3
29.32 23.19 20.96
7
Paraphrase This Document
Need a fresh take? Get an instant paraphrase of this document with our AI Paraphraser
turnover
Assets turnover
ratio
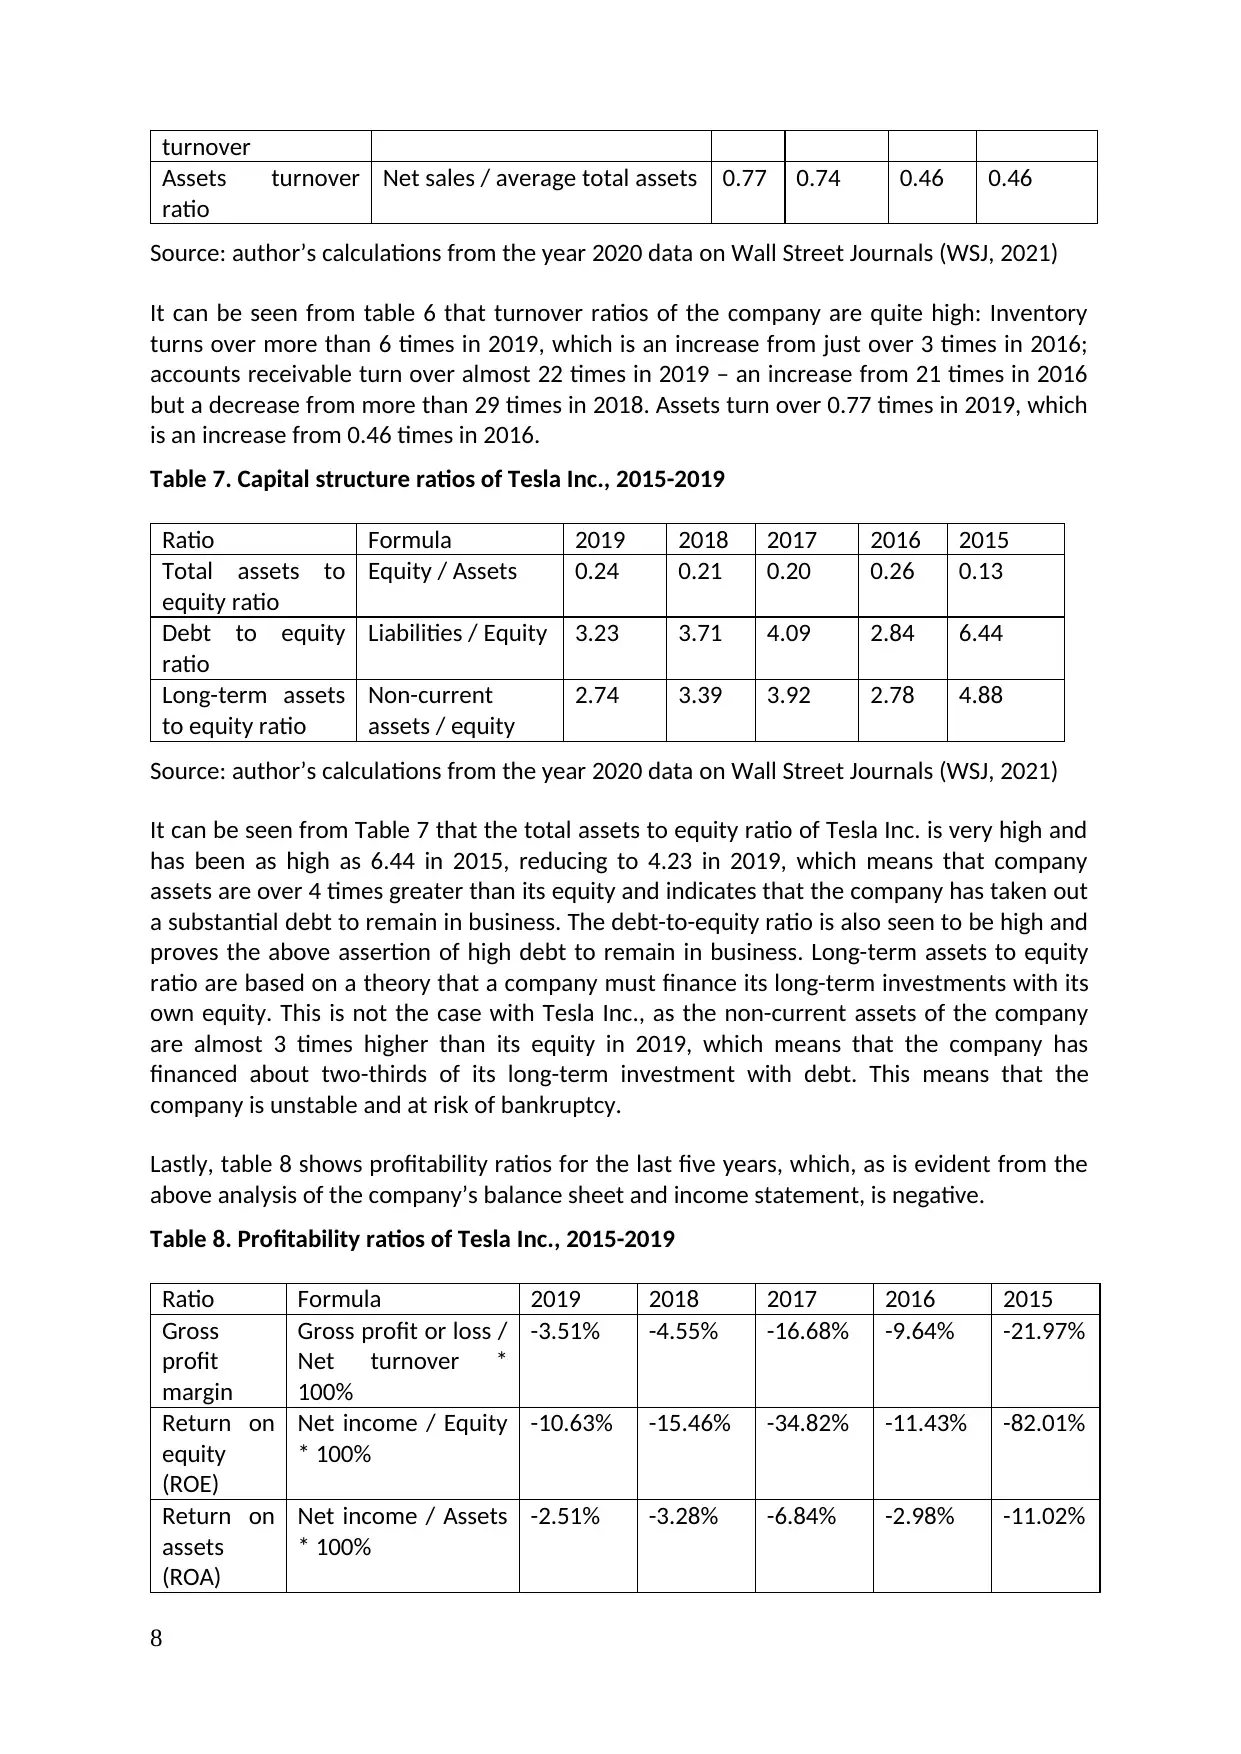
Net sales / average total assets 0.77 0.74 0.46 0.46
Source: author’s calculations from the year 2020 data on Wall Street Journals (WSJ, 2021)
It can be seen from table 6 that turnover ratios of the company are quite high: Inventory
turns over more than 6 times in 2019, which is an increase from just over 3 times in 2016;
accounts receivable turn over almost 22 times in 2019 – an increase from 21 times in 2016
but a decrease from more than 29 times in 2018. Assets turn over 0.77 times in 2019, which
is an increase from 0.46 times in 2016.
Table 7. Capital structure ratios of Tesla Inc., 2015-2019
Ratio Formula 2019 2018 2017 2016 2015
Total assets to
equity ratio
Equity / Assets 0.24 0.21 0.20 0.26 0.13
Debt to equity
ratio
Liabilities / Equity 3.23 3.71 4.09 2.84 6.44
Long-term assets
to equity ratio
Non-current
assets / equity
2.74 3.39 3.92 2.78 4.88
Source: author’s calculations from the year 2020 data on Wall Street Journals (WSJ, 2021)
It can be seen from Table 7 that the total assets to equity ratio of Tesla Inc. is very high and
has been as high as 6.44 in 2015, reducing to 4.23 in 2019, which means that company
assets are over 4 times greater than its equity and indicates that the company has taken out
a substantial debt to remain in business. The debt-to-equity ratio is also seen to be high and
proves the above assertion of high debt to remain in business. Long-term assets to equity
ratio are based on a theory that a company must finance its long-term investments with its
own equity. This is not the case with Tesla Inc., as the non-current assets of the company
are almost 3 times higher than its equity in 2019, which means that the company has
financed about two-thirds of its long-term investment with debt. This means that the
company is unstable and at risk of bankruptcy.
Lastly, table 8 shows profitability ratios for the last five years, which, as is evident from the
above analysis of the company’s balance sheet and income statement, is negative.
Table 8. Profitability ratios of Tesla Inc., 2015-2019
Ratio Formula 2019 2018 2017 2016 2015
Gross
profit
margin
Gross profit or loss /
Net turnover *
100%
-3.51% -4.55% -16.68% -9.64% -21.97%
Return on
equity
(ROE)
Net income / Equity
* 100%
-10.63% -15.46% -34.82% -11.43% -82.01%
Return on
assets
(ROA)
Net income / Assets
* 100%
-2.51% -3.28% -6.84% -2.98% -11.02%
8
Assets turnover
ratio
Net sales / average total assets 0.77 0.74 0.46 0.46
Source: author’s calculations from the year 2020 data on Wall Street Journals (WSJ, 2021)
It can be seen from table 6 that turnover ratios of the company are quite high: Inventory
turns over more than 6 times in 2019, which is an increase from just over 3 times in 2016;
accounts receivable turn over almost 22 times in 2019 – an increase from 21 times in 2016
but a decrease from more than 29 times in 2018. Assets turn over 0.77 times in 2019, which
is an increase from 0.46 times in 2016.
Table 7. Capital structure ratios of Tesla Inc., 2015-2019
Ratio Formula 2019 2018 2017 2016 2015
Total assets to
equity ratio
Equity / Assets 0.24 0.21 0.20 0.26 0.13
Debt to equity
ratio
Liabilities / Equity 3.23 3.71 4.09 2.84 6.44
Long-term assets
to equity ratio
Non-current
assets / equity
2.74 3.39 3.92 2.78 4.88
Source: author’s calculations from the year 2020 data on Wall Street Journals (WSJ, 2021)
It can be seen from Table 7 that the total assets to equity ratio of Tesla Inc. is very high and
has been as high as 6.44 in 2015, reducing to 4.23 in 2019, which means that company
assets are over 4 times greater than its equity and indicates that the company has taken out
a substantial debt to remain in business. The debt-to-equity ratio is also seen to be high and
proves the above assertion of high debt to remain in business. Long-term assets to equity
ratio are based on a theory that a company must finance its long-term investments with its
own equity. This is not the case with Tesla Inc., as the non-current assets of the company
are almost 3 times higher than its equity in 2019, which means that the company has
financed about two-thirds of its long-term investment with debt. This means that the
company is unstable and at risk of bankruptcy.
Lastly, table 8 shows profitability ratios for the last five years, which, as is evident from the
above analysis of the company’s balance sheet and income statement, is negative.
Table 8. Profitability ratios of Tesla Inc., 2015-2019
Ratio Formula 2019 2018 2017 2016 2015
Gross
profit
margin
Gross profit or loss /
Net turnover *
100%
-3.51% -4.55% -16.68% -9.64% -21.97%
Return on
equity
(ROE)
Net income / Equity
* 100%
-10.63% -15.46% -34.82% -11.43% -82.01%
Return on
assets
(ROA)
Net income / Assets
* 100%
-2.51% -3.28% -6.84% -2.98% -11.02%
8
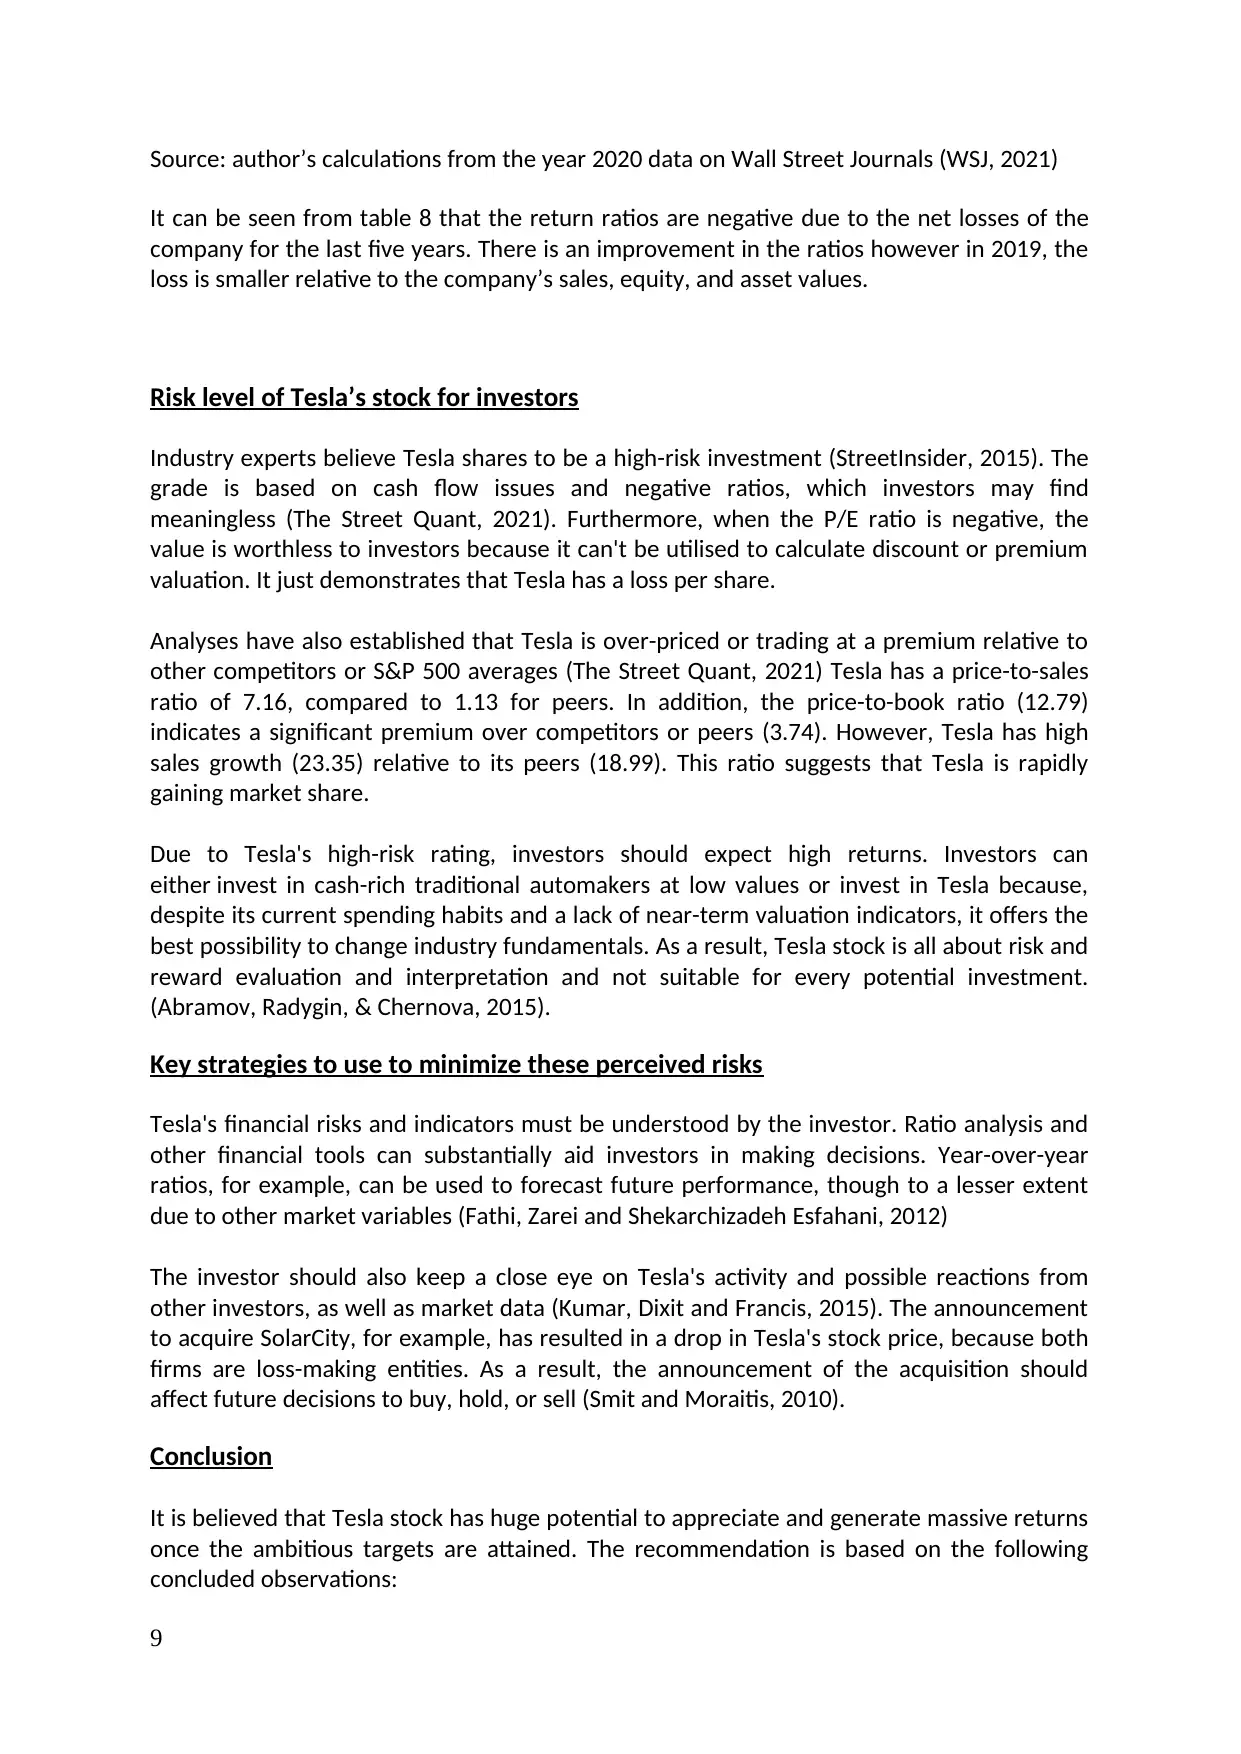
Source: author’s calculations from the year 2020 data on Wall Street Journals (WSJ, 2021)
It can be seen from table 8 that the return ratios are negative due to the net losses of the
company for the last five years. There is an improvement in the ratios however in 2019, the
loss is smaller relative to the company’s sales, equity, and asset values.
Risk level of Tesla’s stock for investors
Industry experts believe Tesla shares to be a high-risk investment (StreetInsider, 2015). The
grade is based on cash flow issues and negative ratios, which investors may find
meaningless (The Street Quant, 2021). Furthermore, when the P/E ratio is negative, the
value is worthless to investors because it can't be utilised to calculate discount or premium
valuation. It just demonstrates that Tesla has a loss per share.
Analyses have also established that Tesla is over-priced or trading at a premium relative to
other competitors or S&P 500 averages (The Street Quant, 2021) Tesla has a price-to-sales
ratio of 7.16, compared to 1.13 for peers. In addition, the price-to-book ratio (12.79)
indicates a significant premium over competitors or peers (3.74). However, Tesla has high
sales growth (23.35) relative to its peers (18.99). This ratio suggests that Tesla is rapidly
gaining market share.
Due to Tesla's high-risk rating, investors should expect high returns. Investors can
either invest in cash-rich traditional automakers at low values or invest in Tesla because,
despite its current spending habits and a lack of near-term valuation indicators, it offers the
best possibility to change industry fundamentals. As a result, Tesla stock is all about risk and
reward evaluation and interpretation and not suitable for every potential investment.
(Abramov, Radygin, & Chernova, 2015).
Key strategies to use to minimize these perceived risks
Tesla's financial risks and indicators must be understood by the investor. Ratio analysis and
other financial tools can substantially aid investors in making decisions. Year-over-year
ratios, for example, can be used to forecast future performance, though to a lesser extent
due to other market variables (Fathi, Zarei and Shekarchizadeh Esfahani, 2012)
The investor should also keep a close eye on Tesla's activity and possible reactions from
other investors, as well as market data (Kumar, Dixit and Francis, 2015). The announcement
to acquire SolarCity, for example, has resulted in a drop in Tesla's stock price, because both
firms are loss-making entities. As a result, the announcement of the acquisition should
affect future decisions to buy, hold, or sell (Smit and Moraitis, 2010).
Conclusion
It is believed that Tesla stock has huge potential to appreciate and generate massive returns
once the ambitious targets are attained. The recommendation is based on the following
concluded observations:
9
⊘ This is a preview!⊘
Do you want full access?
Subscribe today to unlock all pages.
Trusted by 1+ million students worldwide
Growth: Tesla is most likely to grow more than its current position because it is still
considered as a start-up driving two emerging industries with massive impacts.
Total Return: Based on the historic price movement of the stock, Tesla has gained more
percentage than it has lost. Many analysts claim that Tesla stock is overpriced.
Price Volatility: The historical price movement has generally been good. In this case, most
investors have often reacted to ‘noise’ rather than major events. Thus, price volatility noted
will improve once the company attains some of its targets.
Financial Position: The gross margin has continued to increase year-over-year as Tesla
acquires more market share. Nevertheless, the net income declined to affect overall
performance. Also, the weak liquidity noted in quick and current ratios are temporary,
which will improve. Overall, the liquidity continues to improve, reflecting an improving cash
flow.
Therefore, in the long-run, Tesla stock is recommended to a growth-oriented investor as
data gained by the financial ratios have proved. It has shown that Tesla is overall efficient, a
more liquid company, and more profitable. While some investors may be selling, Tesla
remains a superior buying investment opportunity.
10
Paraphrase This Document
Need a fresh take? Get an instant paraphrase of this document with our AI Paraphraser
References
- Abramov, A., Radygin, A. and Chernova, M. (2015) 'Long-term portfolio investments:
New insight into return and risk'. Russian Journal of Economics, 1(3) pp.273-293.
- Arkan, T. (2016) 'The Importance of Financial Ratios in Predicting Stock Price Trends:
A Case Study in Emerging Markets'. Zeszyty Naukowe Uniwersytetu Szczecińskiego
Finanse Rynki Finansowe Ubezpieczenia, 79 pp.13-26.
- Brigham, E. and Gapenski, L. (1997) Financial management. 11th ed. Fort Worth:
Dryden Press.
- D’Allegro, J. (2015) The biggest mutual fund bets on Tesla Motors. CNBC. [Online]
[Accessed on 27 December 2021] https://www.cnbc.com/2015/11/03/the-biggest-
mutual-fund-bets-on-tesla-motors.html.
- Fathi, S., Zarei, F. and Shekarchizadeh Esfahani, S. (2012) 'Studying the Role of
Financial Risk Management on Return on Equity'. International Journal of Business
and Management, 7(9).
- Gurdus, L. (2021) It’s hard to get on board’ with buying Tesla here despite analyst
optimism, trader says. CNBC. [Online] [Accessed on 22 December 2021]
https://www.cnbc.com/2021/12/09/hard-to-get-on-board-with-tesla-despite-
analyst-optimism-trader.html.
- Hawkins, A. (2018) Tesla relied on too many robots to build the Model 3, Elon Musk
says. The Verge. [Online] [Accessed on 2 January 2022]
https://www.theverge.com/2018/4/13/17234296/tesla-model-3-robots-production-
hell-elon-musk.
- Kumar, M., Dixit, J. and Francis, B. (2015) 'The impact of prior stock market reactions
on risk taking in acquisitions'. Strategic Management Journal, 36(13) pp.2111-2121.
- Smit, H. and Moraitis, T. (2010) 'Serial Acquisition Options'. Long Range Planning,
43(1) pp.85-103.
- StreetInsider (2015) High Risks-High Rewards for Tesla (TSLA) Investors; Morgan
Stanley Sees Buying Opportunity. StreetInsider.com. [Online] [Accessed on 28
December 2021] https://www.streetinsider.com/Analyst+Comments/High+Risks-
High+Rewards+for+Tesla+(TSLA)+Investors
%3B+Morgan+Stanley+Sees+Buying+Opportunity/10290198.html.
- The Street Quant (2021) The Street Quant Ratings Equities. Thestreet.com. [Online]
[Accessed on 31 December 2021]
https://www.thestreet.com/files/r/ratings/equities/TSLA_weiss.pdf.
- Vanguard Group Inc. (2021) Model Portfolio Allocation | Vanguard.
Investor.vanguard.com. [Online] [Accessed on 31 December 2021]
https://investor.vanguard.com/investor-resources-education/education/model-
portfolio-allocation.
- Watts, R. (1977) 'Corporate Financial Statements, A Product of the Market and
Political Processes'. Australian Journal of Management, 2(1) pp.53-75.
- WSJ (2021) TSLA | Tesla Inc. Stock Price & News - WSJ. WSJ. [Online] [Accessed on 28
December 2021] https://www.wsj.com/market-data/quotes/TSLA?
mod=searchresults_companyquotes.
11
Appendices
Appendix 1
Assets
The fiscal year is January-
December. All values USD
Millions.
2019 2018 2017 2016 2015
Cash & Short Term
Investments
6,514 3,878 3,523 3,499 1,220
Cash Only 6,514 3,878 3,523 3,499 1,220
Cash & Short Term
Investments Growth
67.97% 10.07% 0.70% 186.89% -
Cash & ST Investments /
Total Assets
18.99% 13.04% 12.30% 15.44% 15.12%
Total Accounts Receivable 1,324 949 515 499 169
Accounts Receivables, Net 1,324 949 515 499 169
Accounts Receivables, Gross 1,324 949 515 499 169
Accounts Receivable Growth 39.51% 84.14% 3.25% 195.41% -
Accounts Receivable
Turnover
18.56 22.61 22.82 14.02 23.95
Inventories 3,552 3,113 2,264 2,067 1,278
Finished Goods 1,356 1,582 1,014 1,017 477
Work in Progress 362 297 243 234 164
Raw Materials 1,834 1,235 1,006 817 637
Other Current Assets 713 366 268 194 115
Miscellaneous Current Assets 713 366 268 194 115
Total Current Assets 12,103 8,306 6,571 6,259 2,782
Net Property, Plant &
Equipment
20,199 19,691 20,492 15,037 5,195
Property, Plant & Equipment
- Gross
25,062 22,886 22,436 16,055 5,766
Buildings 3,024 4,047 2,517 1,079 522
Machinery & Equipment 1,493 1,398 1,256 795 551
Construction in Progress 764 807 2,542 2,147 693
Computer Software and
Equipment
595 487 395 276 176
Leased Property 2,853 2,090 4,117 3,134 1,791
Other Property, Plant &
Equipment
15,115 14,057 11,609 8,623 2,033
Accumulated Depreciation 4,863 3,195 1,944 1,018 571
Total Investments and
Advances
270 398 442 268 32
Other Long-Term
Investments
270 398 442 268 32
Long-Term Note Receivable 393 422 457 506 -
Intangible Assets 537 351 422 376 13
12
⊘ This is a preview!⊘
Do you want full access?
Subscribe today to unlock all pages.
Trusted by 1+ million students worldwide
1 out of 18
Related Documents


Your All-in-One AI-Powered Toolkit for Academic Success.
+13062052269
info@desklib.com
Available 24*7 on WhatsApp / Email
![[object Object]](/_next/static/media/star-bottom.7253800d.svg)
Unlock your academic potential
Copyright © 2020–2026 A2Z Services. All Rights Reserved. Developed and managed by ZUCOL.