Financial Analysis Report: Tesla Inc. and Daimler AG Comparison
VerifiedAdded on 2023/01/12
|20
|5276
|23
Report
AI Summary
This report provides a comprehensive financial analysis of Tesla Inc. and Daimler AG, two prominent companies in the automotive industry, focusing on their performance between 2015 and 2018. The analysis employs various financial tools, including ratio analysis, horizontal analysis of balance sheets, and vertical analysis of income statements, to compare and contrast the financial positions of both companies. The report delves into key financial aspects such as profitability, liquidity, and solvency, highlighting the strengths and weaknesses of each entity. The structure of the report includes an introduction outlining the importance of financial analysis, followed by a main body that critically compares and contrasts the financial performance and position of Tesla and Daimler. It also examines the cash positions of both companies. The report concludes with a summary of the findings and includes appendices with supporting financial data and calculations. Overall, the report aims to provide a detailed understanding of the financial health and performance of Tesla and Daimler over the specified period.

Financial Analysis
Management & Enterprises -
FAME
Management & Enterprises -
FAME
Paraphrase This Document
Need a fresh take? Get an instant paraphrase of this document with our AI Paraphraser
Table of Contents
INTRODUCTION...........................................................................................................................1
MAIN BODY...................................................................................................................................1
Overview of both organisation....................................................................................................1
1. Critically compare and contrast the financial performance and financial position of Tesla
and Daimler over the last four years...........................................................................................2
Horizontal analysis of Balance sheet .........................................................................................3
2. Critically analyses the cash position of both companies.........................................................8
CONCLUSION................................................................................................................................9
REFERENCES..............................................................................................................................10
Appendices.....................................................................................................................................11
INTRODUCTION
Financial analysis is one of the key tool which is applied by manager to analysis actual
performance of business. As per purpose, they are constantly querying the financial analyst about
the profitability, cash flow and different aspects of financial activities (Bezzina and et.al., 2014).
It is examination of a business from a variety of perspectives in regard of fully understand the
greater financial situation and analysis how best to strengthen the business. The main purpose to
prepare this report to recognise financial strength as well as weakness to identify strongest
company. This analysis helps a business to identify different aspects that related with business
and impact on financial activities like profitability and stability for solvency as well as liquidity.
This report based on two companies of Tesla and Daimler. In present time both companies are
playing significant role in automotive sector. In this report analysis of financial performance over
the last four year (2015 - 2018). For financial analysis apply different types of tools like ratio
analysis, vertical and horizontal analysis.
MAIN BODY
Overview of both organisation
Tesla Inc.- It is an American electric Vehicle and clean energy company that based on
the Palo Alto, California. This organisation had been established in July 1, 2003 by Martin
Eberhard, Marc Tarpenning. It is mainly dealing into electric vehicles and Tesla energy. The
company is dealing into particular products like battery energy storage, electric vehicle
manufacturing, home to grid scale and many others. It is famous organisation that get position of
best selling plug in and best selling battery electric passenger car manufacturer in the year of
2019. The sales of the organisation is enhanced by 50% from 245240 units in 2018. to 367849
units in 2019.
Daimler: It is a famous German multinational automotive sector organisation which is
mainly dealing into commercial vehicles. The company has been situated in Mercedreesstarb,
Stuttgart, Germany. It was established in 28 June 1926 by Benz & Cie. Daimler is getting
position of 13 as car manufacturing and largest truck manufacturer in the world. This company
provide all relevant financial services by the Daimler financial services arm. This organisation is
part of the Euro Stoxx 50 stock market index.
1
⊘ This is a preview!⊘
Do you want full access?
Subscribe today to unlock all pages.
Trusted by 1+ million students worldwide
1. Critically compare and contrast the financial performance and financial position of Tesla and
Daimler over the last four years
To analysis the financial position of business require to use different types of tools and
techniques that helps to understand strongest financial position. There are using tools are ratio
analysis, horizontal and vertical analysis in proper manner. Along with identified of financial
strength and weakness of both companies and concluded that (Chang and et.al., 2016).
Vertical Analysis: It is a method of financial statement in which focus on every item
which is mentioned in statement and take as percentage on the basis of particular figure. Hence,
line items of vertical analysis based on the percentage of gross sales, on the other side in balance
sheet take total assets as percentage and for the cash flow statement take total cash flow as
percentage for recognise cash inflow and outflow of company. There are conducting analysis of
both organisation for 4 years from 2015 to 2018 that are attached in appendices. All the data
information based on the vertical FS of companies that are as following:
Vertical analysis in income statement
Tesla Inc.: There are sales taking as a base for whole analysis after that focus on the
income statement of an organisation. There are sales of Tesla take as 100 percentage after that
analysis cost of
Daimler: There are conducting Horizontal analysis of income statement which is based
on 2018 increment in revenue was 1.85% while it is increasing with 7.225 in 2017 and 2.54% in
2016. After that identified that gross profit which was -3.68% in 2018 but increasing by 7.41%,
0.52% in 2017 to 2016 respectively. Moreover cost of sales in the year 2018 was 3.3.% that
increased and reach on 7.17% in 2017 and 3.08% in the year 2016. The operating income was -
3.74% in 2016 that increase in 2016 and reached on 7.54% and finally in 2018 it was again
decreasing and reach on -22.54%. Along with the net income was -31.13% in 2018 that was
converting in positive 23.45% in 2017 and in 2016 reached on 1.21% in decreasing manner.
These changes impact on changeable position that shows company had not effective position as
per the growth (Liang, 2018).
Tesla Inc.: There are analysed changes in percentage and evaluate the position of
business in changing years. In 2018 revenues was 100% which was remaining same in 2017 as
well as 2016 & 2015 respectively. From revenues less amount of cost of sales and in 2015 get
amount of 77.19% that was increasing year on year like 77.16%, 81.10%, 81.17% from 2016 to
2
Paraphrase This Document
Need a fresh take? Get an instant paraphrase of this document with our AI Paraphraser
2018 respectively. In addition, get amount gross profit which was 22.84% in 2015 after that got
changes like 22.84%, 18.90% & 18.83% respectively. The operating income of 2018 was -1.18%
that was increasing in ongoing manner such as -13.88%, -9.53%, -17.72% from 207 to 2015
respectively. At the end the Net income of business was -21.97% that was decreasing in
continuous manner such as -19.06% in 2017, -11.04% in 206 and -21.97% in 2015.
Horizontal analysis: It is important technique to financial analysis which is utilise by
different types of organization in order to present all the changes in the amounts of financial
reports that are mentioned for specific period of time. Horizontal analysis is effective tool which
is mainly used to examine the trend situations. The statement for two or more periods are used in
this analysis. For example: Compare an organisation's sales in 2015 to 2016 to identify changes.
These changes are analysed into percentage way and income statement at the far right.
Horizontal analysis of Balance sheet
Daimler: The company conduct vertical analysis that impact on the assets and liabilities
that can change from 2015 to 2018. There are taking base year of 2018 to compare with other
years. It was 31.32% in year of 2018 that was decreasing in 2017 to 2015 like 9.94% and
10.52%. The other current assets was 9.33% in 2018 that was increasing by 9.82% in 2017 but
increasing in 2016 by 15.15% as compare with 2018. The total current assets was 13.94% in
2018 that was decreasing in other years from 2016 to 2015 respectively like 4.59% & 11.11%.
Moreover, total current liabilities was 12.45% in 2018 that was decreasing as compare of 2018
which was 3.14%, 9.57% from 2017 to 2016 respectively. Total liabilities was 13.24% in 2018
that decreasing by 3.54% in 2017 and in 13.10% in 2016. In other years had not good position as
compare with 2018. Total stockholders equity was 1.01% in 2018 after that compare other years
so finding that it was increasing in good manner (Madura, 2020).
Tesla Inc.: There are analysed total assets and liabilities changes in year on year from
2015 to 2018. Cash & cash equivalents 12.39% in 2018 but it was decreasing in other years such
as 11.75%, 14.97% & 14.79% from 2017 to 2015. other current assets was 1.23% in 2018 that
was reaching on 0.94% in 2017 after that 0.86% & 1.54% in the year 2016 & 2015. Moreover
total current assets was 27.93% in year 2018 that was falling down by 22.93% in 2017 then
27.62% in 2016 & 34.50% in 2015. Total non current assets was in 2018 72.07% that was
increasing 77.07% in 2017 after that decreasing continuously like 72.38%, 65.51% 2017 to 2016.
Total assets in 2018 to 2015 remain 100%.
3

The other short term debt 8.63% in 2018 that was some time increase and some time
decreasing like 3.13% in 2017, 5.07% in 2016 & 7.82% in 2015. Along with total current
liabilities was 33.60% in 2018, 26.78% in 2017, 25.71% in 2016 & 34.80% in 2015. All the year
it was fluctuated in decreasing and decreasing manner. Additionally, Total liabilities had
company 83.44% in 2018 after that on basis of base year analysis changes that 85.21% in 2017,
79.03% in 2016 and 86.55% in 2015. Along with analysing of stockholders equity in which
analysis total stockholders equity was 16.55% in 2018, after that decreasing continuously
14.79%, 20.97% and 13.64% from 2017 to 2015.
Ratio analysis: It is defined as comparison of different line items which are mentioned
into financial statements of an organisation. The ratio analysis mainly applied by an organisation
to identified number of problems with an entity like liquidity position, profitability and
efficiency of operation in business. On the basis of calculation apply trend line to predict the
right direction of future ratio performance. For this analysis take past year activities as basis after
the compare present financial position. There are calculated ratio of both company for four year
from 2015 to 2018 (Martin, 2016).
Daimler Plc
Profitability Ratio analysis: These types of ratio analysis by an organisation to measure
and evaluate the ability of an organisation to earn income which is calculated on basis of balance
sheet assets ans revenues from income statement. This ratio has been categorised into three ratios
such as, net profit, gross profit and return on assets.
The gross profit ratio is calculated by the Daimler to evolute the effectiveness and
identify core business operations. As per the above report it is analysed that in 2015 generate
about 21.27% which was decreased in the year of 2016, 2017, 2018 such as, 20.86%, 20.89%
and 19.76% respectively.
4
⊘ This is a preview!⊘
Do you want full access?
Subscribe today to unlock all pages.
Trusted by 1+ million students worldwide

It is one of important ratio which is utilised by business to measure profitability which is
achieved after deducting all the expenditure. From this calculation it is understanding that net
profit of the company in 2015 was 5.64% after that it is continuous increasing and reach on
5.56% in 2016, 6.40% in 2017 but in the year of 2018 it fall down and achieved 4.33%.
This ratio presents the cash position in business after that take decision to pay off debtors
and invest amount in ventures. It shows relationship in between current assets as well as current
liabilities. There are calculating this ratio for four years from 2015 to 2018 such as, 1.19, 1.21,
1.23 and 1.24.
This ratio helps to define about liquid position of business according to that take further
action in regard of the investment. There are identified that ratio has been decreased in
continuous manner from 2015 to 2018 due to sale out quick assets within 12 months.
As per the data calculation it has been analysed that this ratio presents that how to
increased and decreased of debt & equity from 2018 to 2015. There are identified different
changes in changes in 2018 as compare with previous years.
5
Paraphrase This Document
Need a fresh take? Get an instant paraphrase of this document with our AI Paraphraser

This ratio mainly based on the revenues and assets which was different in each year and
evaluated that assets turn over ratio was fluctuated due to changing into assets sale out and
purchase into different years.
It is mainly depended on the net profits of business that was fluctuated as per the
changes. There are analysed that in 2015 it was 15.70% which was increased and fall down and
reach on the 11.21% in year of 2018.
Tesla Inc.
There are calculating ratio of Tesla Inc. in order to analysis the financial health and
changes in year in year.
According to above calculation it is identified that gross profit of a business has been
presented the profit margin are increased of business from the year of 2015 to 2018 because of
revenues increased of company that impact in positive manner.
Year 2018 Year 2017 Year 2016 Year 2015
6
Current Assets 8306 6571 6260 2792
Current Liabilities 9992 7675 5827 2816
Current Ratio 0.83 0.85 1.07 0.99
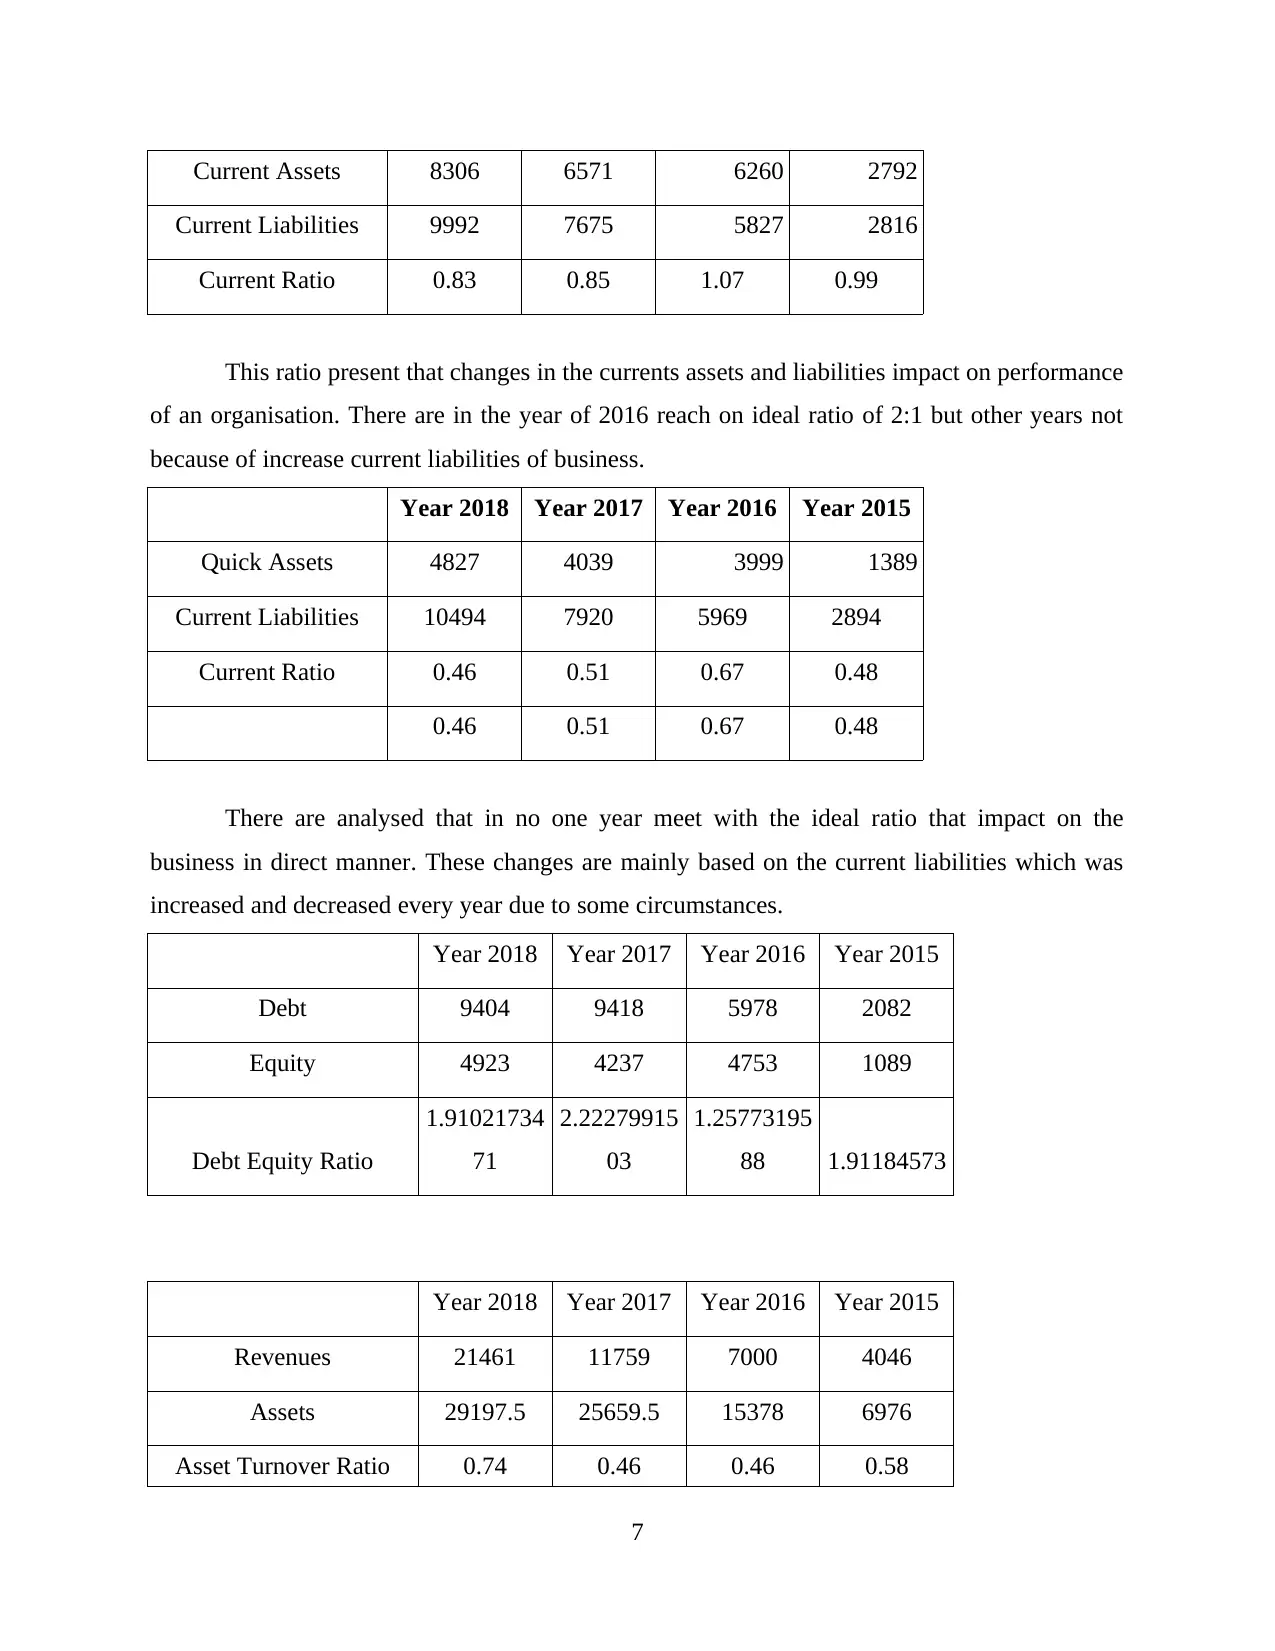
This ratio present that changes in the currents assets and liabilities impact on performance
of an organisation. There are in the year of 2016 reach on ideal ratio of 2:1 but other years not
because of increase current liabilities of business.
Year 2018 Year 2017 Year 2016 Year 2015
Quick Assets 4827 4039 3999 1389
Current Liabilities 10494 7920 5969 2894
Current Ratio 0.46 0.51 0.67 0.48
0.46 0.51 0.67 0.48
There are analysed that in no one year meet with the ideal ratio that impact on the
business in direct manner. These changes are mainly based on the current liabilities which was
increased and decreased every year due to some circumstances.
Year 2018 Year 2017 Year 2016 Year 2015
Debt 9404 9418 5978 2082
Equity 4923 4237 4753 1089
Debt Equity Ratio
1.91021734
71
2.22279915
03
1.25773195
88 1.91184573
Year 2018 Year 2017 Year 2016 Year 2015
Revenues 21461 11759 7000 4046
Assets 29197.5 25659.5 15378 6976
Asset Turnover Ratio 0.74 0.46 0.46 0.58
7
Current Liabilities 9992 7675 5827 2816
Current Ratio 0.83 0.85 1.07 0.99
This ratio present that changes in the currents assets and liabilities impact on performance
of an organisation. There are in the year of 2016 reach on ideal ratio of 2:1 but other years not
because of increase current liabilities of business.
Year 2018 Year 2017 Year 2016 Year 2015
Quick Assets 4827 4039 3999 1389
Current Liabilities 10494 7920 5969 2894
Current Ratio 0.46 0.51 0.67 0.48
0.46 0.51 0.67 0.48
There are analysed that in no one year meet with the ideal ratio that impact on the
business in direct manner. These changes are mainly based on the current liabilities which was
increased and decreased every year due to some circumstances.
Year 2018 Year 2017 Year 2016 Year 2015
Debt 9404 9418 5978 2082
Equity 4923 4237 4753 1089
Debt Equity Ratio
1.91021734
71
2.22279915
03
1.25773195
88 1.91184573
Year 2018 Year 2017 Year 2016 Year 2015
Revenues 21461 11759 7000 4046
Assets 29197.5 25659.5 15378 6976
Asset Turnover Ratio 0.74 0.46 0.46 0.58
7
⊘ This is a preview!⊘
Do you want full access?
Subscribe today to unlock all pages.
Trusted by 1+ million students worldwide
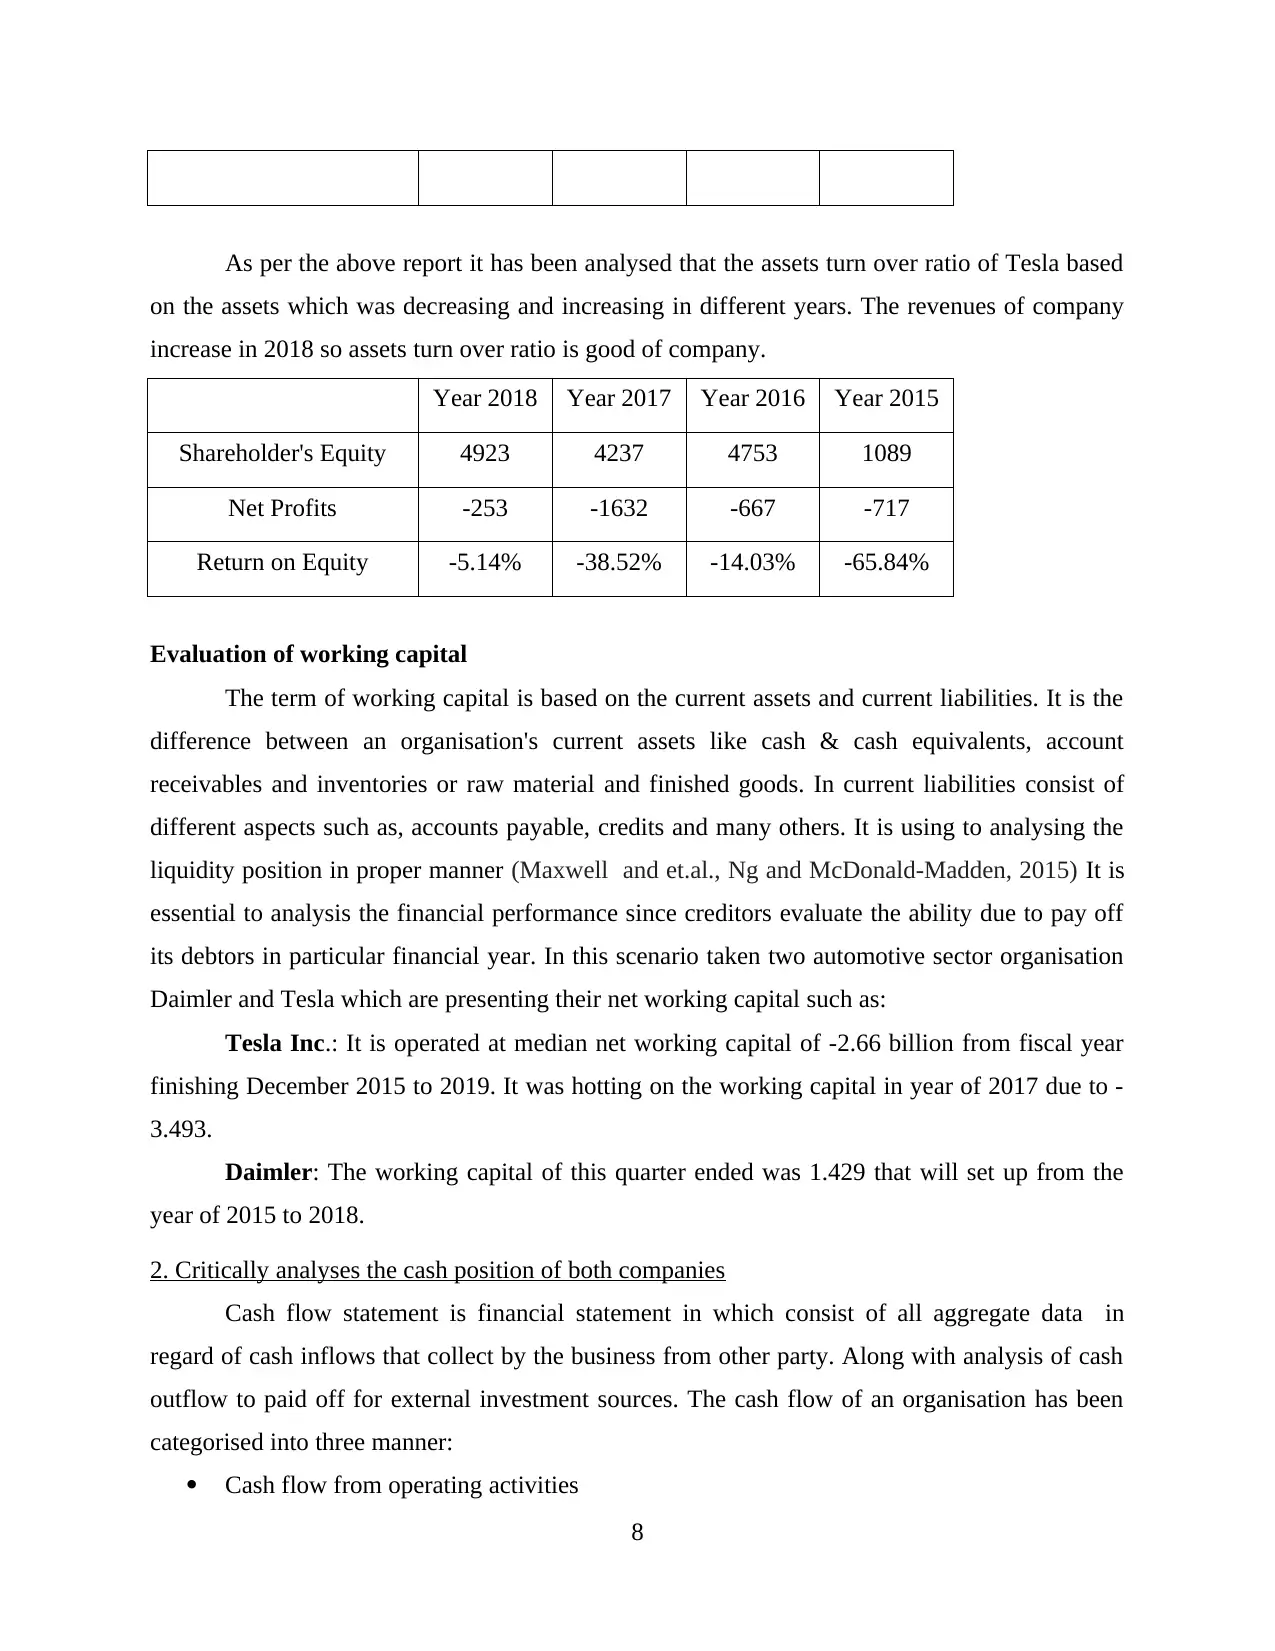
As per the above report it has been analysed that the assets turn over ratio of Tesla based
on the assets which was decreasing and increasing in different years. The revenues of company
increase in 2018 so assets turn over ratio is good of company.
Year 2018 Year 2017 Year 2016 Year 2015
Shareholder's Equity 4923 4237 4753 1089
Net Profits -253 -1632 -667 -717
Return on Equity -5.14% -38.52% -14.03% -65.84%
Evaluation of working capital
The term of working capital is based on the current assets and current liabilities. It is the
difference between an organisation's current assets like cash & cash equivalents, account
receivables and inventories or raw material and finished goods. In current liabilities consist of
different aspects such as, accounts payable, credits and many others. It is using to analysing the
liquidity position in proper manner (Maxwell and et.al., Ng and McDonald‐Madden, 2015) It is
essential to analysis the financial performance since creditors evaluate the ability due to pay off
its debtors in particular financial year. In this scenario taken two automotive sector organisation
Daimler and Tesla which are presenting their net working capital such as:
Tesla Inc.: It is operated at median net working capital of -2.66 billion from fiscal year
finishing December 2015 to 2019. It was hotting on the working capital in year of 2017 due to -
3.493.
Daimler: The working capital of this quarter ended was 1.429 that will set up from the
year of 2015 to 2018.
2. Critically analyses the cash position of both companies
Cash flow statement is financial statement in which consist of all aggregate data in
regard of cash inflows that collect by the business from other party. Along with analysis of cash
outflow to paid off for external investment sources. The cash flow of an organisation has been
categorised into three manner:
Cash flow from operating activities
8
Paraphrase This Document
Need a fresh take? Get an instant paraphrase of this document with our AI Paraphraser
Cash flow from financing activities
Cash flow from investing activities
Every business entity prepare this statement in order to analysis accurate cash position in
business and how much invest in stock. Accordingly they take decision for future investment and
conduct all cash relative activities in proper manner. Through this statement analysis free cash of
flow which is required to analysis of adequacy and liquid position of business in appropriate
manner (Xie and et.al., 2017)..
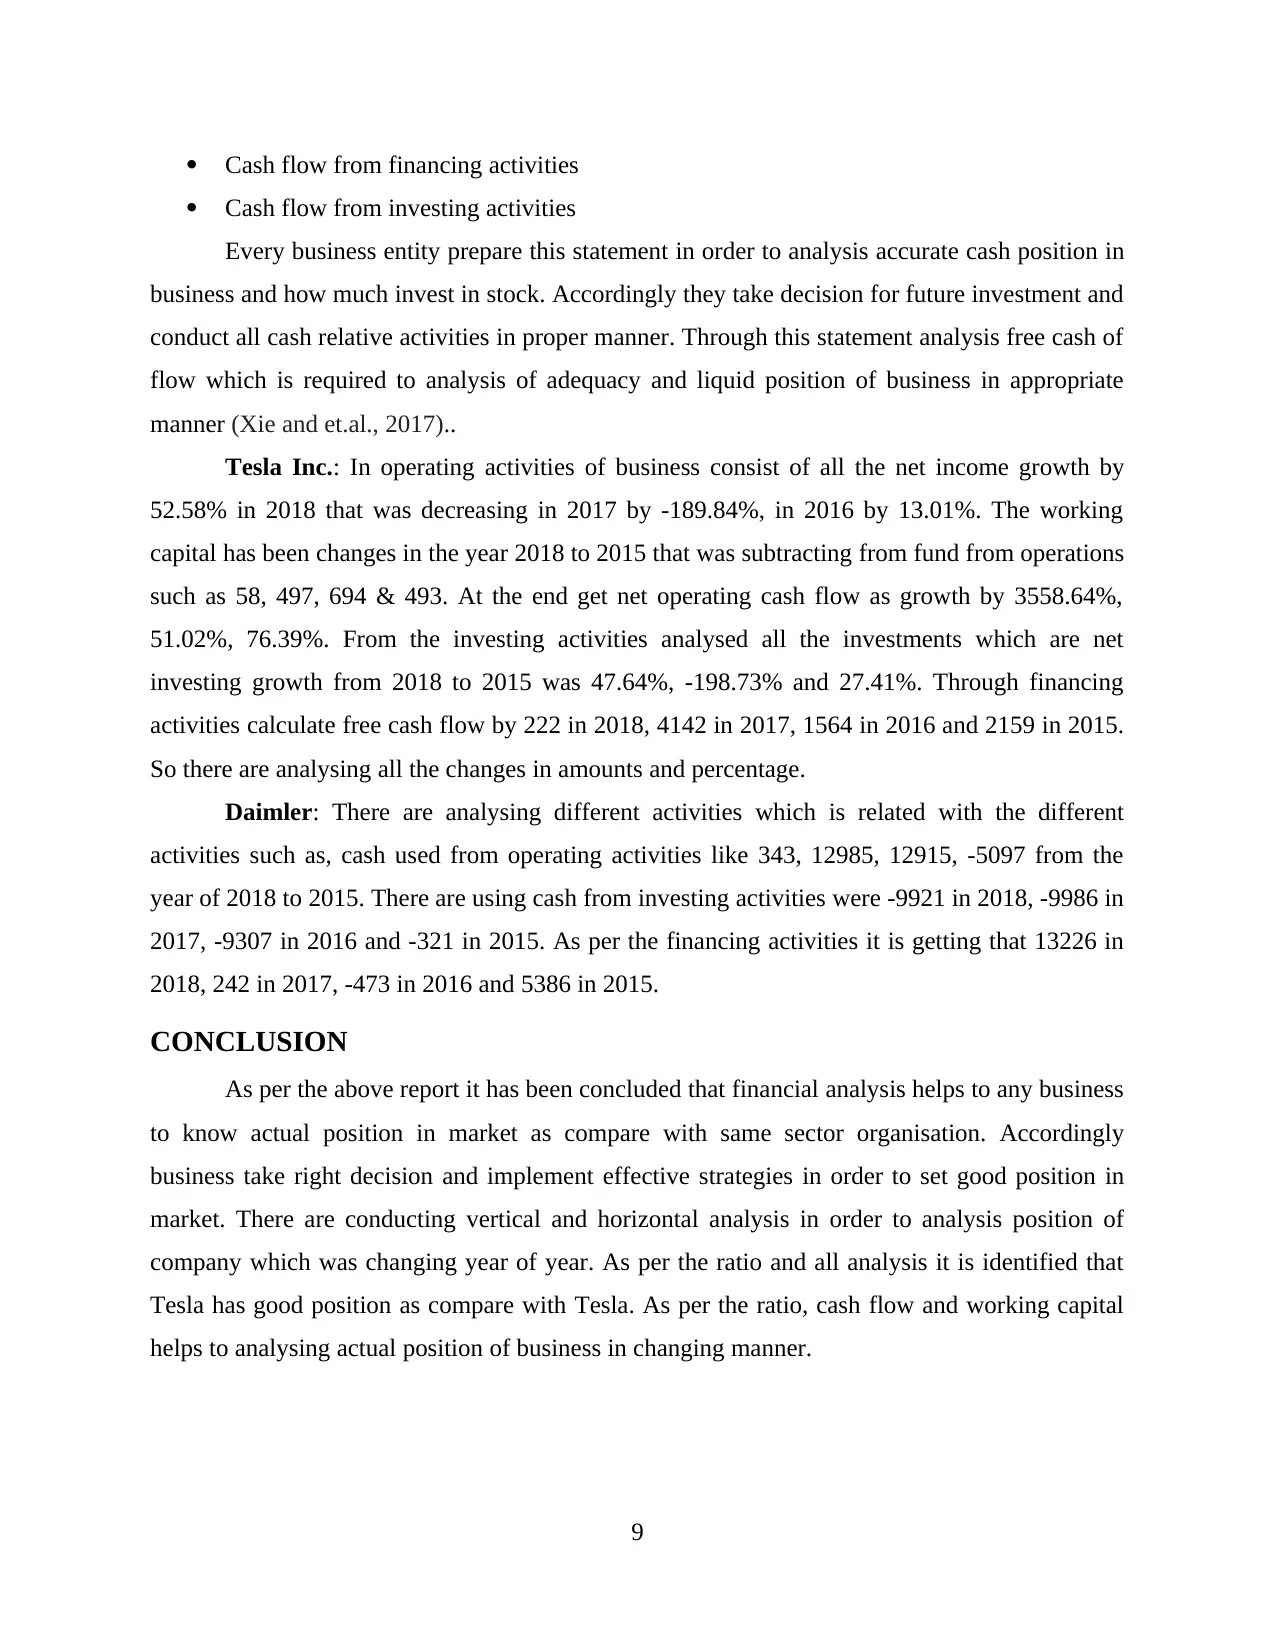
Tesla Inc.: In operating activities of business consist of all the net income growth by
52.58% in 2018 that was decreasing in 2017 by -189.84%, in 2016 by 13.01%. The working
capital has been changes in the year 2018 to 2015 that was subtracting from fund from operations
such as 58, 497, 694 & 493. At the end get net operating cash flow as growth by 3558.64%,
51.02%, 76.39%. From the investing activities analysed all the investments which are net
investing growth from 2018 to 2015 was 47.64%, -198.73% and 27.41%. Through financing
activities calculate free cash flow by 222 in 2018, 4142 in 2017, 1564 in 2016 and 2159 in 2015.
So there are analysing all the changes in amounts and percentage.
Daimler: There are analysing different activities which is related with the different
activities such as, cash used from operating activities like 343, 12985, 12915, -5097 from the
year of 2018 to 2015. There are using cash from investing activities were -9921 in 2018, -9986 in
2017, -9307 in 2016 and -321 in 2015. As per the financing activities it is getting that 13226 in
2018, 242 in 2017, -473 in 2016 and 5386 in 2015.
CONCLUSION
As per the above report it has been concluded that financial analysis helps to any business
to know actual position in market as compare with same sector organisation. Accordingly
business take right decision and implement effective strategies in order to set good position in
market. There are conducting vertical and horizontal analysis in order to analysis position of
company which was changing year of year. As per the ratio and all analysis it is identified that
Tesla has good position as compare with Tesla. As per the ratio, cash flow and working capital
helps to analysing actual position of business in changing manner.
9
Cash flow from investing activities
Every business entity prepare this statement in order to analysis accurate cash position in
business and how much invest in stock. Accordingly they take decision for future investment and
conduct all cash relative activities in proper manner. Through this statement analysis free cash of
flow which is required to analysis of adequacy and liquid position of business in appropriate
manner (Xie and et.al., 2017)..
Tesla Inc.: In operating activities of business consist of all the net income growth by
52.58% in 2018 that was decreasing in 2017 by -189.84%, in 2016 by 13.01%. The working
capital has been changes in the year 2018 to 2015 that was subtracting from fund from operations
such as 58, 497, 694 & 493. At the end get net operating cash flow as growth by 3558.64%,
51.02%, 76.39%. From the investing activities analysed all the investments which are net
investing growth from 2018 to 2015 was 47.64%, -198.73% and 27.41%. Through financing
activities calculate free cash flow by 222 in 2018, 4142 in 2017, 1564 in 2016 and 2159 in 2015.
So there are analysing all the changes in amounts and percentage.
Daimler: There are analysing different activities which is related with the different
activities such as, cash used from operating activities like 343, 12985, 12915, -5097 from the
year of 2018 to 2015. There are using cash from investing activities were -9921 in 2018, -9986 in
2017, -9307 in 2016 and -321 in 2015. As per the financing activities it is getting that 13226 in
2018, 242 in 2017, -473 in 2016 and 5386 in 2015.
CONCLUSION
As per the above report it has been concluded that financial analysis helps to any business
to know actual position in market as compare with same sector organisation. Accordingly
business take right decision and implement effective strategies in order to set good position in
market. There are conducting vertical and horizontal analysis in order to analysis position of
company which was changing year of year. As per the ratio and all analysis it is identified that
Tesla has good position as compare with Tesla. As per the ratio, cash flow and working capital
helps to analysing actual position of business in changing manner.
9
REFERENCES
Books and Journal
Bezzina, F. and et.al., 2014. Risk management practices adopted by financial firms in Malta.
Managerial Finance.
Chang, W. and et.al., 2016. Supply chain integration and firm financial performance: A meta-
analysis of positional advantage mediation and moderating factors. European
Management Journal. 34(3). pp.282-295.
Liang, X., 2018. Integrated economic and financial analysis of China’s Sponge city program for
water-resilient urban development. Sustainability. 10(3). p.669.
Madura, J., 2020. International financial management. Cengage Learning.
Martin, L. L., 2016. Financial management for human service administrators. Waveland Press.
Maxwell, S. L. and et.al., Ng, C. F. and McDonald‐Madden, E., 2015. How much is new
information worth? Evaluating the financial benefit of resolving management
uncertainty. Journal of Applied Ecology. 52(1). pp.12-20.
Nkundabanyanga, S. K. and et.al., 2017. The impact of financial management practices and
competitive advantage on the loan performance of MFIs. International Journal of Social
Economics.
Olson, D.L. and Wu, D. D., 2015. Enterprise risk management (Vol. 3). World Scientific
Publishing Company.
Schmidlin, N., 2014. The art of company valuation and financial statement analysis: a value
investor's guide with real-life case studies. John Wiley & Sons.
Song, H. and et.al., 2017. Can environmental management improve financial performance: An
empirical study of A-shares listed companies in China. Journal of cleaner production.
141. pp.1051-1056.
Xie, K. L. and et.al., 2017. Joint effects of management responses and online reviews on hotel
financial performance: A data-analytics approach. International Journal of Hospitality
Management. 62. pp.101-110.
Online
Cash flow of Tesla. 2018. [Online]. Available through:
<https://www.wsj.com/market-data/quotes/TSLA/financials/annual/cash-flow>
Cash flow of Daimler. 2019. [Online]. Available through:
<https://annualreport.daimler.com/ar2019/combined-management-report/liquidity-and-capital-
resources/cash-flows#>
10
⊘ This is a preview!⊘
Do you want full access?
Subscribe today to unlock all pages.
Trusted by 1+ million students worldwide
1 out of 20
Related Documents


Your All-in-One AI-Powered Toolkit for Academic Success.
+13062052269
info@desklib.com
Available 24*7 on WhatsApp / Email
![[object Object]](/_next/static/media/star-bottom.7253800d.svg)
Unlock your academic potential
Copyright © 2020–2026 A2Z Services. All Rights Reserved. Developed and managed by ZUCOL.