Financial Analysis Report
VerifiedAdded on 2019/12/03
|15
|4242
|157
Report
AI Summary
This report analyzes the financial performance of Thomas Cook Group plc and TUI Travel plc using ratio analysis. It calculates various profitability, liquidity, efficiency, gearing, and investment ratios for both companies over several years. The report compares the performance of the two companies based on these ratios, highlighting strengths and weaknesses. It also discusses the limitations of ratio analysis, such as the use of different accounting policies and the impact of inflation. Finally, it provides recommendations for Thomas Cook to improve its performance, focusing on increasing profitability, improving liquidity, enhancing efficiency, and managing its capital structure.

Financial Analysis
management
1 | P a g e
management
1 | P a g e
Paraphrase This Document
Need a fresh take? Get an instant paraphrase of this document with our AI Paraphraser
Table of Contents
Introduction................................................................................................................................1
Rationale.....................................................................................................................................1
Thomas Cook Group plc...................................................................................................1
TUI Travel Plc..................................................................................................................1
Performance analysis..................................................................................................................2
Limitation of ratio analysis.........................................................................................................9
Conclusion and recommendations............................................................................................10
References................................................................................................................................12
2 | P a g e

Index of Tables
Table 1: Ratio analysis of TUI Travel Plc.................................................................................3
Table 2: Ratio analysis of Thomas Cook Group Plc..................................................................4
3 | P a g e
Table 1: Ratio analysis of TUI Travel Plc.................................................................................3
Table 2: Ratio analysis of Thomas Cook Group Plc..................................................................4
3 | P a g e
⊘ This is a preview!⊘
Do you want full access?
Subscribe today to unlock all pages.
Trusted by 1+ million students worldwide
INTRODUCTION
Financial statements are the source of company's financial information. Every form of
organization prepares financial statements in order to assess their financial as well as
operational results. Moreover, it helps to compare the financial performance between two or
more companies that operate in the same line of industry. This report will discuss the main
financial statements that are prepared by the organization. Travel and tourism industry has a
great chance of success in United Kingdom. In this report, two UK travel companies have
been chosen that are Thomas Cook and TUI Travel plc. Further, ratio analysis method is
implemented to compare their operational results and financial performance. According to
this method, a number of ratios are computed to analyse the financial position of both the
companies. Further, the report also identifies the weaknesses of calculated ratios.
RATIONALE
Thomas Cook Group plc
Thomas Cook Group plc is a British Global travel company that is headquartered in
Peterborough, Cambridgeshire, UK. Company was established in the year 2007 and listed on
London stock exchange. It was established through the merger of Thomas Cook AG, Thomas
Cook & Son and MyTravel Group plc. However, Thomas Cook Retail, Thomas Cook
Airline, Condor and Hotels4u are its subsidiaries. The operations of firm prevail in tourism
industry. It operates at a global market as it is running its operations in distinct parts of the
world. It mainly functions in five divisions that are UK, Central Europe, German Airlines,
West Europe and Northern Europe. The charter and scheduled passenger airlines, package
holidays, cruise lines and hotels and resort services are provided by the company. The reason
for selecting this firm is that it operates at a large market place. It has worldwide presence
due to expanded operations. Further, company provides qualified travel and tourism services
to a large number of customers.
TUI Travel Plc
TUI Travel PLC is a public British travel group which is headquartered in Crawley,
West Sussex in United Kingdom. It was established in the year 2007 through the merger of
First Choice holidays PLC and the Tourism Division of TUI AG. However, Thomson
Airways and Thomson Holidays are its subsidiary company. It operates in 180 countries over
the world through serving more than 30 million customers. However, company mainly
operates at central Europe, Northern Europe and Western Europe. It provides travel and
transport services to consumers. Company’s operations are divided into three categories that
1 | P a g e
Paraphrase This Document
Need a fresh take? Get an instant paraphrase of this document with our AI Paraphraser
are Mainstream, Accommodation and Destination and Specialist and Activity. Vision
statement of the firm is to make travel experience special with a firm to ensure the business
sustainability. The reason for selecting this company is that it is having a larger the market
share in UK. It is gaining growth in the market through increasing revenues and also through
profitability.
PERFORMANCE ANALYSIS
Performance of Thomas Cook plc and TUI Travel plc can be analysed through
analysing financial statements. It can be done through computing different kind of ratios such
as profitability ratios, liquidity ratios, efficiency ratios, gearing ratio and investment ratios.
Profitability ratios: It measures the business profit margin on total business sales.
There are different kinds of ratios that can be computed for determining the business
operational results (Scott, 2014). It includes gross profit ratio, operating profit margin, return
on assets, return on capital invested and return on equity.
Liquidity ratios: It measures the liquid availability in business to run its operations. It
measures the ability of business to pay its short term liabilities. Current ratio and acid test
ratio are the measures of business liquidity (Brigham and Ehrhardt, 2013). Current ratio is
calculated through dividing the current assets from current liability. However, acid test ratio
is also known as quick ratio that can be computed through dividing the quick assets to current
liability. It is comparatively a good measurement of financial strength than the current ratio.
Efficiency ratio: It measures the business ability to use its various assets also that is
known as turnover and activity ratio. It identifies the turnover of receivables, repayment of
liabilities and the time taken by company to convert its inventory into cash (Shapiro, 2008). It
includes assets turnover ratio, working capital turnover ratio, receivable turnover ratio and
inventory turnover ratio.
Gearing ratio: It measures the capital structure of company as it is calculated by
dividing the debt from equity capital. Investors and lenders both analyse this ratio so as to
determine their investment and borrowing security and to take the decisions (Brigham and
Houston, 2011).
Investment ratios: Investors invest in company with the objective of getting high
amount of return on their holdings. Therefore, they make investment in such company that
yield maximum profits and shareholder’s return (Deegan, 2012). Earnings per share, dividend
per share, price earnings ratio and payout ratios can be used for this purpose.
Ratios are calculated for Thomas cook group plc and TUI Group plc as under:
2 | P a g e
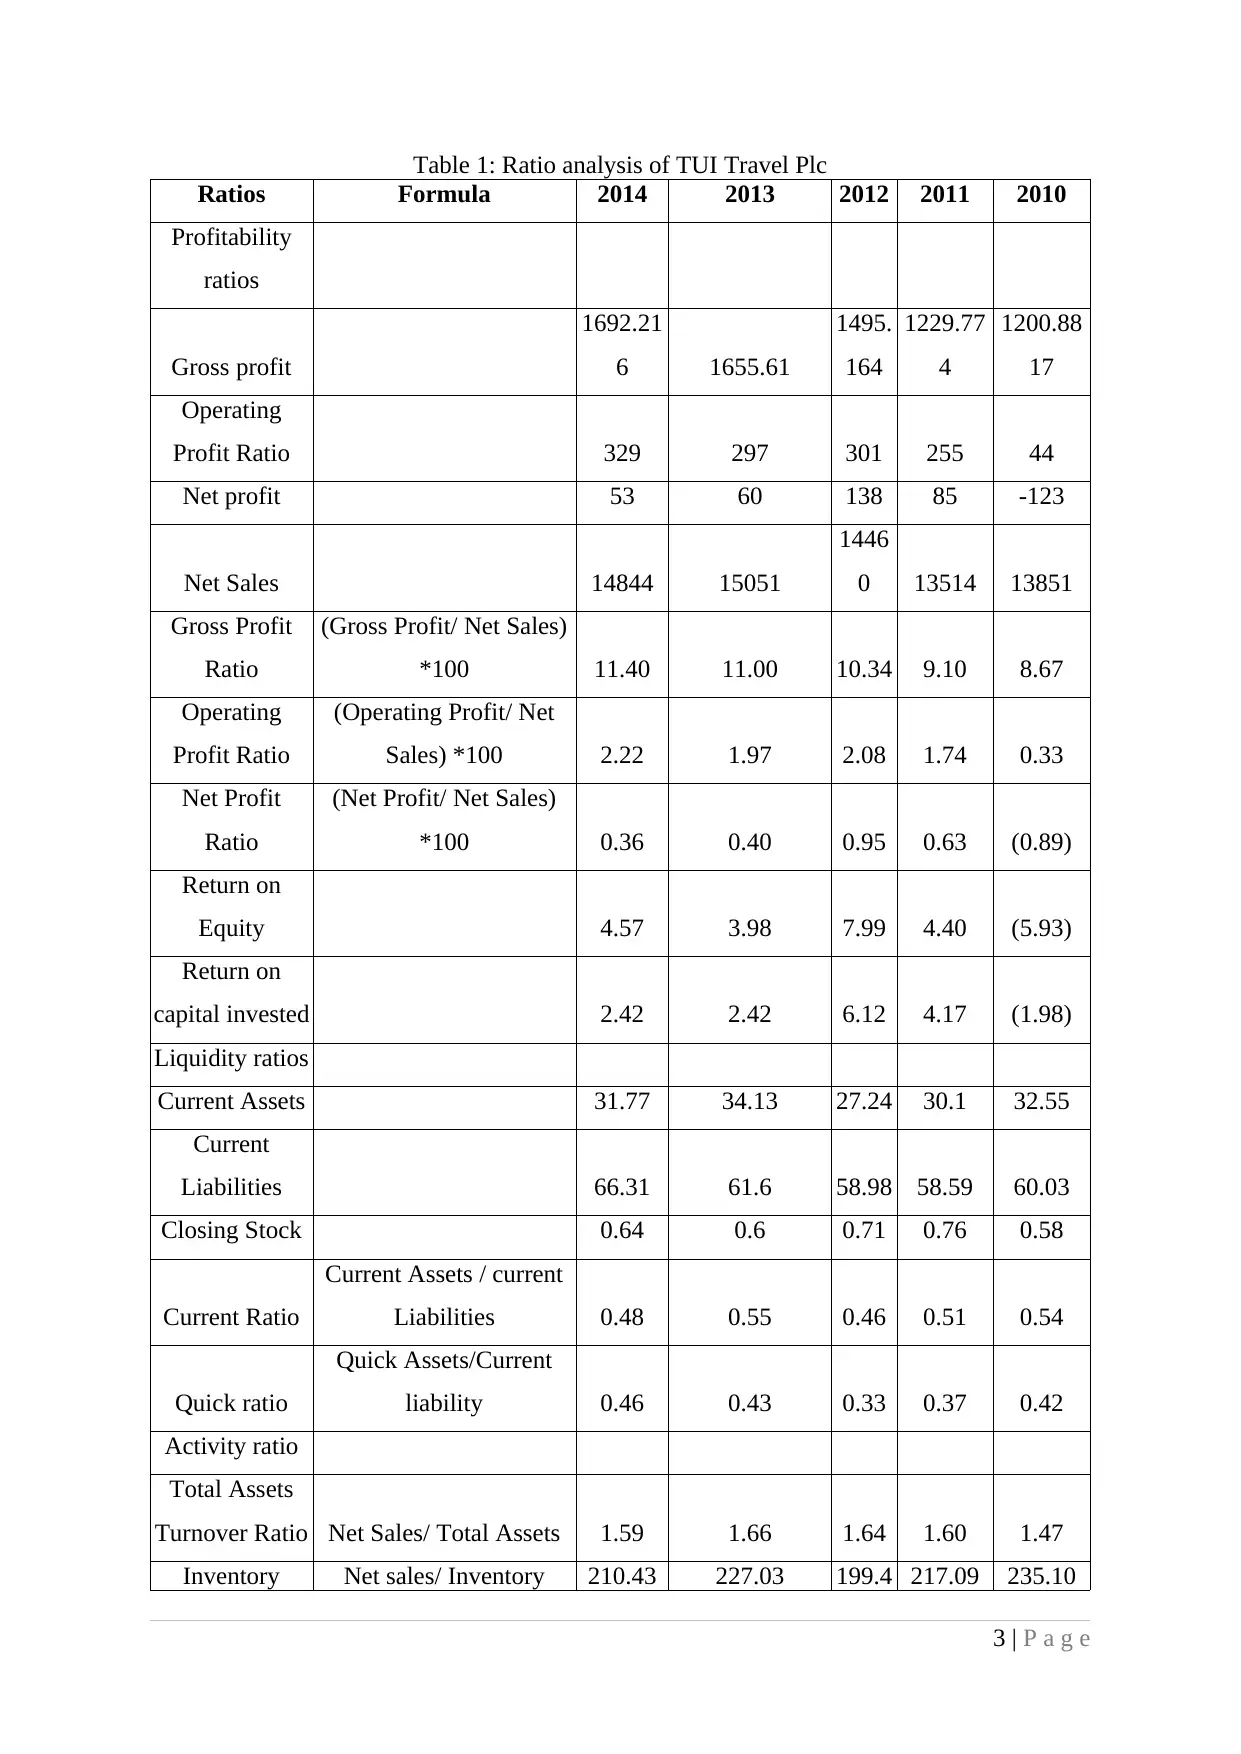
Table 1: Ratio analysis of TUI Travel Plc
Ratios Formula 2014 2013 2012 2011 2010
Profitability
ratios
Gross profit
1692.21
6 1655.61
1495.
164
1229.77
4
1200.88
17
Operating
Profit Ratio 329 297 301 255 44
Net profit 53 60 138 85 -123
Net Sales 14844 15051
1446
0 13514 13851
Gross Profit
Ratio
(Gross Profit/ Net Sales)
*100 11.40 11.00 10.34 9.10 8.67
Operating
Profit Ratio
(Operating Profit/ Net
Sales) *100 2.22 1.97 2.08 1.74 0.33
Net Profit
Ratio
(Net Profit/ Net Sales)
*100 0.36 0.40 0.95 0.63 (0.89)
Return on
Equity 4.57 3.98 7.99 4.40 (5.93)
Return on
capital invested 2.42 2.42 6.12 4.17 (1.98)
Liquidity ratios
Current Assets 31.77 34.13 27.24 30.1 32.55
Current
Liabilities 66.31 61.6 58.98 58.59 60.03
Closing Stock 0.64 0.6 0.71 0.76 0.58
Current Ratio
Current Assets / current
Liabilities 0.48 0.55 0.46 0.51 0.54
Quick ratio
Quick Assets/Current
liability 0.46 0.43 0.33 0.37 0.42
Activity ratio
Total Assets
Turnover Ratio Net Sales/ Total Assets 1.59 1.66 1.64 1.60 1.47
Inventory Net sales/ Inventory 210.43 227.03 199.4 217.09 235.10
3 | P a g e
⊘ This is a preview!⊘
Do you want full access?
Subscribe today to unlock all pages.
Trusted by 1+ million students worldwide
turnover ratio 6
Receivable
turnover Net sales/Receivable 9.27 31.79 28.66 26.73 22.66
Solvency Ratio
Debt 12.22 7.97 8.04 8.86 8.57
Equity 10.09 15.22 18.15 20.85 21.27
Debt Equity
Ratio Debt/ Equity 1.21 0.52 0.44 0.42 0.40
Investment
Ratios
earnings per
share 0.05 0.05 0.12 0.08 -0.11
Dividend 0.14 0.12 0.13 0.12 0.11
Share Market
price 1119 1118 1118 1118 1107
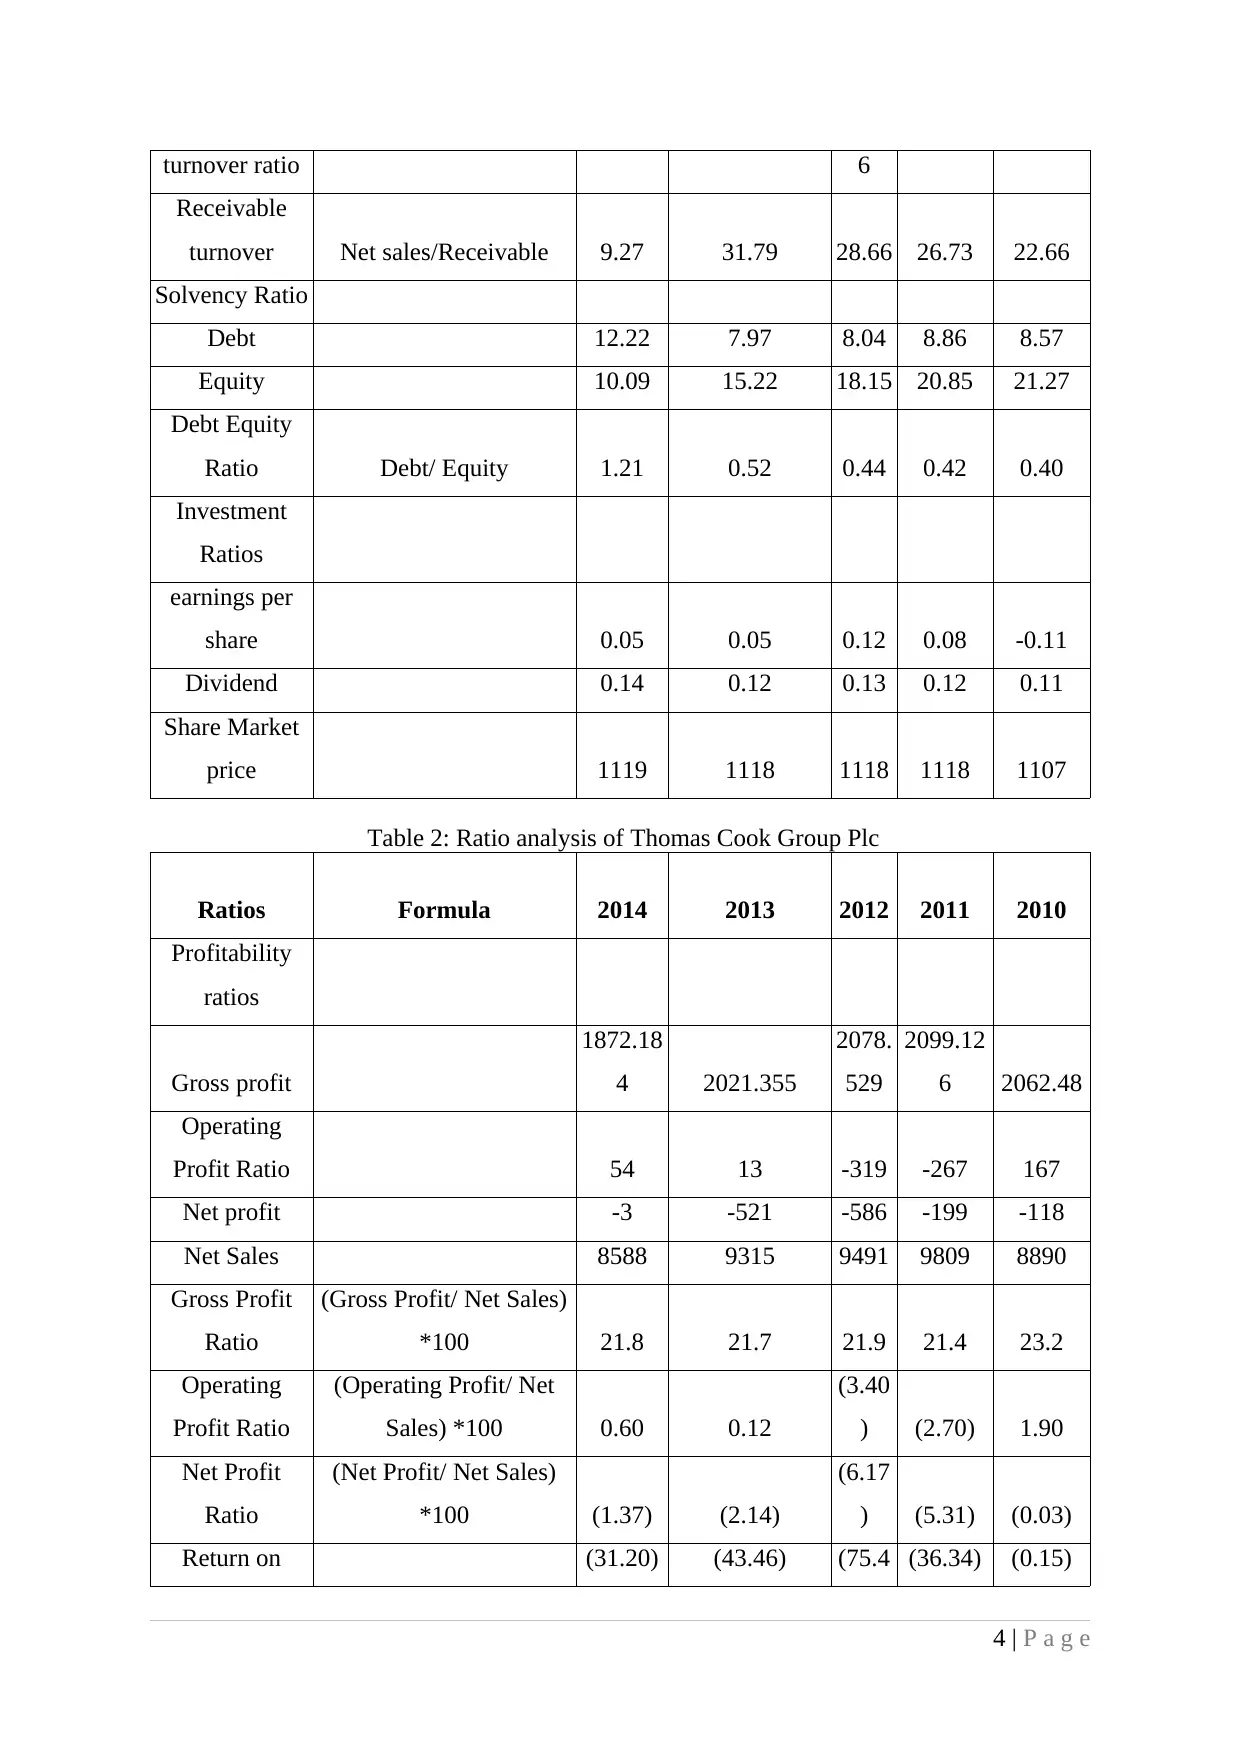
Table 2: Ratio analysis of Thomas Cook Group Plc
Ratios Formula 2014 2013 2012 2011 2010
Profitability
ratios
Gross profit
1872.18
4 2021.355
2078.
529
2099.12
6 2062.48
Operating
Profit Ratio 54 13 -319 -267 167
Net profit -3 -521 -586 -199 -118
Net Sales 8588 9315 9491 9809 8890
Gross Profit
Ratio
(Gross Profit/ Net Sales)
*100 21.8 21.7 21.9 21.4 23.2
Operating
Profit Ratio
(Operating Profit/ Net
Sales) *100 0.60 0.12
(3.40
) (2.70) 1.90
Net Profit
Ratio
(Net Profit/ Net Sales)
*100 (1.37) (2.14)
(6.17
) (5.31) (0.03)
Return on (31.20) (43.46) (75.4 (36.34) (0.15)
4 | P a g e
Receivable
turnover Net sales/Receivable 9.27 31.79 28.66 26.73 22.66
Solvency Ratio
Debt 12.22 7.97 8.04 8.86 8.57
Equity 10.09 15.22 18.15 20.85 21.27
Debt Equity
Ratio Debt/ Equity 1.21 0.52 0.44 0.42 0.40
Investment
Ratios
earnings per
share 0.05 0.05 0.12 0.08 -0.11
Dividend 0.14 0.12 0.13 0.12 0.11
Share Market
price 1119 1118 1118 1118 1107
Table 2: Ratio analysis of Thomas Cook Group Plc
Ratios Formula 2014 2013 2012 2011 2010
Profitability
ratios
Gross profit
1872.18
4 2021.355
2078.
529
2099.12
6 2062.48
Operating
Profit Ratio 54 13 -319 -267 167
Net profit -3 -521 -586 -199 -118
Net Sales 8588 9315 9491 9809 8890
Gross Profit
Ratio
(Gross Profit/ Net Sales)
*100 21.8 21.7 21.9 21.4 23.2
Operating
Profit Ratio
(Operating Profit/ Net
Sales) *100 0.60 0.12
(3.40
) (2.70) 1.90
Net Profit
Ratio
(Net Profit/ Net Sales)
*100 (1.37) (2.14)
(6.17
) (5.31) (0.03)
Return on (31.20) (43.46) (75.4 (36.34) (0.15)
4 | P a g e
Paraphrase This Document
Need a fresh take? Get an instant paraphrase of this document with our AI Paraphraser
Equity 3)
Return on
capital invested 0.94 (5.63)
(26.0
3) (17.26) 2.09
Liquidity ratios
Current Assets 31.57 31.87 25.8 24.6 21.21
Current
Liabilities 67.21 58.95 59.93 56.56 49.05
Closing Stock 0.64 0.6 0.71 0.76 0.58
Current Ratio
Current Assets / current
Liabilities 0.47 0.54 0.43 0.43 0.43
Quick ratio
Quick Assets/Current
liability 0.36 0.51 0.25 0.28 0.29
Activity ratio
Total Assets
Turnover Ratio Net Sales/ Total Assets 1.42 1.53 1.51 1.44 1.27
Inventory
turnover ratio Net sales/ Inventory 216.08 248.52
214.3
3 217.83 231.05
Receivable
turnover Net sales/Receivable 32.87 31.69 27.32 26.9 23.83
Solvency Ratio
Debt 12.34 17.72 16.55 15.4 14.79
Equity 4.26 8.1 6.88 17.14 24.91
Debt Equity
Ratio Debt/ Equity 2.9 2.19 2.41 0.90 0.59
Investment
Ratios
earnings per
share -0.08 -0.17 -0.67 -0.61 -
Dividend - - - 0.08 0.08
Share Market
price 1464 1196 872 858 854
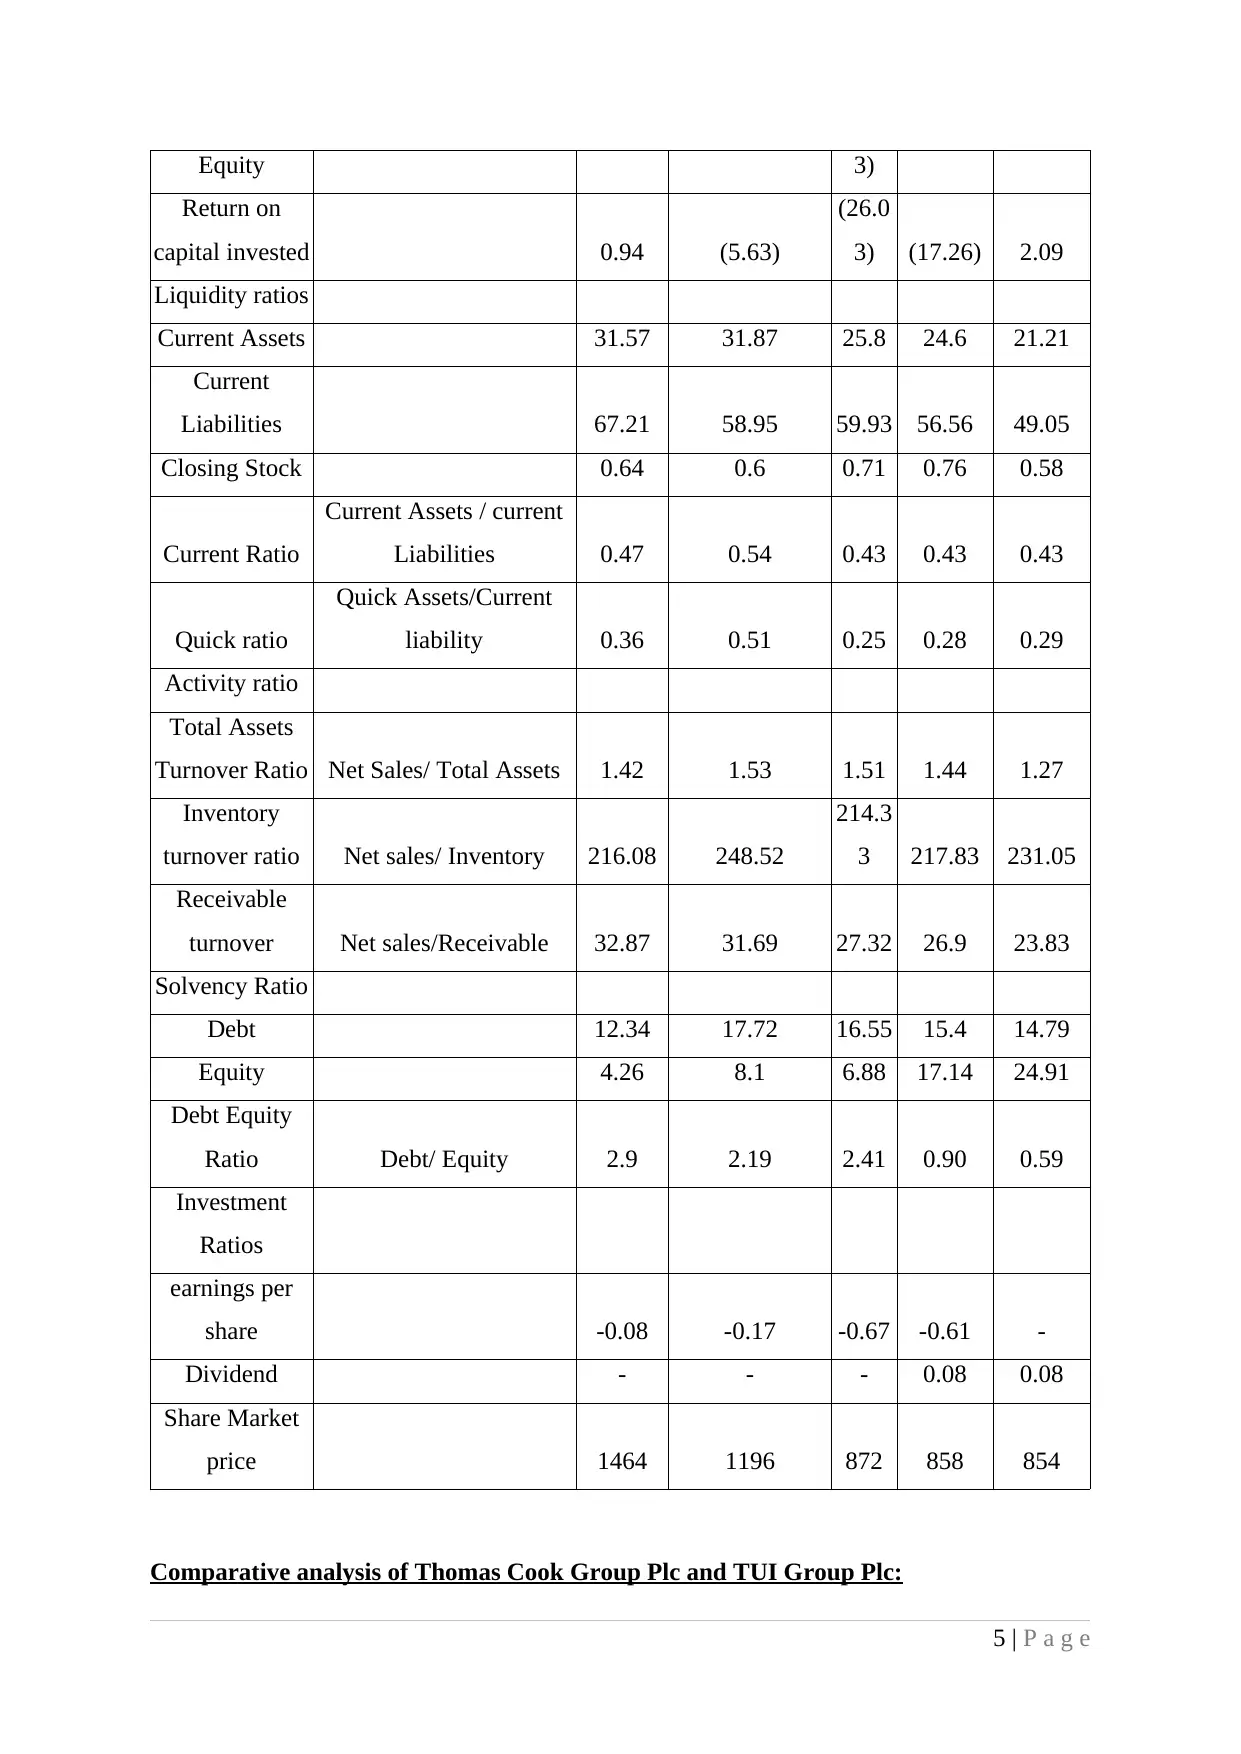
Comparative analysis of Thomas Cook Group Plc and TUI Group Plc:
5 | P a g e
Return on
capital invested 0.94 (5.63)
(26.0
3) (17.26) 2.09
Liquidity ratios
Current Assets 31.57 31.87 25.8 24.6 21.21
Current
Liabilities 67.21 58.95 59.93 56.56 49.05
Closing Stock 0.64 0.6 0.71 0.76 0.58
Current Ratio
Current Assets / current
Liabilities 0.47 0.54 0.43 0.43 0.43
Quick ratio
Quick Assets/Current
liability 0.36 0.51 0.25 0.28 0.29
Activity ratio
Total Assets
Turnover Ratio Net Sales/ Total Assets 1.42 1.53 1.51 1.44 1.27
Inventory
turnover ratio Net sales/ Inventory 216.08 248.52
214.3
3 217.83 231.05
Receivable
turnover Net sales/Receivable 32.87 31.69 27.32 26.9 23.83
Solvency Ratio
Debt 12.34 17.72 16.55 15.4 14.79
Equity 4.26 8.1 6.88 17.14 24.91
Debt Equity
Ratio Debt/ Equity 2.9 2.19 2.41 0.90 0.59
Investment
Ratios
earnings per
share -0.08 -0.17 -0.67 -0.61 -
Dividend - - - 0.08 0.08
Share Market
price 1464 1196 872 858 854
Comparative analysis of Thomas Cook Group Plc and TUI Group Plc:
5 | P a g e
Comparative analysis of Thomas Cook Group Plc and TUI Group Plc is stated as under:
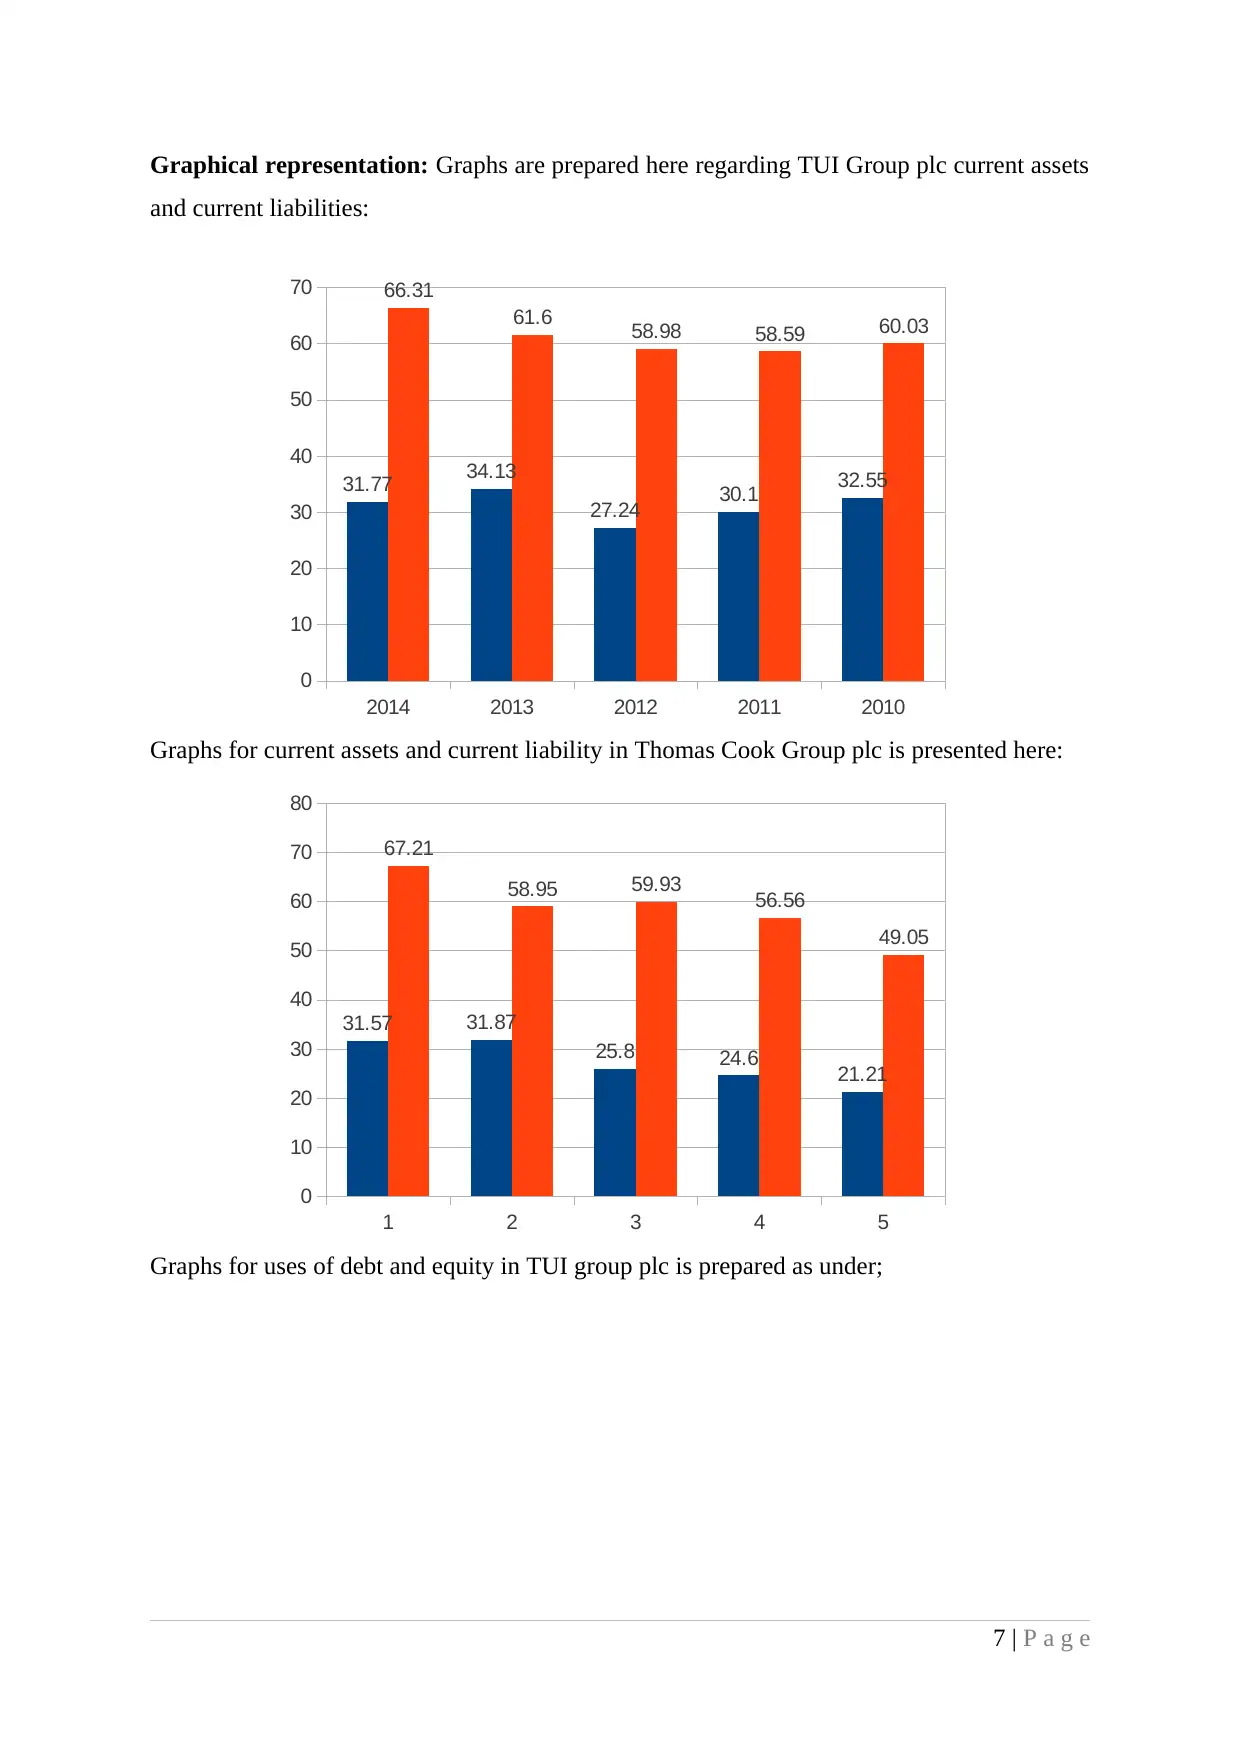
Profitability ratio: TUI Group plc’s gross profit margin gets increased from 8.67 to
11.40. However, Thomas Cook’s gross profitability gets decreased to 23.2 to 21.8 although it
is higher than TUI Group. Further, the net profit ratio of TUI Group and Thomas cook are
0.36 and (1.37) respectively in the year 2014. On the contrary, the operating profit ratio of
Thomas cook is 0.60 while TUI group has operating profit ratio to 2.22. Return on equity and
capital invested of TUI Group is higher than Thomas Cook (Choi and Meek, 2011). All the
profitability ratios except gross profit ratio indicates that TUI Group plc is performing better
due to higher profitability. However, Gross profit margin indicates that Thomas cook is
earning higher amount of gross profit on the business sales.
Liquidity ratio: The current and quick ratio of TUI Group plc gets changed from 0.54
to 0.48 and 0.42 to 0.46. However, Thomas cook Group plc current ratio gets increased from
0.43 to 0.47 while quick ratio gets increased from 0.29 to 0.36 respectively. It indicates that
TUI group plc has liquid position which is quiet higher as compared to Thomas cook. It
indicates that TUI Group solvency position is quiet good (Elliott and Elliott, 2007). Further,
the increased liquidity ratio of Thomas cook indicates that company is increasing its liquidity.
Efficiency ratio: Total assets turnover ratio of TUI group was decreased in the year
2014 from 1.66 to 1.59. However, Thomas Cook’s total assets turnover ratio declined from
1.53 to 1.42 in the year 2014. It shows that TUI Group is using its assets in an efficient
manner (Stickney and et. al., 2009). Moreover, TUI Group plc inventory and receivable
turnover ratio are 210.43 and 9.27 respectively while Thomas Cook Group plc has 216.08
and 32.87. It indicates that Thomas Cook is using its inventory and debtors efficiently as
compared to TUI Group plc.
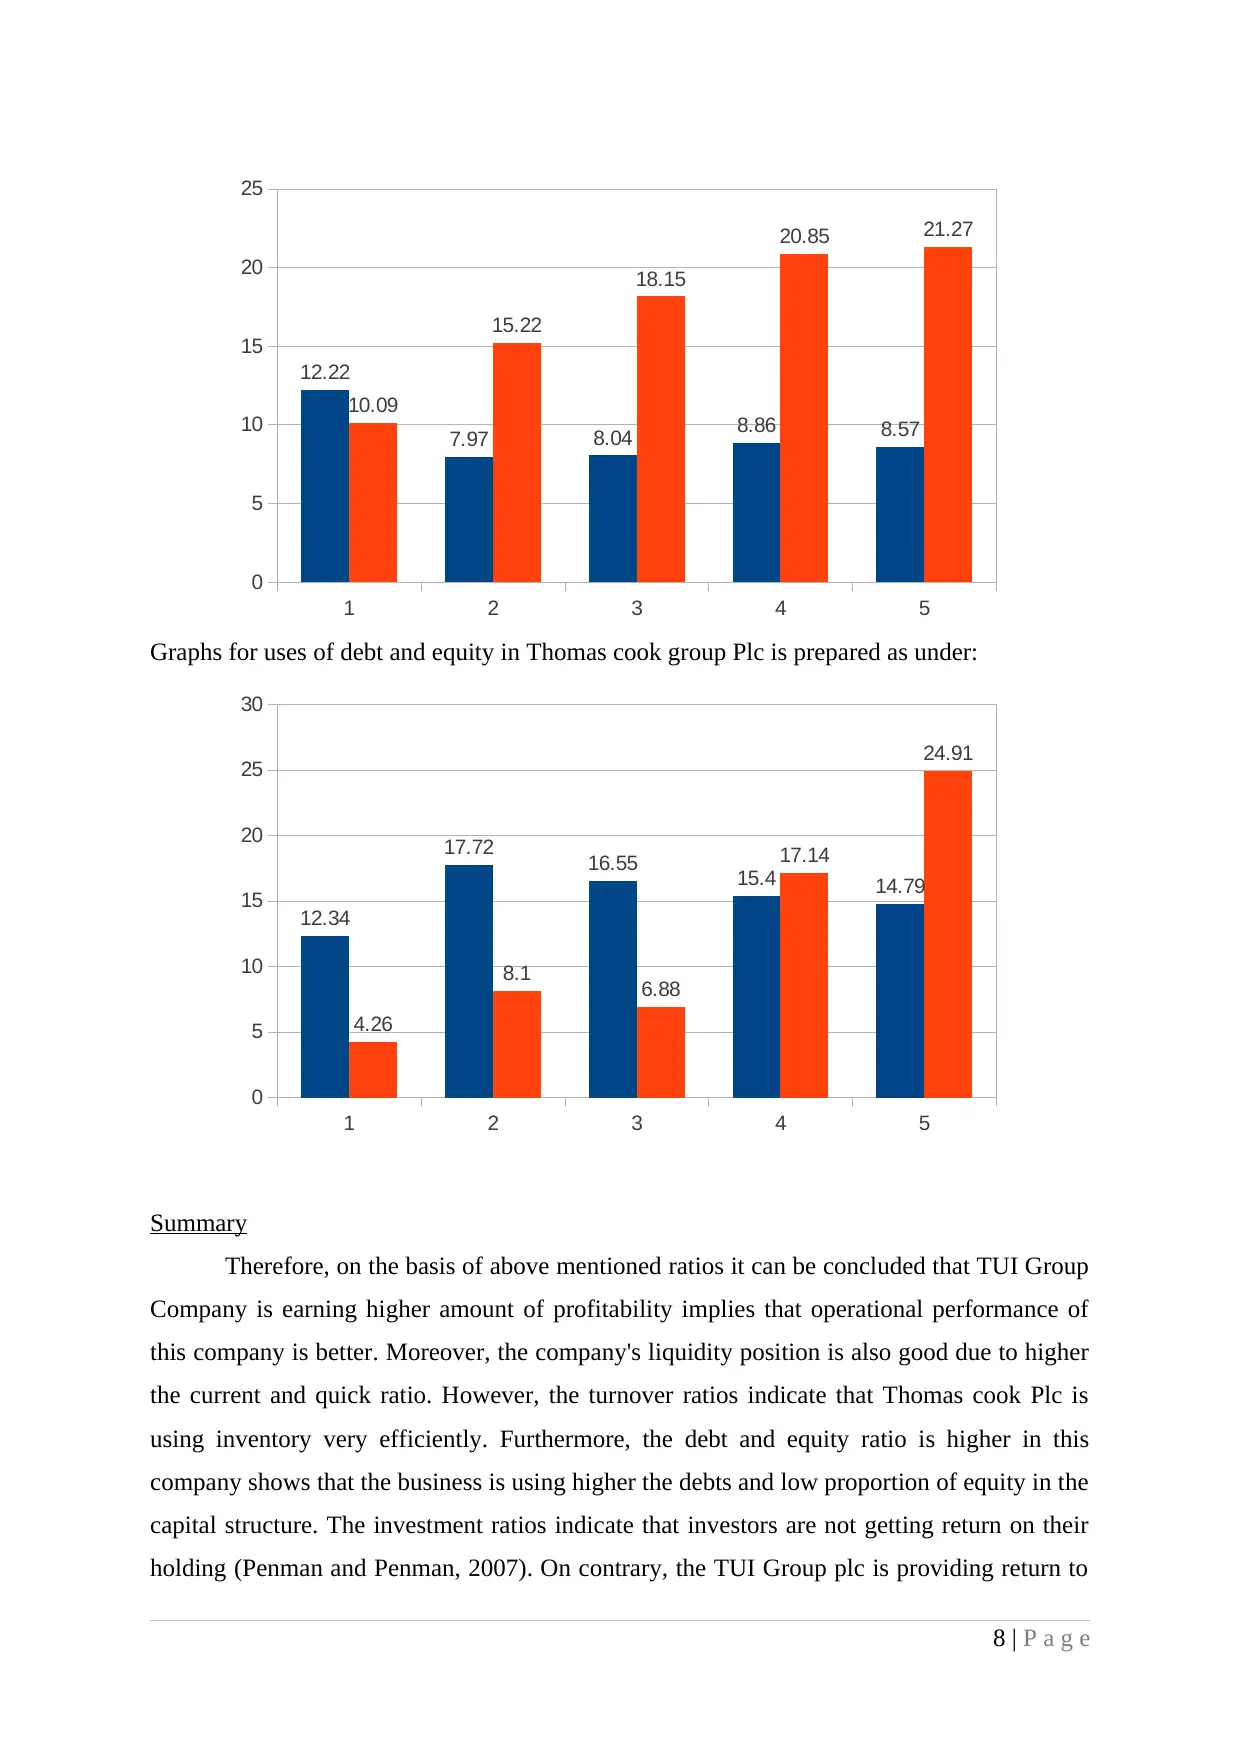
Gearing ratio: TUI Group debt to equity ratio was 0.40 in the year 2010 which
inclined to 1.21 in the year 2014 (TUI Group Plc Annual report, 2014). On the contrary,
Thomas Cook plc gearing ratio was 0.59 in 2010 that get inclined to 2.90 in the year 2014. It
is higher in Thomas Group implies that it is using higher the debt and lower the equity in its
capital structure.
Investment ratio: Thomas Cook company do not providing any return to the
shareholders due to net loss. However, TUI Group plc company's earnings per share is 0.05
and dividend is 0.14 in the year 2014. However, the market price of share is higher in case of
Thomas Cook to 1464 (Thomas Cook group Annual Reports, 2014). On the other hand, TUI
Group plc share price is 1119 in the year 2014. It implies that shareholders getting return in
TUI Group plc due to profit availability (Edwards, 2013).
6 | P a g e
Profitability ratio: TUI Group plc’s gross profit margin gets increased from 8.67 to
11.40. However, Thomas Cook’s gross profitability gets decreased to 23.2 to 21.8 although it
is higher than TUI Group. Further, the net profit ratio of TUI Group and Thomas cook are
0.36 and (1.37) respectively in the year 2014. On the contrary, the operating profit ratio of
Thomas cook is 0.60 while TUI group has operating profit ratio to 2.22. Return on equity and
capital invested of TUI Group is higher than Thomas Cook (Choi and Meek, 2011). All the
profitability ratios except gross profit ratio indicates that TUI Group plc is performing better
due to higher profitability. However, Gross profit margin indicates that Thomas cook is
earning higher amount of gross profit on the business sales.
Liquidity ratio: The current and quick ratio of TUI Group plc gets changed from 0.54
to 0.48 and 0.42 to 0.46. However, Thomas cook Group plc current ratio gets increased from
0.43 to 0.47 while quick ratio gets increased from 0.29 to 0.36 respectively. It indicates that
TUI group plc has liquid position which is quiet higher as compared to Thomas cook. It
indicates that TUI Group solvency position is quiet good (Elliott and Elliott, 2007). Further,
the increased liquidity ratio of Thomas cook indicates that company is increasing its liquidity.
Efficiency ratio: Total assets turnover ratio of TUI group was decreased in the year
2014 from 1.66 to 1.59. However, Thomas Cook’s total assets turnover ratio declined from
1.53 to 1.42 in the year 2014. It shows that TUI Group is using its assets in an efficient
manner (Stickney and et. al., 2009). Moreover, TUI Group plc inventory and receivable
turnover ratio are 210.43 and 9.27 respectively while Thomas Cook Group plc has 216.08
and 32.87. It indicates that Thomas Cook is using its inventory and debtors efficiently as
compared to TUI Group plc.
Gearing ratio: TUI Group debt to equity ratio was 0.40 in the year 2010 which
inclined to 1.21 in the year 2014 (TUI Group Plc Annual report, 2014). On the contrary,
Thomas Cook plc gearing ratio was 0.59 in 2010 that get inclined to 2.90 in the year 2014. It
is higher in Thomas Group implies that it is using higher the debt and lower the equity in its
capital structure.
Investment ratio: Thomas Cook company do not providing any return to the
shareholders due to net loss. However, TUI Group plc company's earnings per share is 0.05
and dividend is 0.14 in the year 2014. However, the market price of share is higher in case of
Thomas Cook to 1464 (Thomas Cook group Annual Reports, 2014). On the other hand, TUI
Group plc share price is 1119 in the year 2014. It implies that shareholders getting return in
TUI Group plc due to profit availability (Edwards, 2013).
6 | P a g e
⊘ This is a preview!⊘
Do you want full access?
Subscribe today to unlock all pages.
Trusted by 1+ million students worldwide
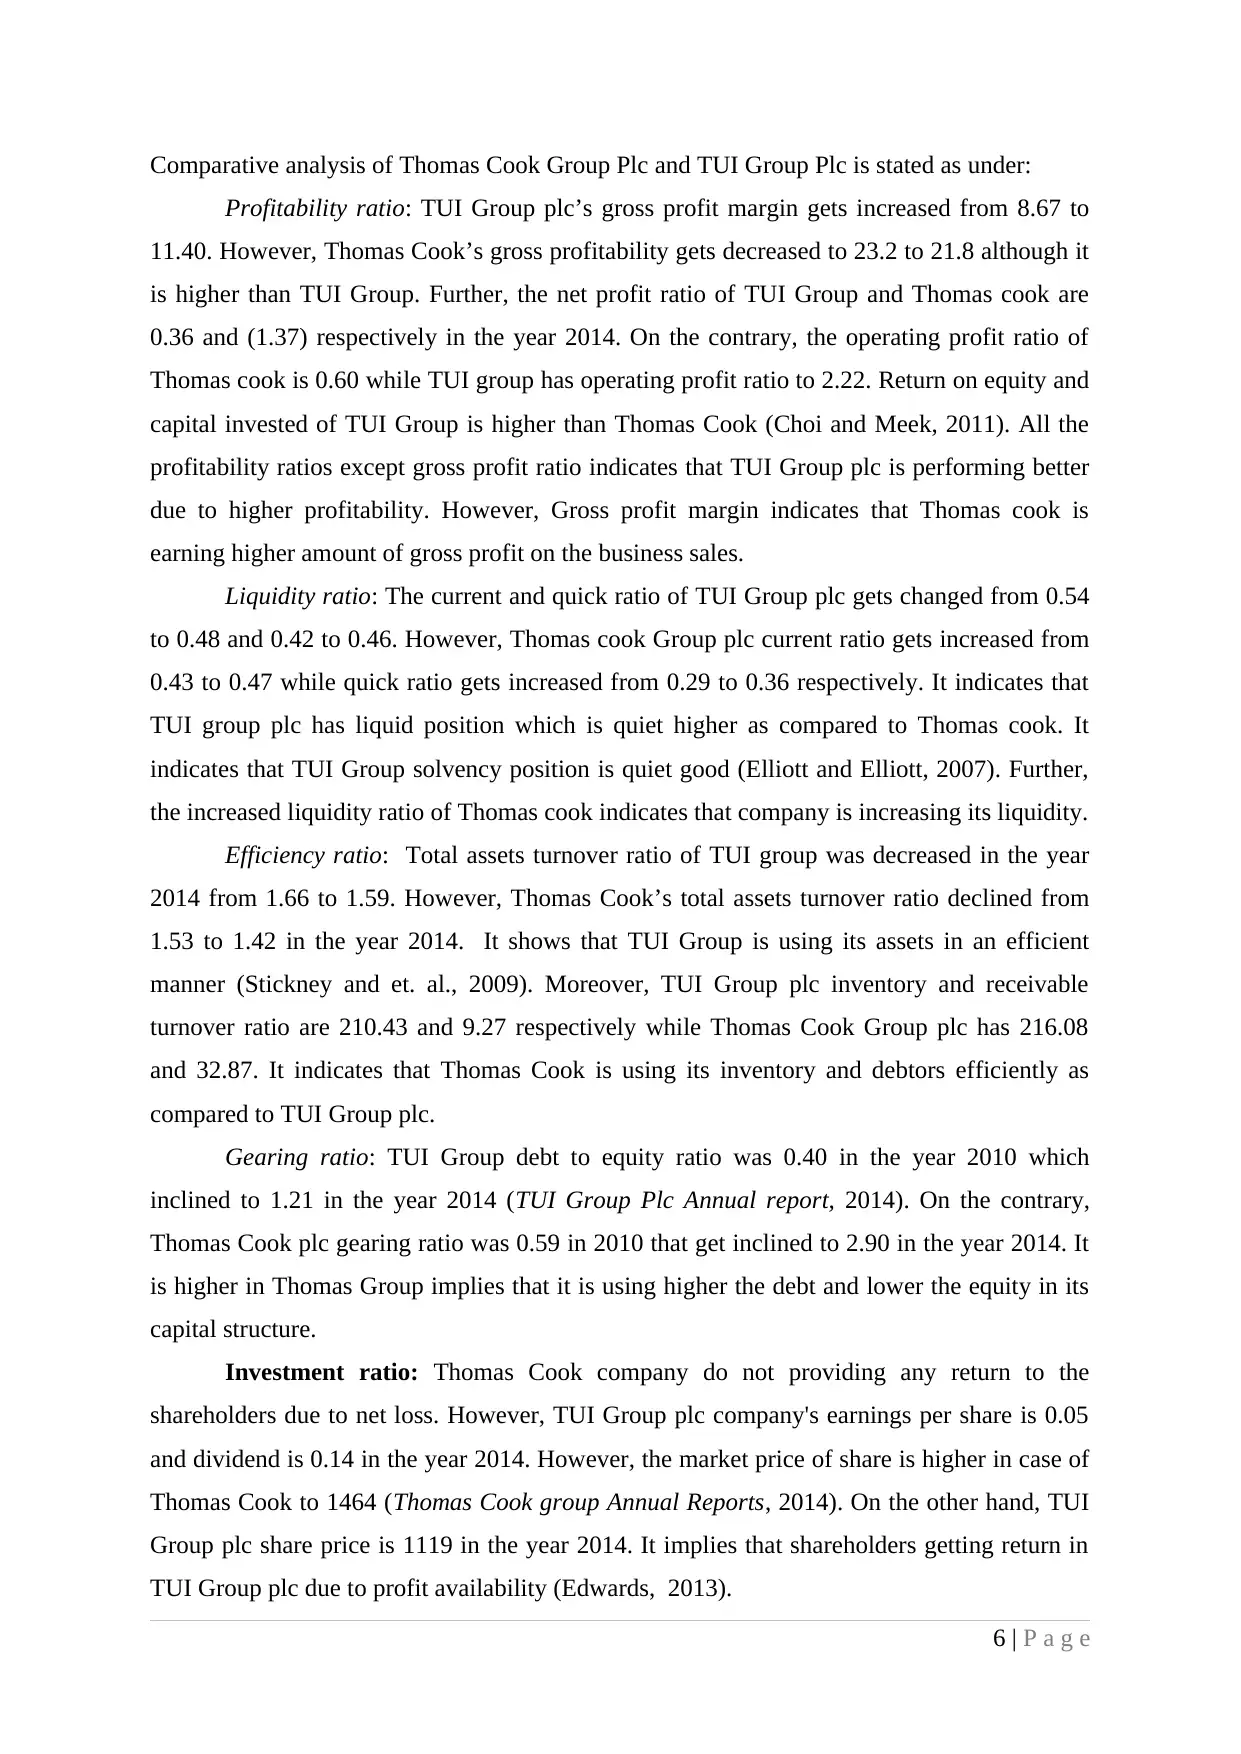
Graphical representation: Graphs are prepared here regarding TUI Group plc current assets
and current liabilities:
Graphs for current assets and current liability in Thomas Cook Group plc is presented here:
Graphs for uses of debt and equity in TUI group plc is prepared as under;
7 | P a g e
2014 2013 2012 2011 2010
0
10
20
30
40
50
60
70
31.77 34.13
27.24 30.1 32.55
66.31
61.6 58.98 58.59 60.03
1 2 3 4 5
0
10
20
30
40
50
60
70
80
31.57 31.87
25.8 24.6 21.21
67.21
58.95 59.93 56.56
49.05
Paraphrase This Document
Need a fresh take? Get an instant paraphrase of this document with our AI Paraphraser
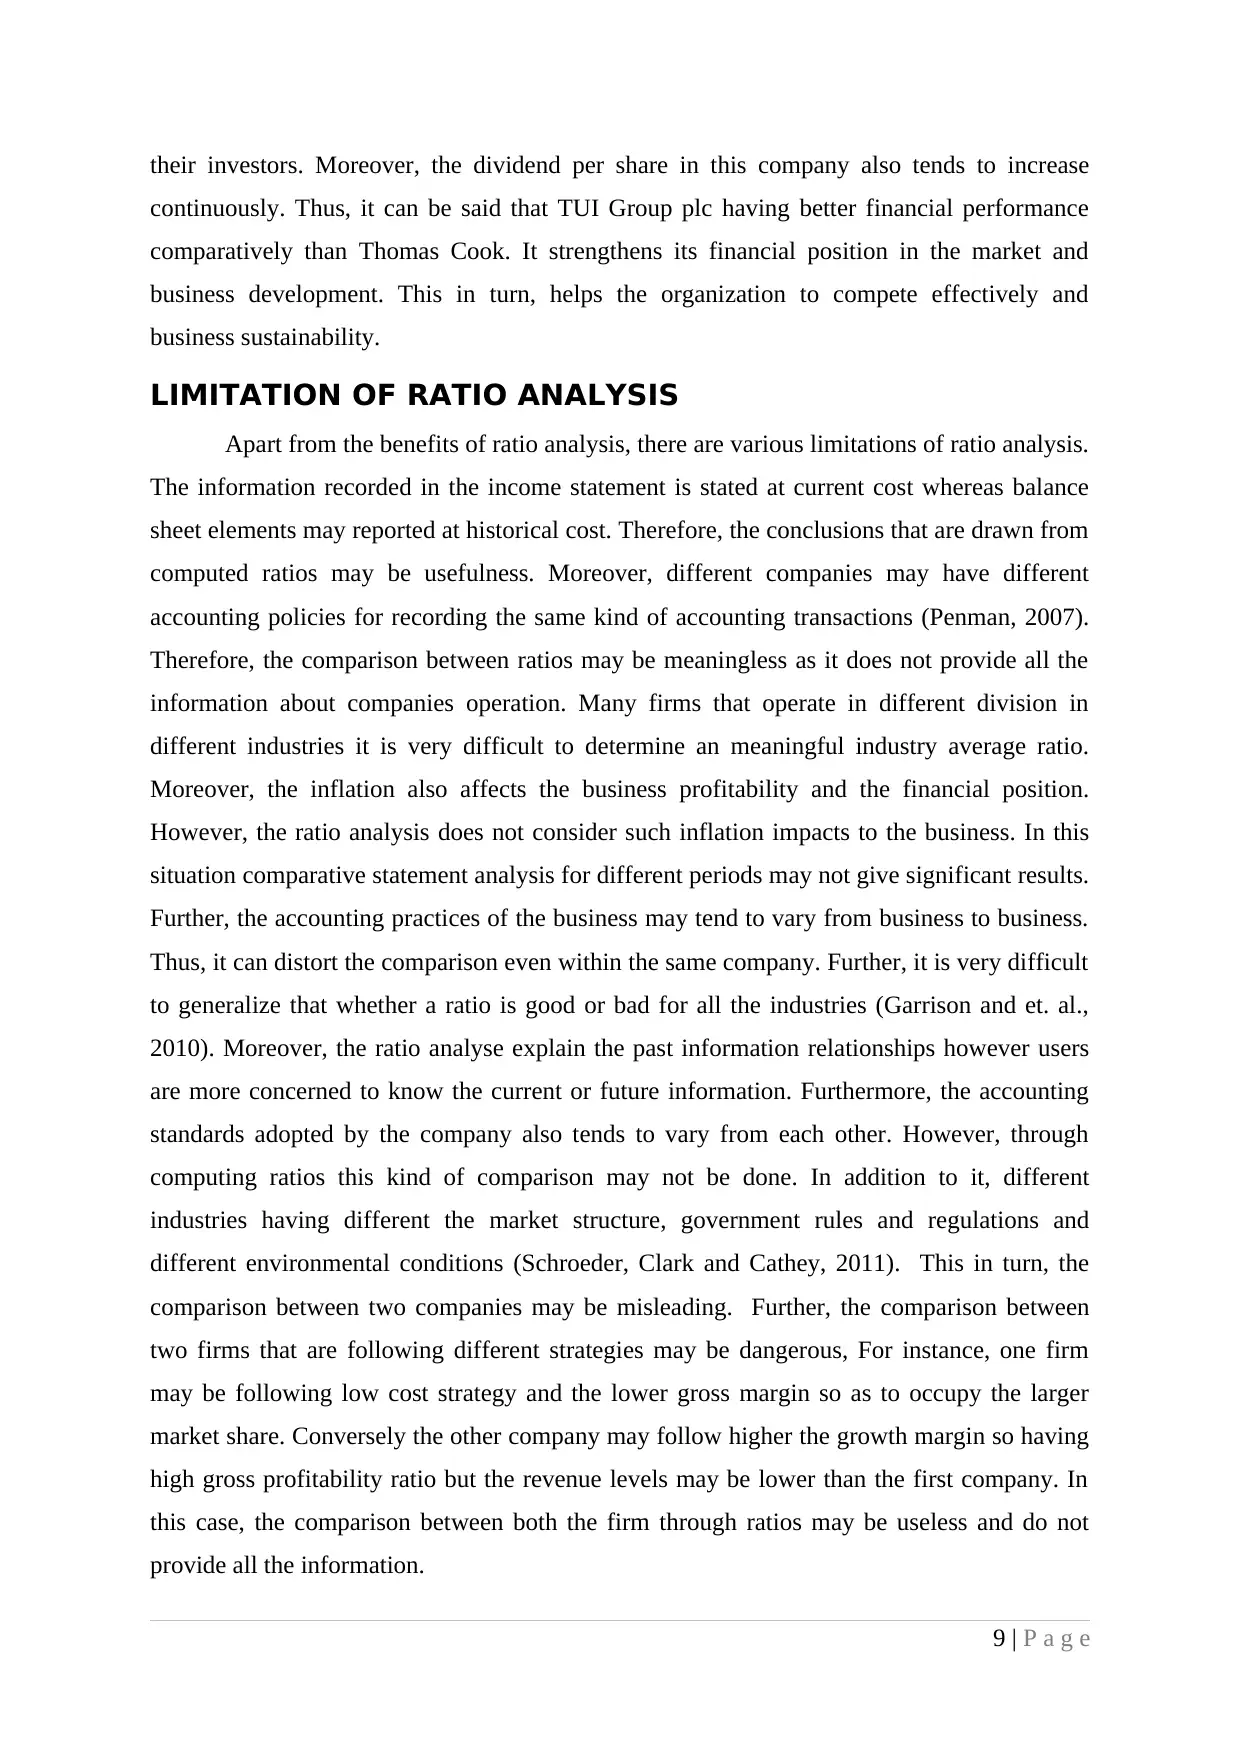
Graphs for uses of debt and equity in Thomas cook group Plc is prepared as under:
Summary
Therefore, on the basis of above mentioned ratios it can be concluded that TUI Group
Company is earning higher amount of profitability implies that operational performance of
this company is better. Moreover, the company's liquidity position is also good due to higher
the current and quick ratio. However, the turnover ratios indicate that Thomas cook Plc is
using inventory very efficiently. Furthermore, the debt and equity ratio is higher in this
company shows that the business is using higher the debts and low proportion of equity in the
capital structure. The investment ratios indicate that investors are not getting return on their
holding (Penman and Penman, 2007). On contrary, the TUI Group plc is providing return to
8 | P a g e
1 2 3 4 5
0
5
10
15
20
25
12.22
7.97 8.04 8.86 8.57
10.09
15.22
18.15
20.85 21.27
1 2 3 4 5
0
5
10
15
20
25
30
12.34
17.72 16.55 15.4 14.79
4.26
8.1 6.88
17.14
24.91
their investors. Moreover, the dividend per share in this company also tends to increase
continuously. Thus, it can be said that TUI Group plc having better financial performance
comparatively than Thomas Cook. It strengthens its financial position in the market and
business development. This in turn, helps the organization to compete effectively and
business sustainability.
LIMITATION OF RATIO ANALYSIS
Apart from the benefits of ratio analysis, there are various limitations of ratio analysis.
The information recorded in the income statement is stated at current cost whereas balance
sheet elements may reported at historical cost. Therefore, the conclusions that are drawn from
computed ratios may be usefulness. Moreover, different companies may have different
accounting policies for recording the same kind of accounting transactions (Penman, 2007).
Therefore, the comparison between ratios may be meaningless as it does not provide all the
information about companies operation. Many firms that operate in different division in
different industries it is very difficult to determine an meaningful industry average ratio.
Moreover, the inflation also affects the business profitability and the financial position.
However, the ratio analysis does not consider such inflation impacts to the business. In this
situation comparative statement analysis for different periods may not give significant results.
Further, the accounting practices of the business may tend to vary from business to business.
Thus, it can distort the comparison even within the same company. Further, it is very difficult
to generalize that whether a ratio is good or bad for all the industries (Garrison and et. al.,
2010). Moreover, the ratio analyse explain the past information relationships however users
are more concerned to know the current or future information. Furthermore, the accounting
standards adopted by the company also tends to vary from each other. However, through
computing ratios this kind of comparison may not be done. In addition to it, different
industries having different the market structure, government rules and regulations and
different environmental conditions (Schroeder, Clark and Cathey, 2011). This in turn, the
comparison between two companies may be misleading. Further, the comparison between
two firms that are following different strategies may be dangerous, For instance, one firm
may be following low cost strategy and the lower gross margin so as to occupy the larger
market share. Conversely the other company may follow higher the growth margin so having
high gross profitability ratio but the revenue levels may be lower than the first company. In
this case, the comparison between both the firm through ratios may be useless and do not
provide all the information.
9 | P a g e
⊘ This is a preview!⊘
Do you want full access?
Subscribe today to unlock all pages.
Trusted by 1+ million students worldwide
1 out of 15
Related Documents


Your All-in-One AI-Powered Toolkit for Academic Success.
+13062052269
info@desklib.com
Available 24*7 on WhatsApp / Email
![[object Object]](/_next/static/media/star-bottom.7253800d.svg)
Unlock your academic potential
Copyright © 2020–2026 A2Z Services. All Rights Reserved. Developed and managed by ZUCOL.