Finance for SME: Analyzing Trainline's Financial Performance Report
VerifiedAdded on 2020/02/05
|12
|3877
|41
Report
AI Summary
This report provides a comprehensive financial analysis of Trainline, a Small and Medium Enterprise (SME). It begins with a critical analysis of the company's performance from 2013 to 2016 using ratio analysis, evaluating trends in gross profit ratio, net profit ratio, current ratio, stock turnover ratio, and return on equity. The report then delves into preparing a budget and exploring sources of finance for Trainline, including a cash budget for 2017-2019. It evaluates various financing options and project evaluation methods. The report also discusses the entrepreneurial ecosystem's influence on Trainline's development and concludes with a critical examination of ethical considerations for a potential Initial Public Offering (IPO). The analysis highlights key financial metrics, trends, and their implications for the company's performance and strategic decisions.
FINANCE FOR SME
Paraphrase This Document
Need a fresh take? Get an instant paraphrase of this document with our AI Paraphraser
TABLE OF CONTENTS
INTRODUCTION...........................................................................................................................3
Question 1........................................................................................................................................3
Critically analyses the company performance using ratio analysis over the period 2013 - 2016.
For each year calculate 6 ratios only, and show the trend for these ratios over the 5 years........3
Question 2........................................................................................................................................6
Preparing a budget and sources of finance..................................................................................6
Question 3........................................................................................................................................7
Evaluating sources of finance and project evaluation methods...................................................7
Question 4........................................................................................................................................8
Discuss the extent to which the entrepreneurial ecosystem has been responsible for the
development of TrainLine as a business......................................................................................8
Question 5........................................................................................................................................9
Critically discuss the ethical considerations that should be taken into account in assessing
when the TrainLine should go for IPO........................................................................................9
CONCLUSION................................................................................................................................9
REFERENCES..............................................................................................................................11
INTRODUCTION
Finance is the factor that greatly affect any business firm. In the current research study ratio
analysis is done and firm business performance is measured. Comments are made on same by
evaluating facts and figures of last five years. In middle part of the report, sources of finance are
discussed and same are evaluated in context of firm Trainline. At end of the report, ethical
factors that must be considered for launching an IPO are discussed briefly. In this way entire
research work is done.
Question 1
Critically analyses the company performance using ratio analysis over the period 2013 - 2016.
For each year calculate 6 ratios only, and show the trend for these ratios over the 5 years
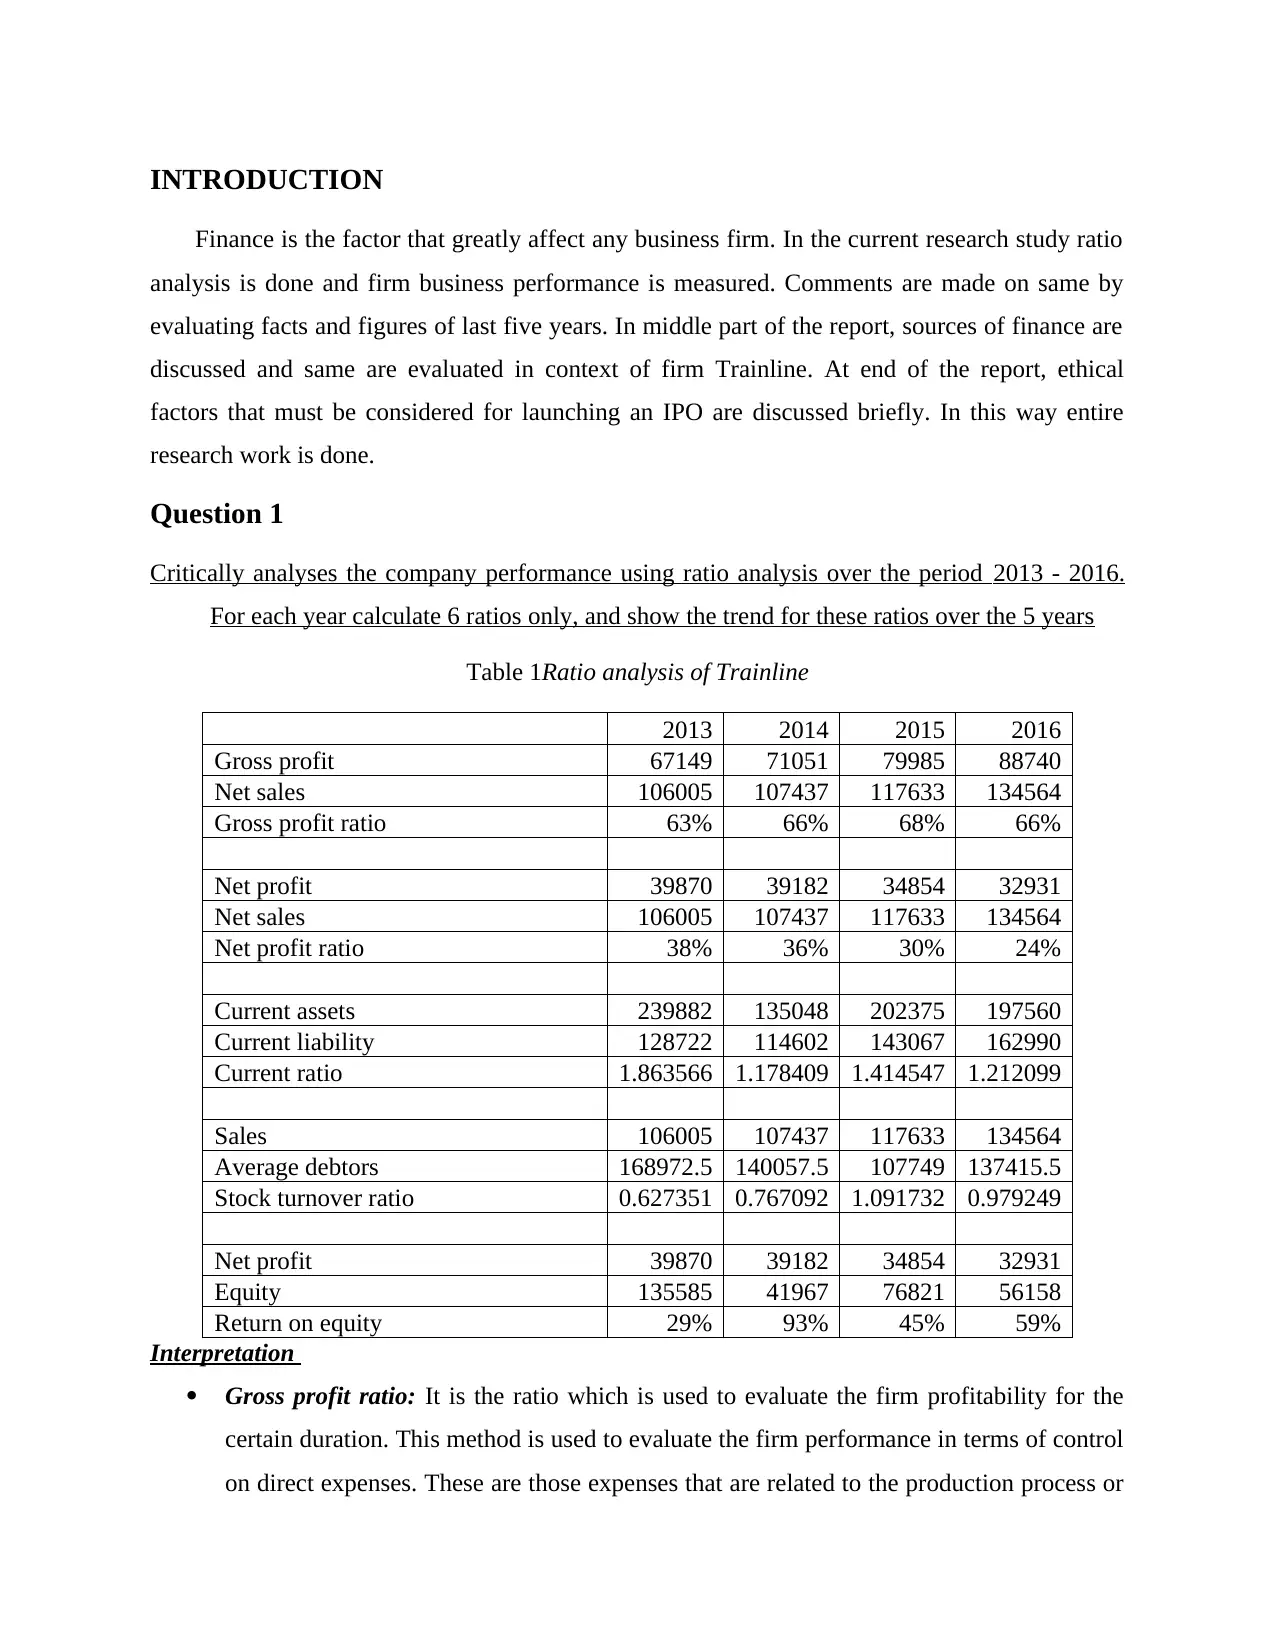
Table 1Ratio analysis of Trainline
2013 2014 2015 2016
Gross profit 67149 71051 79985 88740
Net sales 106005 107437 117633 134564
Gross profit ratio 63% 66% 68% 66%
Net profit 39870 39182 34854 32931
Net sales 106005 107437 117633 134564
Net profit ratio 38% 36% 30% 24%
Current assets 239882 135048 202375 197560
Current liability 128722 114602 143067 162990
Current ratio 1.863566 1.178409 1.414547 1.212099
Sales 106005 107437 117633 134564
Average debtors 168972.5 140057.5 107749 137415.5
Stock turnover ratio 0.627351 0.767092 1.091732 0.979249
Net profit 39870 39182 34854 32931
Equity 135585 41967 76821 56158
Return on equity 29% 93% 45% 59%
Interpretation
Gross profit ratio: It is the ratio which is used to evaluate the firm profitability for the
certain duration. This method is used to evaluate the firm performance in terms of control
on direct expenses. These are those expenses that are related to the production process or
Finance is the factor that greatly affect any business firm. In the current research study ratio
analysis is done and firm business performance is measured. Comments are made on same by
evaluating facts and figures of last five years. In middle part of the report, sources of finance are
discussed and same are evaluated in context of firm Trainline. At end of the report, ethical
factors that must be considered for launching an IPO are discussed briefly. In this way entire
research work is done.
Question 1
Critically analyses the company performance using ratio analysis over the period 2013 - 2016.
For each year calculate 6 ratios only, and show the trend for these ratios over the 5 years
Table 1Ratio analysis of Trainline
2013 2014 2015 2016
Gross profit 67149 71051 79985 88740
Net sales 106005 107437 117633 134564
Gross profit ratio 63% 66% 68% 66%
Net profit 39870 39182 34854 32931
Net sales 106005 107437 117633 134564
Net profit ratio 38% 36% 30% 24%
Current assets 239882 135048 202375 197560
Current liability 128722 114602 143067 162990
Current ratio 1.863566 1.178409 1.414547 1.212099
Sales 106005 107437 117633 134564
Average debtors 168972.5 140057.5 107749 137415.5
Stock turnover ratio 0.627351 0.767092 1.091732 0.979249
Net profit 39870 39182 34854 32931
Equity 135585 41967 76821 56158
Return on equity 29% 93% 45% 59%
Interpretation
Gross profit ratio: It is the ratio which is used to evaluate the firm profitability for the
certain duration. This method is used to evaluate the firm performance in terms of control
on direct expenses. These are those expenses that are related to the production process or
⊘ This is a preview!⊘
Do you want full access?
Subscribe today to unlock all pages.
Trusted by 1+ million students worldwide
service delivery. Table given above is indicating that gross profit percentage is increasing
from 63% to 66%. It is clear that there is almost little gap in the values of the ratios from
FY 2013 to 16. It must be noted that gross profit ratio remain stable in the range of 63%
to 66%. However, in the current fiscal year some decline is observed in the gross profit
ratio. In the FY 2013 ratio was 63% which increased to 66% in the next year, value
plunged by 3% on year on year basis. Further, ratio value increased to 68% and growth
rate in the gross profit ratio reduced to 2% from 3% on year on year basis. Finally, this
growth rate comes to end in the FY 2016 from 68% to 66%. However, such decline is not
so huge and it can be said that firm maintain stability in its performance.
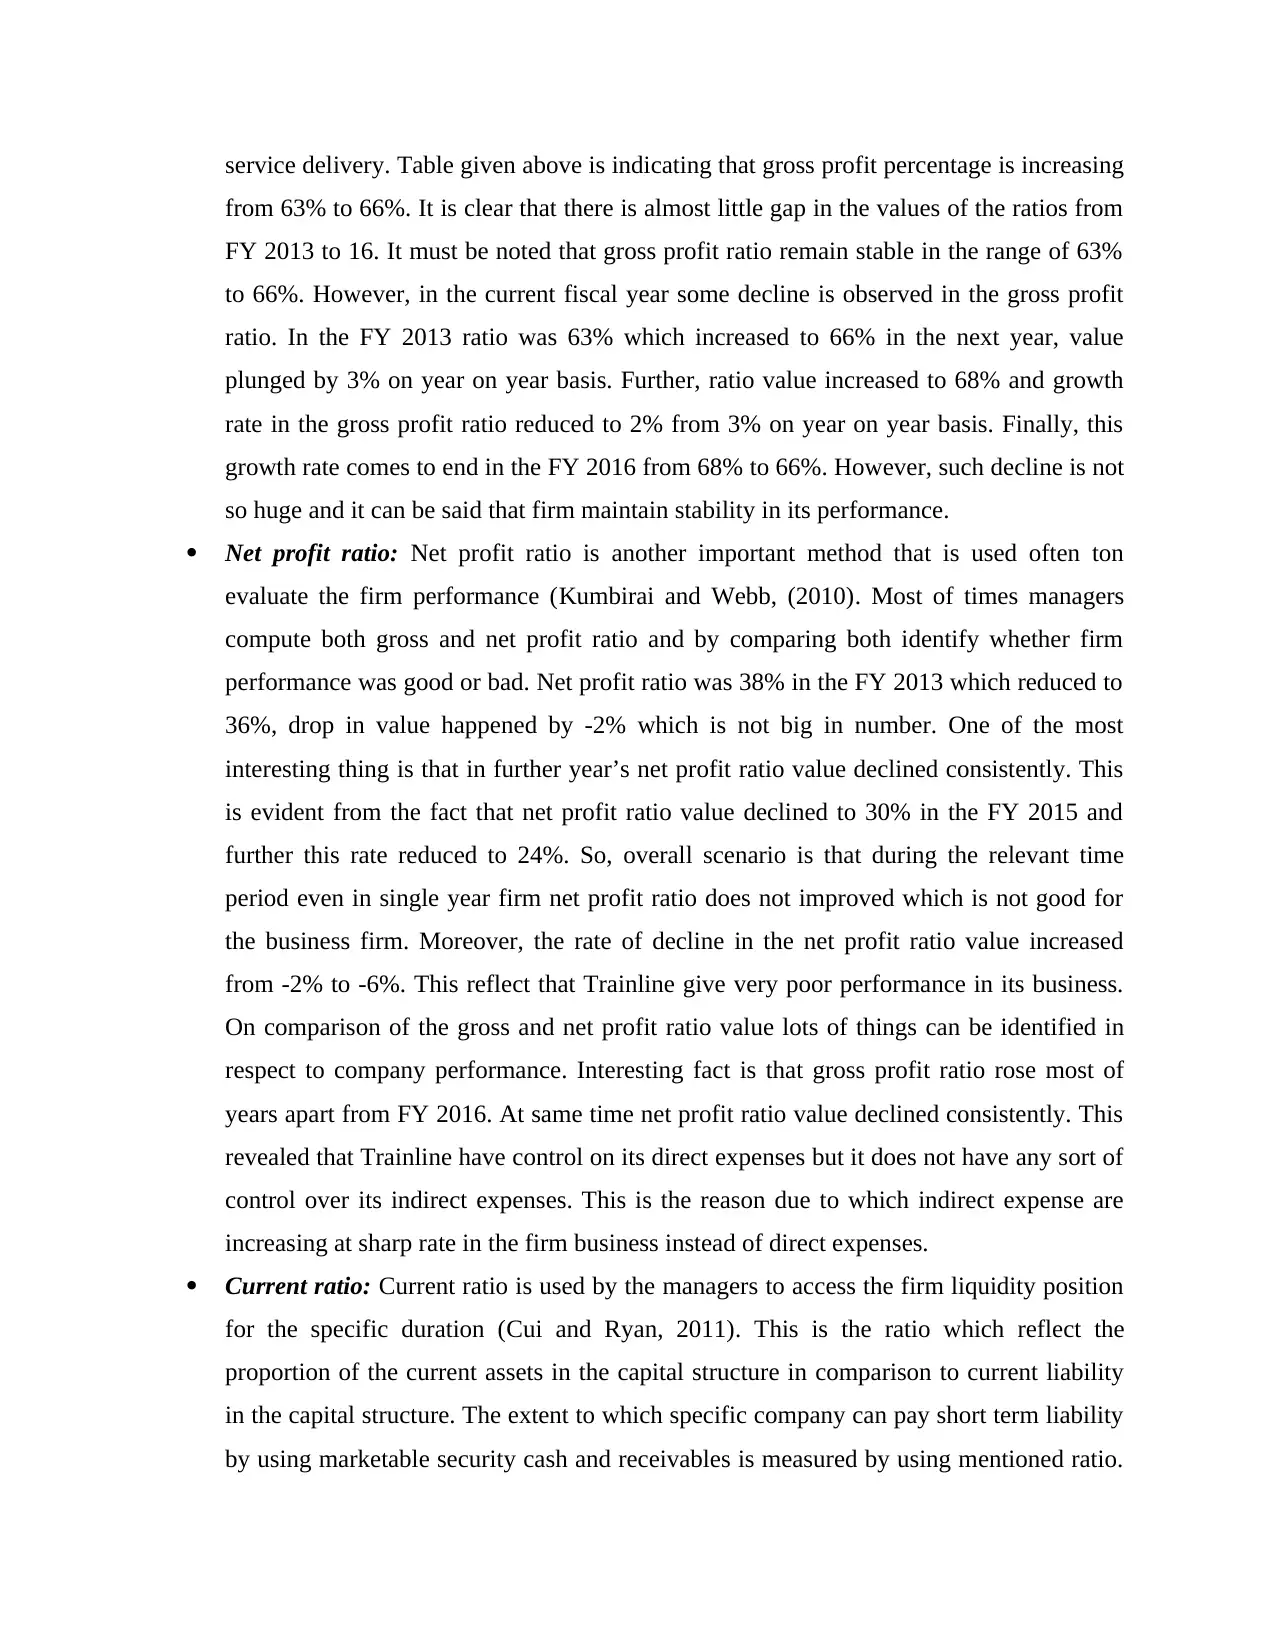
Net profit ratio: Net profit ratio is another important method that is used often ton
evaluate the firm performance (Kumbirai and Webb, (2010). Most of times managers
compute both gross and net profit ratio and by comparing both identify whether firm
performance was good or bad. Net profit ratio was 38% in the FY 2013 which reduced to
36%, drop in value happened by -2% which is not big in number. One of the most
interesting thing is that in further year’s net profit ratio value declined consistently. This
is evident from the fact that net profit ratio value declined to 30% in the FY 2015 and
further this rate reduced to 24%. So, overall scenario is that during the relevant time
period even in single year firm net profit ratio does not improved which is not good for
the business firm. Moreover, the rate of decline in the net profit ratio value increased
from -2% to -6%. This reflect that Trainline give very poor performance in its business.
On comparison of the gross and net profit ratio value lots of things can be identified in
respect to company performance. Interesting fact is that gross profit ratio rose most of
years apart from FY 2016. At same time net profit ratio value declined consistently. This
revealed that Trainline have control on its direct expenses but it does not have any sort of
control over its indirect expenses. This is the reason due to which indirect expense are
increasing at sharp rate in the firm business instead of direct expenses.
Current ratio: Current ratio is used by the managers to access the firm liquidity position
for the specific duration (Cui and Ryan, 2011). This is the ratio which reflect the
proportion of the current assets in the capital structure in comparison to current liability
in the capital structure. The extent to which specific company can pay short term liability
by using marketable security cash and receivables is measured by using mentioned ratio.
from 63% to 66%. It is clear that there is almost little gap in the values of the ratios from
FY 2013 to 16. It must be noted that gross profit ratio remain stable in the range of 63%
to 66%. However, in the current fiscal year some decline is observed in the gross profit
ratio. In the FY 2013 ratio was 63% which increased to 66% in the next year, value
plunged by 3% on year on year basis. Further, ratio value increased to 68% and growth
rate in the gross profit ratio reduced to 2% from 3% on year on year basis. Finally, this
growth rate comes to end in the FY 2016 from 68% to 66%. However, such decline is not
so huge and it can be said that firm maintain stability in its performance.
Net profit ratio: Net profit ratio is another important method that is used often ton
evaluate the firm performance (Kumbirai and Webb, (2010). Most of times managers
compute both gross and net profit ratio and by comparing both identify whether firm
performance was good or bad. Net profit ratio was 38% in the FY 2013 which reduced to
36%, drop in value happened by -2% which is not big in number. One of the most
interesting thing is that in further year’s net profit ratio value declined consistently. This
is evident from the fact that net profit ratio value declined to 30% in the FY 2015 and
further this rate reduced to 24%. So, overall scenario is that during the relevant time
period even in single year firm net profit ratio does not improved which is not good for
the business firm. Moreover, the rate of decline in the net profit ratio value increased
from -2% to -6%. This reflect that Trainline give very poor performance in its business.
On comparison of the gross and net profit ratio value lots of things can be identified in
respect to company performance. Interesting fact is that gross profit ratio rose most of
years apart from FY 2016. At same time net profit ratio value declined consistently. This
revealed that Trainline have control on its direct expenses but it does not have any sort of
control over its indirect expenses. This is the reason due to which indirect expense are
increasing at sharp rate in the firm business instead of direct expenses.
Current ratio: Current ratio is used by the managers to access the firm liquidity position
for the specific duration (Cui and Ryan, 2011). This is the ratio which reflect the
proportion of the current assets in the capital structure in comparison to current liability
in the capital structure. The extent to which specific company can pay short term liability
by using marketable security cash and receivables is measured by using mentioned ratio.
Paraphrase This Document
Need a fresh take? Get an instant paraphrase of this document with our AI Paraphraser
It can be seen from the table that value of current ratio is reducing regularly from the 1.8
to 1.17 in the FY 2014. Performance become poor in the FY 2015 as value of the ratio
reduced to 1.41 and 1.12 in the FY 2015 and 2016. This reflects that with passage of time
firm capability to pay current liability by using cash, marketable security and receivables
get reduced to some extent. Ratio value revealed that in the FY 2013 for every one unit of
short term liability there was 1.86 units of current assets. Performance become poor and
in the FY 2016 firm have only £1.21 of current assets for one unit of current liability.
Thus, firm performance is not good but still it is in position from where it can pay all its
short term liability by using current assets.
Stock turnover ratio: Stock turnover ratio reflect the extent to which sales is generated
by selling inventory in the market (Kieso, Weygandt and Warfield, (2010)). In other
words it can be said that inventory turnover ratio reflect the number of times stock is
turned over in to sales by the business firm. It can be seen from the table that stock
turnover ratio of Trainline is increasing consistently from the 0.62 to 0.97. These values
reflects that stock turnover ratio of the business firm increased at rapid rate in past few
years. However, it is also a fact that stock turnover ratio value is very low and number of
times stock converted in to sales is insufficient. Firm needs to improve value of this ratio
to some extent. By setting such kind of target business firm can improve its performance.
Return on equity: Return on equity refers to the return that is earned on the per unit of
equity by the investors. In order to compute return on equity net profit value and
shareholder equity value is taken in to consideration (Richardson, Tuna and Wysocki,
(2010)). Higher is the value of return on equity more is the return investors gained for
making investment in the business firm. It can be observed from the table that value of
return on equity was 29% in the FY 2013 and it increased to 59%. Thus, it is clear that
over past few years investors gain huge amount of money in lieu of investment they made
in the business firm. It is also identified on analysis of figures that return on equity is
fluctuating consistently at fast rate. In the FY 2013 it was 29% and increased to 93% in
the FY 2014. After this sharp decline is seen in the firm performance on this front as
return on equity reduced to 45%. From here again sign of improvement are observed and
value of return on equity percentage increased to 59%. Thus, it is clear that firm is giving
better return to the customers but at same time return on equity is fluctuating consistently
which to some extent is matter of concern.
Question 2
Preparing a budget and sources of finance
Table 2Cash budget for Trainline
2017 2018 2019
Opening balance 0 66989.93 153634.3
Sales revenue 145882.7 158153.5 171456.4
Receivables 153121
Total 299003.7 225143.4 325090.7
Expenses
Administrative expenses 63956.24 66646.05 69448.98
Finance cost 5067.523 4863 4863
Payables 162990
Total of expenses 232013.8 71509.05 74311.98
Net balance 66989.93 153634.3 250778.7
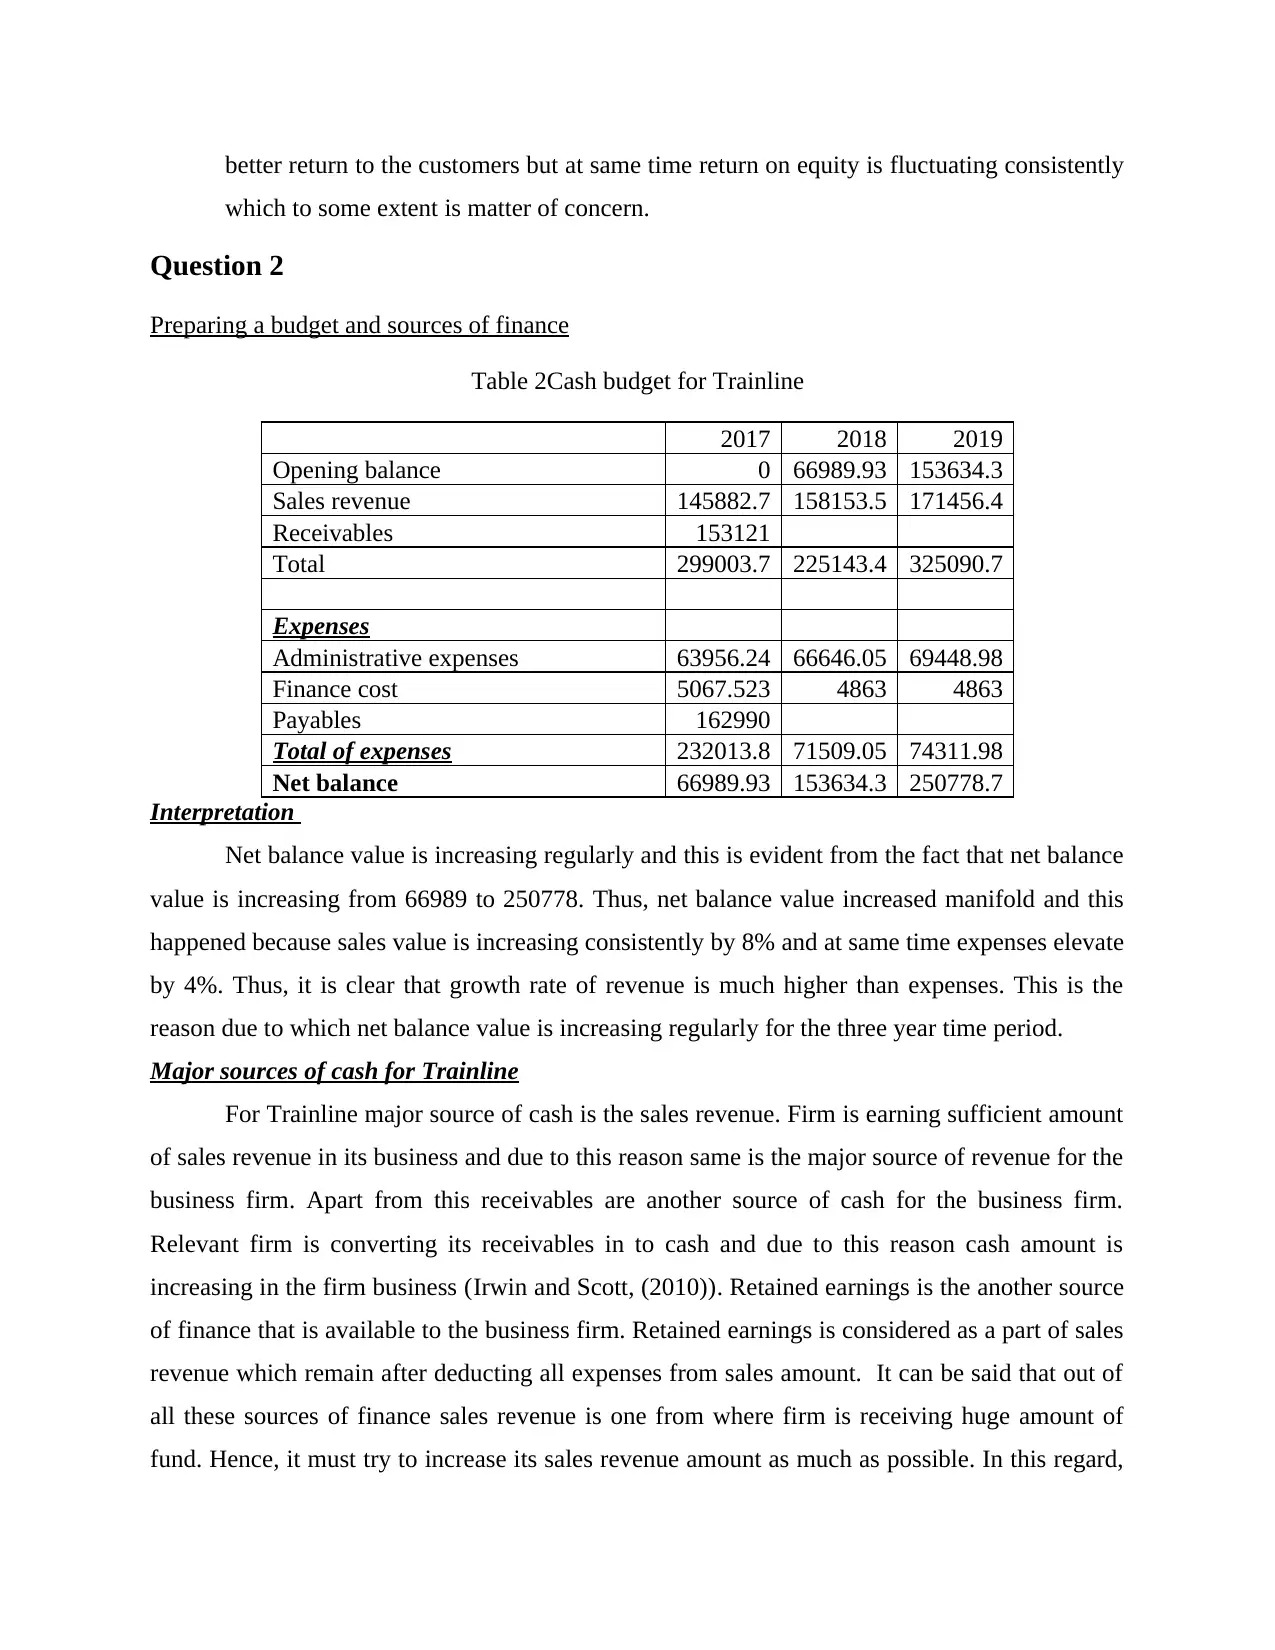
Interpretation
Net balance value is increasing regularly and this is evident from the fact that net balance
value is increasing from 66989 to 250778. Thus, net balance value increased manifold and this
happened because sales value is increasing consistently by 8% and at same time expenses elevate
by 4%. Thus, it is clear that growth rate of revenue is much higher than expenses. This is the
reason due to which net balance value is increasing regularly for the three year time period.
Major sources of cash for Trainline
For Trainline major source of cash is the sales revenue. Firm is earning sufficient amount
of sales revenue in its business and due to this reason same is the major source of revenue for the
business firm. Apart from this receivables are another source of cash for the business firm.
Relevant firm is converting its receivables in to cash and due to this reason cash amount is
increasing in the firm business (Irwin and Scott, (2010)). Retained earnings is the another source
of finance that is available to the business firm. Retained earnings is considered as a part of sales
revenue which remain after deducting all expenses from sales amount. It can be said that out of
all these sources of finance sales revenue is one from where firm is receiving huge amount of
fund. Hence, it must try to increase its sales revenue amount as much as possible. In this regard,
which to some extent is matter of concern.
Question 2
Preparing a budget and sources of finance
Table 2Cash budget for Trainline
2017 2018 2019
Opening balance 0 66989.93 153634.3
Sales revenue 145882.7 158153.5 171456.4
Receivables 153121
Total 299003.7 225143.4 325090.7
Expenses
Administrative expenses 63956.24 66646.05 69448.98
Finance cost 5067.523 4863 4863
Payables 162990
Total of expenses 232013.8 71509.05 74311.98
Net balance 66989.93 153634.3 250778.7
Interpretation
Net balance value is increasing regularly and this is evident from the fact that net balance
value is increasing from 66989 to 250778. Thus, net balance value increased manifold and this
happened because sales value is increasing consistently by 8% and at same time expenses elevate
by 4%. Thus, it is clear that growth rate of revenue is much higher than expenses. This is the
reason due to which net balance value is increasing regularly for the three year time period.
Major sources of cash for Trainline
For Trainline major source of cash is the sales revenue. Firm is earning sufficient amount
of sales revenue in its business and due to this reason same is the major source of revenue for the
business firm. Apart from this receivables are another source of cash for the business firm.
Relevant firm is converting its receivables in to cash and due to this reason cash amount is
increasing in the firm business (Irwin and Scott, (2010)). Retained earnings is the another source
of finance that is available to the business firm. Retained earnings is considered as a part of sales
revenue which remain after deducting all expenses from sales amount. It can be said that out of
all these sources of finance sales revenue is one from where firm is receiving huge amount of
fund. Hence, it must try to increase its sales revenue amount as much as possible. In this regard,
⊘ This is a preview!⊘
Do you want full access?
Subscribe today to unlock all pages.
Trusted by 1+ million students worldwide
Trainline must make many efforts in respect to improvement of service in its business. Apart
from this, it can also take some cost control measures in its business. By doing so cost can be
reduced substantially and ticket price can be reduced which will lead to increase in sales revenue
of the business firm. Such kind of strategy will prove useful for the firm.
Question 3
Evaluating sources of finance and project evaluation methods
There are few sources of finance that are available to the business firm. Sales revenue is
the largest source of finance for the Trainline. In the statement of financial position it can be seen
that receivables are the one of the alternative that can be used by the firm in its business. It can
be seen from the financial statements that receivables are increasing at rapid rate in most years.
However, fluctuation is also observed in value of receivables. It can be observed that value of
receivables increased by 27% in the FY 2013. However, in the FY 2014 receivables reduced by -
52% which was sharp decline in value of same. Further, value of receivables increased to 37% in
the FY 2015. Thereafter receivables declined to 23% in the FY 2016. All these things reflect that
receivables of the business firm is fluctuating consistently but its growth rate is good and due to
this reason it can be used by the business firm to finance its operations (Caglayan and Demir,
(2014)). Cash and cash equivalents that are in the balance sheet are another option that business
firm have as alternative. In case of mentioned source of finance heavy fluctuation is observed as
value of cash and its equivalents increased by 20% in the FY 2013 and thereafter its value
reduced to -13%. Rebound is observed in case of cash and its equivalents in the FY 2015 as its
value increased by 77% which was huge percentage increase in value of same in the business.
However, in the FY 2016 again value of same reduced by -43%. Thus, it is clear that cash and its
equivalents are available as a source of finance of the business firms but its value is fluctuating
sharply which is matter of concern for the business firm. It is clear that there is no single source
of finance out of both alternative on which firm can confidently believe that same will be
available when funds will be required in the business. Equity can be used as another source of
finance by the business firm because in the capital structure proportion of equity is low in
comparison to debt. It can be seen from the table that debt equity ratio value was 0.94 in the FY
2013 and it increased to 2.73 in the next fiscal year. This reflects that in the FY 2014 debt was
almost three time higher than equity. This ratio value get improved to 1.86 and it can be said that
Paraphrase This Document
Need a fresh take? Get an instant paraphrase of this document with our AI Paraphraser
in the FY 2015 to some extent capital structure get balanced. However, in the FY 2016 ratio
value increased to 2.90 and this reflect that again capital structure become imbalanced. Thus, it
will be better for the business firm to raise more and more capital from equity relative to debt.
There are number of techniques of the project evaluation that are used by the business
firms. Some of them are NPV, IRR ARR and payback period method. Out of all these methods
IRR and payback period method is assumed appropriate method (Brown, Bird and Schalatek,
(2010)). This is because IRR or internal rate of return is the method which reflect the real rate of
return that can be gained on the project. Apart from this, payback period reflect the duration
within which invested amount can be covered. Thus, by using both techniques firm can easily
identify the return that can be earned on the project and duration within which same can be
covered. Thus, it can be said that by using both methods better investment decisions can be made
by the business firm.
Question 4
Discuss the extent to which the entrepreneurial ecosystem has been responsible for the
development of TrainLine as a business
Entrepreneurial ecosystem is responsible for development of the Trainline as business to
large extent. It is the entrepreneurial ecosystem of the nation that promote people to come
forward and start their business (Crane and Matten, (2016)). It can be observed that environment
in the nations is business friendly and more and more people wants to commence their business.
Trainline business increased at fast pace in the relevant sector and it is the entrepreneurial
ecosystem which play a very important role in the development of the Trainline as a business. In
the nation government is bringing many schemes that are helping people in opening their
business. Under this sufficient amount of funds are made available to the new startups. Thus, it
can be said that entrepreneurial ecosystem to great extent is responsible for development of
Trainline as a business. In most of nations it is observed that people to great extent are motivated
by other entrepreneurs to open their own business (Liu, Zhang and Liu, (2011)). This is because
government is supporting a lot to the people who intends to open their own business in the
nation. Apart from the entrepreneurial ecosystem there are many other factors that play an
important role in opening of the Trainline business. The entrepreneur who started a business is
also talented and this is the factor that also play very important role in development of the
Trainline business. Government can only provide support to the business firm but it is the talent
of the individual which helped it in developing business. Hence, it can be said that apart from the
entrepreneurial ecosystem knowledge, talent and technical knowhow of a business owner is the
other factor that is responsible for development of the Trainline as a business.
Question 5
Critically discuss the ethical considerations that should be taken into account in assessing when
the TrainLine should go for IPO
There are number of factors that must be considered while firm is going to launch its IPO in the
market. Out of all these factors ethics must also considered for determining the time when
Trainline must launch IPO in the market. It is observed many times that IPO is bring by the firm
in the market and its portion remain unsubscribed. There are many investors who misinterpret
such kind of things. Some investors think that firm shares will not give good return to them and
they sold shares in the market. IPO remain subscribe when economic condition of the nation is
not good (Sinha and Labi, 2011). Hence, in such kind of situation sometimes investors face huge
loss on the investment that they made in the business firm. It is the ethical responsibility of the
business firm to ensure that it is going to launch IPO on right time. This is because if same will
not be done then due to fear factor investors will lose money they invested on the specific firm
shares. There are many other ethical factors that firm must consider before launching its IPO. It
is well known fact that on real share price premium amount is added and in this way share price
is calculated. It is ethical responsibility of the business firm to ensure that it is charging
reasonable amount of premium from the investors. In this regard it must be ensured that in the
discounted cash flow valuation model correct value is taken in to account (Shen, Shen and Sun,
2012). Along with this, it must also be ensured that growth rate of revenue and other things is
rightly estimated. Thus, it can be said that there are multiple ethical factors that must be taken in
to consideration while firm is going to launch its IPO in the market.
CONCLUSION
On the basis of above discussion it is concluded that ratio analysis is the one of the most
important approach that is used to evaluate the firm performance. This is because by using this
method performance of any business firm can be measured in multiple ways. Budget must be
prepared by the firms very cautiously because by using expenses in the business is controlled and
⊘ This is a preview!⊘
Do you want full access?
Subscribe today to unlock all pages.
Trusted by 1+ million students worldwide

performance of the business firm is improved. Thus, it can be said that budget is the one of the
most important method and it must be cautiously used by the firm in its business. Before
launching an IPO some of the ethical factors must be considered by the managers so that
investor’s interest can be protected in right manner. By doing so firm can create its good image
among the stakeholders.
most important method and it must be cautiously used by the firm in its business. Before
launching an IPO some of the ethical factors must be considered by the managers so that
investor’s interest can be protected in right manner. By doing so firm can create its good image
among the stakeholders.
Paraphrase This Document
Need a fresh take? Get an instant paraphrase of this document with our AI Paraphraser
REFERENCES
Books and journals
Brown, J., Bird, N. and Schalatek, L., (2010). Climate finance additionality: emerging definitions
and their implications. Climate Finance policy brief. 2. pp.1-11.
Caglayan, M. and Demir, F., (2014). Firm productivity, exchange rate movements, sources of
finance, and export orientation. World Development. 54. pp.204-219.
Crane, A. and Matten, D., (2016). Business ethics: Managing corporate citizenship and
sustainability in the age of globalization. Oxford University Press.
Cui, X. and Ryan, C., (2011). Perceptions of place, modernity and the impacts of tourism–
Differences among rural and urban residents of Ankang, China: A likelihood ratio analysis.
Tourism Management. 32(3). pp.604-615.
Irwin, D. and Scott, J.M., (2010). Barriers faced by SMEs in raising bank finance. International
journal of entrepreneurial behavior & research. 16(3). pp.245-259.
Kieso, D.E., Weygandt, J.J. and Warfield, T.D., (2010). Intermediate accounting: IFRS edition.
John Wiley & Sons.
Kumbirai, M. and Webb, R., (2010). A financial ratio analysis of commercial bank performance
in South Africa. African Review of Economics and Finance. 2(1). pp.30-53.
Liu, P., Zhang, X. and Liu, W., (2011). A risk evaluation method for the high-tech project
investment based on uncertain linguistic variables. Technological Forecasting and Social
Change. 78(1). pp.40-50.
Richardson, S., Tuna, İ. and Wysocki, P., (2010). Accounting anomalies and fundamental
analysis: A review of recent research advances. Journal of Accounting and Economics.
50(2). pp.410-454.
Shen, W., Shen, Q. and Sun, Q., 2012. Building Information Modeling-based user activity
simulation and evaluation method for improving designer–user communications.
Automation in Construction. 21. pp.148-160.
Sinha, K.C. and Labi, S., 2011. Transportation decision making: Principles of project evaluation
and programming. John Wiley & Sons.
Online

Gross profit ratio, 2015. [Online]. Available through
:<http://www.accountingformanagement.org/gross-profit-ratio/>. [Accessed on 3rd
March 2017].
:<http://www.accountingformanagement.org/gross-profit-ratio/>. [Accessed on 3rd
March 2017].
⊘ This is a preview!⊘
Do you want full access?
Subscribe today to unlock all pages.
Trusted by 1+ million students worldwide
1 out of 12
Related Documents


Your All-in-One AI-Powered Toolkit for Academic Success.
+13062052269
info@desklib.com
Available 24*7 on WhatsApp / Email
![[object Object]](/_next/static/media/star-bottom.7253800d.svg)
Unlock your academic potential
Copyright © 2020–2026 A2Z Services. All Rights Reserved. Developed and managed by ZUCOL.