BUACC5901 Report: Financial Analysis of Transurban (2017-2018)

Verified

Added on  2022/11/01

|6
|1121
|159
Report
AI Summary
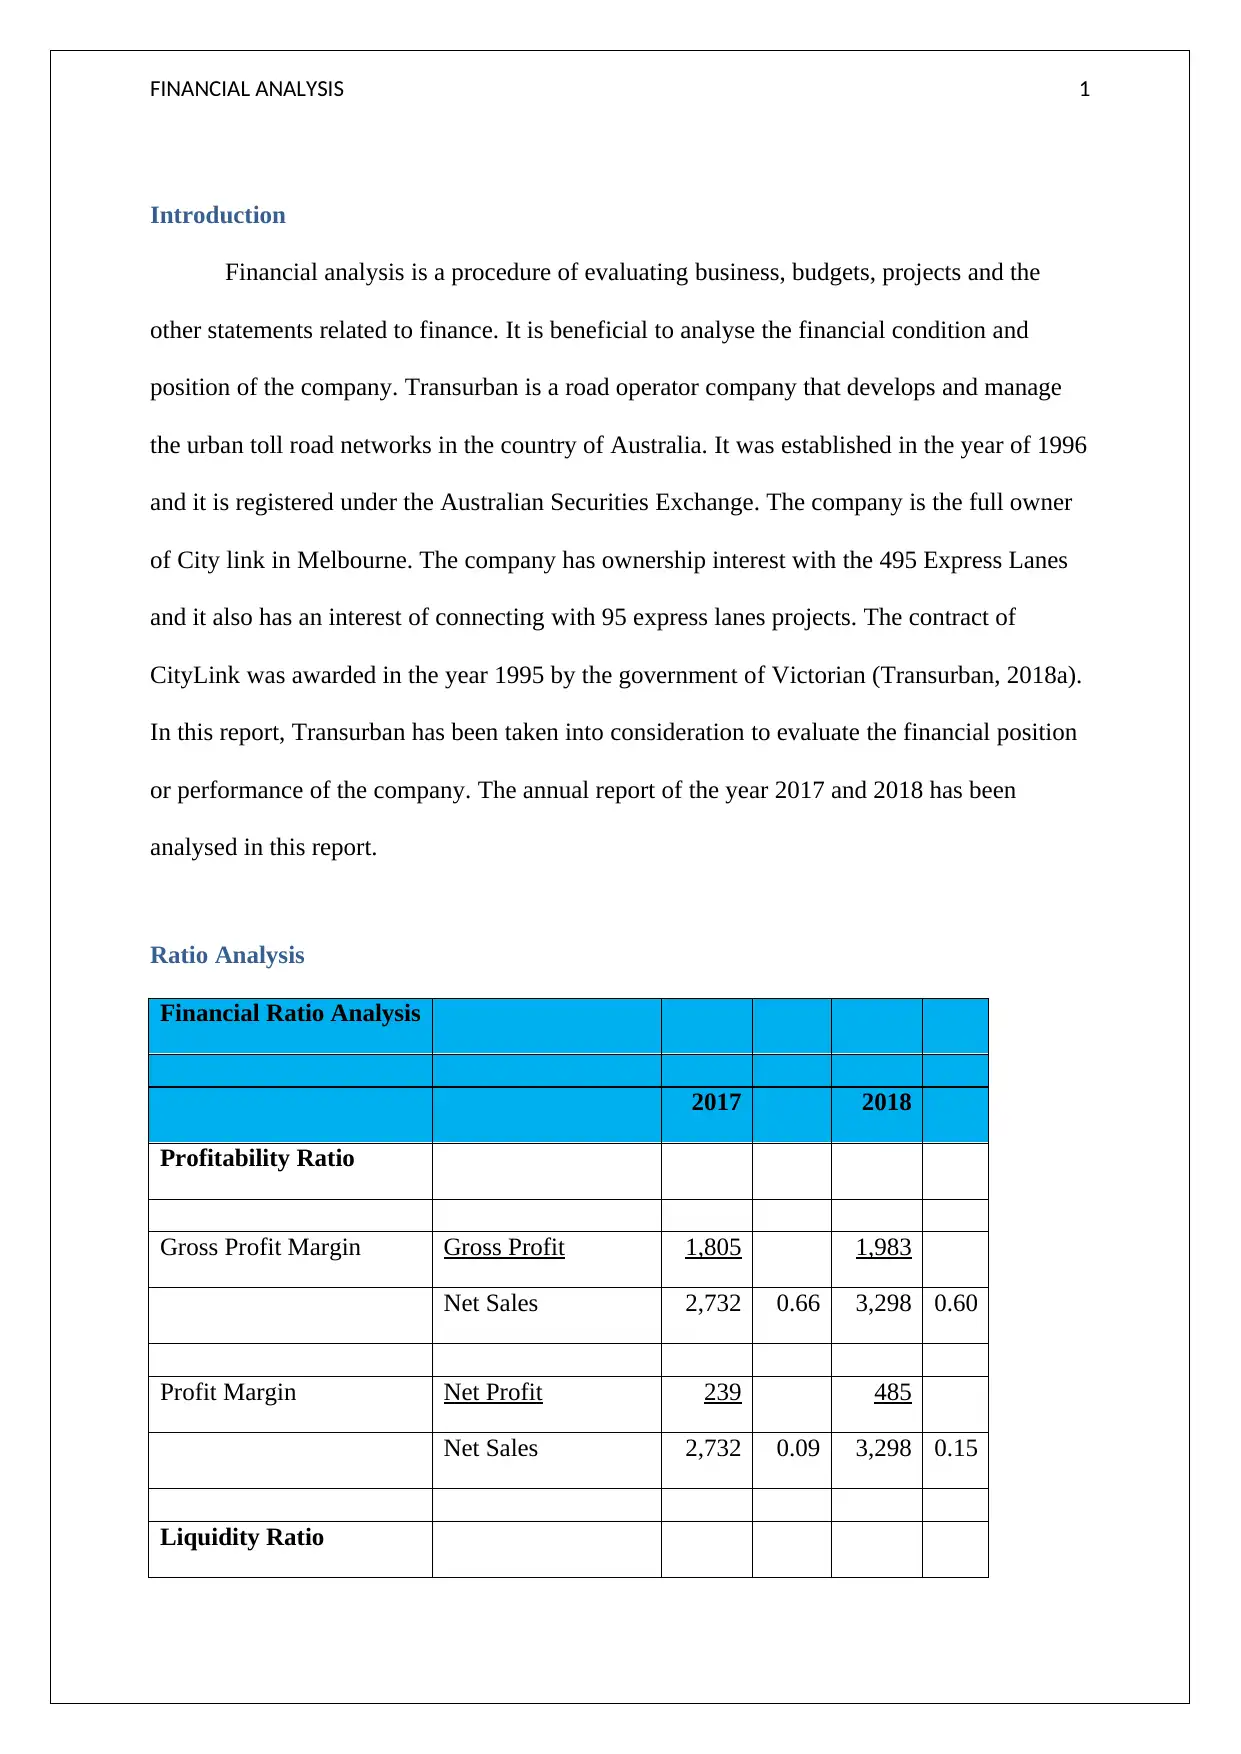
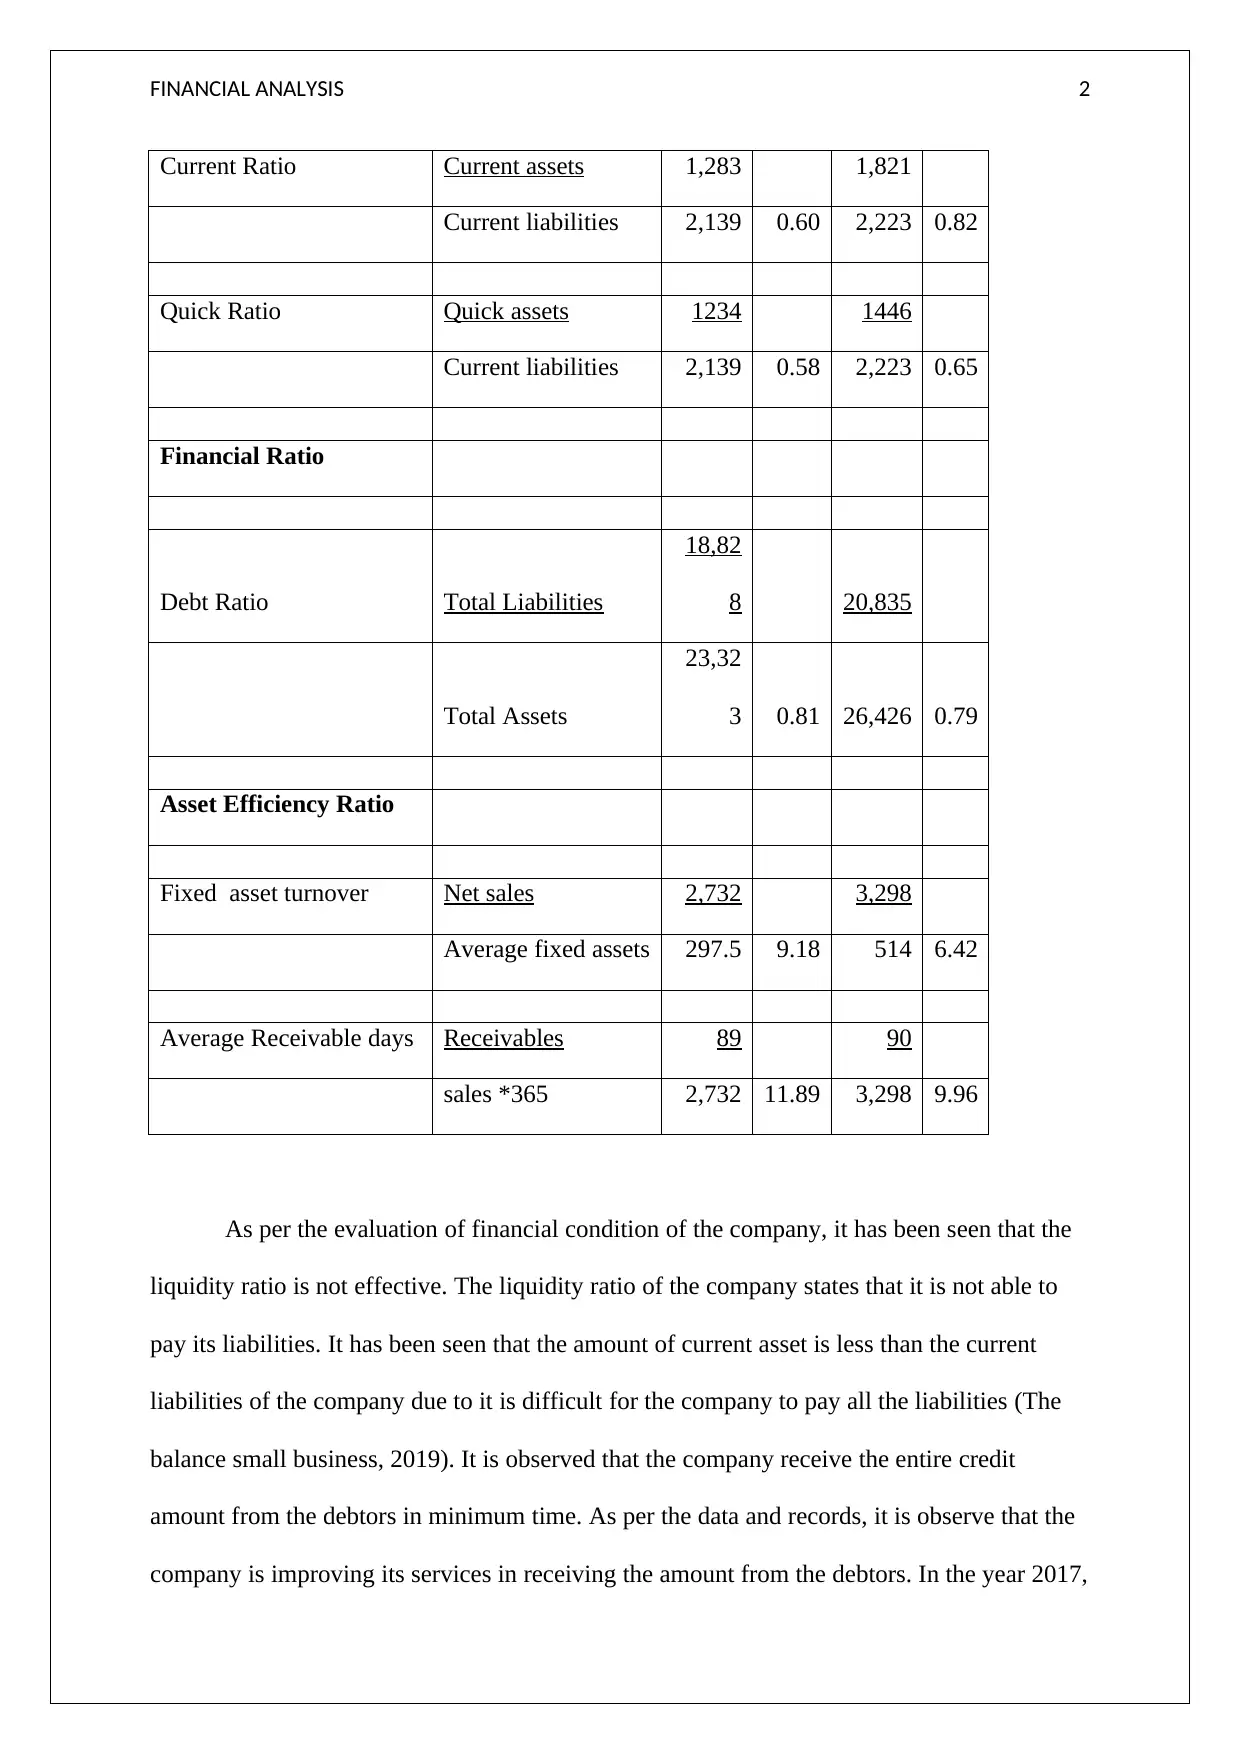
This report provides a financial analysis of Transurban, a road operator company, examining its financial performance for the years 2017 and 2018. The analysis focuses on key financial ratios, including profitability, liquidity, and asset efficiency ratios, to assess the company's financial position. The report calculates and interprets gross profit margin, profit margin, current ratio, quick ratio, debt ratio, fixed asset turnover, and average receivable days. The findings indicate that while Transurban demonstrates improvements in certain areas, such as receivables collection, its liquidity ratios reveal challenges in meeting current liabilities. The report recommends strategies like expense reduction, investment in assets, and capital diversification to improve financial health and long-term sustainability. The conclusion highlights the need for Transurban to enhance its services and financial management to thrive in the market.
Document Page
Financial Analysis
tabler-icon-diamond-filled.svg

Paraphrase This Document

Need a fresh take? Get an instant paraphrase of this document with our AI Paraphraser
Document Page
FINANCIAL ANALYSIS 1
Introduction
Financial analysis is a procedure of evaluating business, budgets, projects and the
other statements related to finance. It is beneficial to analyse the financial condition and
position of the company. Transurban is a road operator company that develops and manage
the urban toll road networks in the country of Australia. It was established in the year of 1996
and it is registered under the Australian Securities Exchange. The company is the full owner
of City link in Melbourne. The company has ownership interest with the 495 Express Lanes
and it also has an interest of connecting with 95 express lanes projects. The contract of
CityLink was awarded in the year 1995 by the government of Victorian (Transurban, 2018a).
In this report, Transurban has been taken into consideration to evaluate the financial position
or performance of the company. The annual report of the year 2017 and 2018 has been
analysed in this report.
Ratio Analysis
Financial Ratio Analysis
2017 2018
Profitability Ratio
Gross Profit Margin Gross Profit 1,805 1,983
Net Sales 2,732 0.66 3,298 0.60
Profit Margin Net Profit 239 485
Net Sales 2,732 0.09 3,298 0.15
Liquidity Ratio
Document Page
FINANCIAL ANALYSIS 2
Current Ratio Current assets 1,283 1,821
Current liabilities 2,139 0.60 2,223 0.82
Quick Ratio Quick assets 1234 1446
Current liabilities 2,139 0.58 2,223 0.65
Financial Ratio
Debt Ratio Total Liabilities
18,82
8 20,835
Total Assets
23,32
3 0.81 26,426 0.79
Asset Efficiency Ratio
Fixed asset turnover Net sales 2,732 3,298
Average fixed assets 297.5 9.18 514 6.42
Average Receivable days Receivables 89 90
sales *365 2,732 11.89 3,298 9.96
As per the evaluation of financial condition of the company, it has been seen that the
liquidity ratio is not effective. The liquidity ratio of the company states that it is not able to
pay its liabilities. It has been seen that the amount of current asset is less than the current
liabilities of the company due to it is difficult for the company to pay all the liabilities (The
balance small business, 2019). It is observed that the company receive the entire credit
amount from the debtors in minimum time. As per the data and records, it is observe that the
company is improving its services in receiving the amount from the debtors. In the year 2017,
Document Page
FINANCIAL ANALYSIS 3
the company receive the amount in 11 days but now it takes 9 days (Transurban, 2018b). It is
effective for the company as they receive the cash in the less time or in minimum days. The
financial ratio states that the company is in the position where it is able to pay its long term
borrowings. The total asset of the company is 23323 and the total liability is 18828 in the
year 2017. It is observed that the total asset of the company is increases with the total
liabilities due to which the capability of paying the debt is decreases. The profitability ratio of
the company states its financial position. The gross profit margin ratio is 0.66 and 0.60 in the
year 2017 and 2018 respectively. It has been founded that the profit of the organisation is
high as per the sales amount. The net profit the company is 239 in the year 2017 and 0.15 in
the year 2018 (Accounting tools, 2018). It can be said that the company is in the position to
survive for long time.
Recommendation
As per the discussion, it is recommended that the company has to reduce its expenses
by investing the amount in proper manner. Reducing expenses helps the organisation to
invest in fixed asset so that it will able to pay its current liabilities in order to expand the
business in the international level.
As per the analysis, it is evaluated that the current asset of the company is less as
compare to the current liabilities. It is recommended that the company has to invest in its
asset so that it can be liable to pay the liabilities. It is also recommended that the company
has to be diversified in capital. It is necessary to diversify in the capital as they can distribute
capital in the effective manner (Gitman, Juchau, & Flanagan, 2015).
It is observed that the sale of the company is increases but the profit is not increases
as per same margin of increasing sale. It is recommended that the company also has to rises
tabler-icon-diamond-filled.svg

Paraphrase This Document

Need a fresh take? Get an instant paraphrase of this document with our AI Paraphraser
Document Page
FINANCIAL ANALYSIS 4
its sales prices so that it can earn the high revenue with the increasing sale (Robinson, Henry,
Pirie, & Broihahn, 2015).
Conclusion
From the above limelight discussion, it has been concluded that the company is
improving the financial condition. It is observed that the financial position of the company is
not more effective as the sales is increases but net profit is increases with the small
percentage. As per the analysis, it has been seen that the company is in the position where it
cannot pay its current liabilities with its current asset. The reason behind is that it receive the
amount in the minimum days so that it capacity to pay liabilities is increases. Although, the
company is improving but it is required to improve it’s services by reducing the expenses.
The other recommendation is that the company has to distribute its capital in an appropriate
way so that it can achieve the success. It can be said that the company has to adopt the
recommendation to survive for long time as it has less chances to survive in the market for
long time.
Document Page
FINANCIAL ANALYSIS 5
References
Accounting tools. (2018). Efficiency ratios. Retrieved from:
https://www.accountingtools.com/articles/efficiency-ratios.html
Gitman, L. J., Juchau, R., & Flanagan, J. (2015). Principles of managerial finance. Pearson
Higher Education AU.
Robinson, T. R., Henry, E., Pirie, W. L., & Broihahn, M. A. (2015). International financial
statement analysis. John Wiley & Sons.
The balance small business. (2019). Analysis of Liquidity Position Using Financial Ratios.
Retrieved from: https://www.thebalancesmb.com/liquidity-position-analysis-with-
ratios-393233
Transurban. (2018a). About. Retrieved from: https://www.transurban.com/about-us
Transurban. (2018b). 2018 TransurbanAnnual Report. Retrieved from:
https://www.transurban.com/content/dam/investor-centre/04/2018-Annual-Report.pdf
chevron_up_icon
1 out of 6
circle_padding
hide_on_mobile
zoom_out_icon
[object Object]