MBA Assignment: Financial Performance Analysis of Travelobreak Company

Verified

Added on  2020/05/03

|6
|842
|64
Report
AI Summary
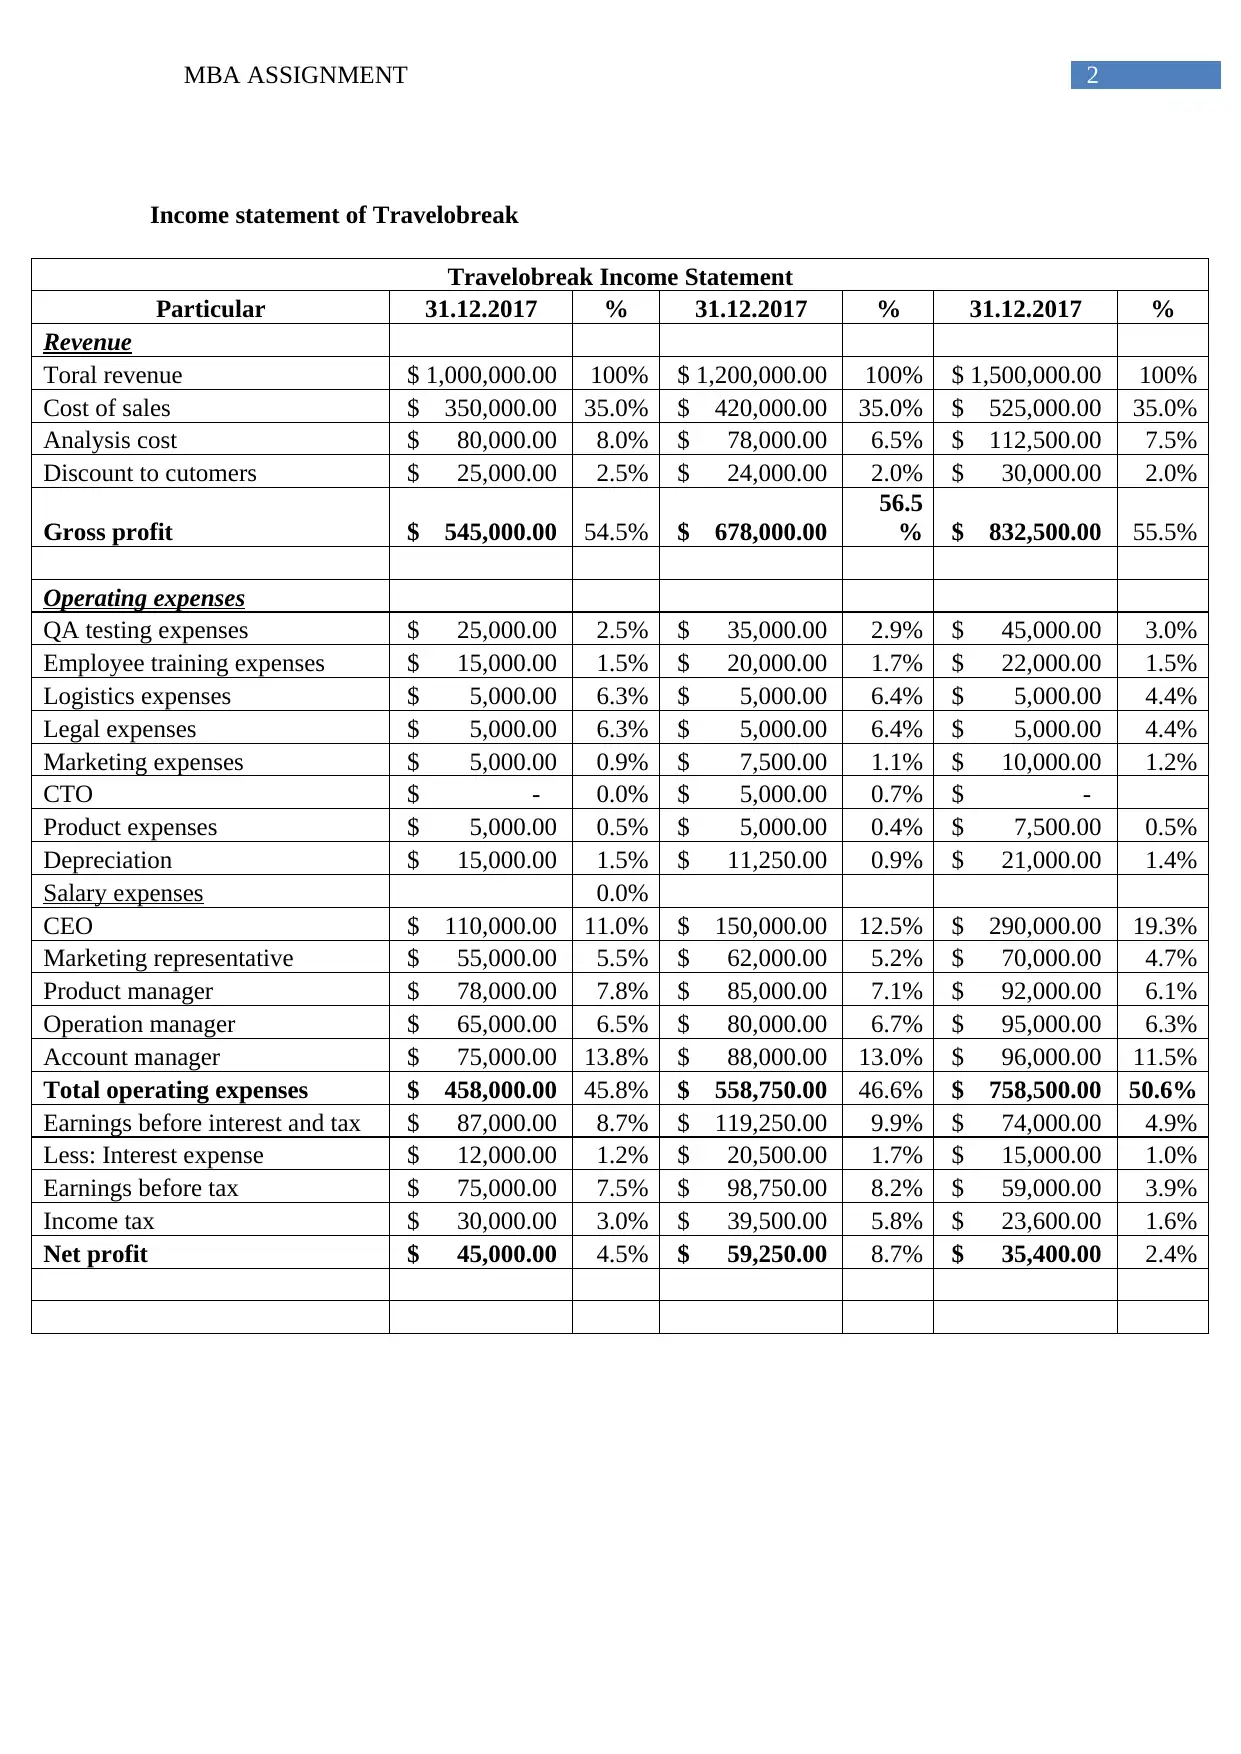
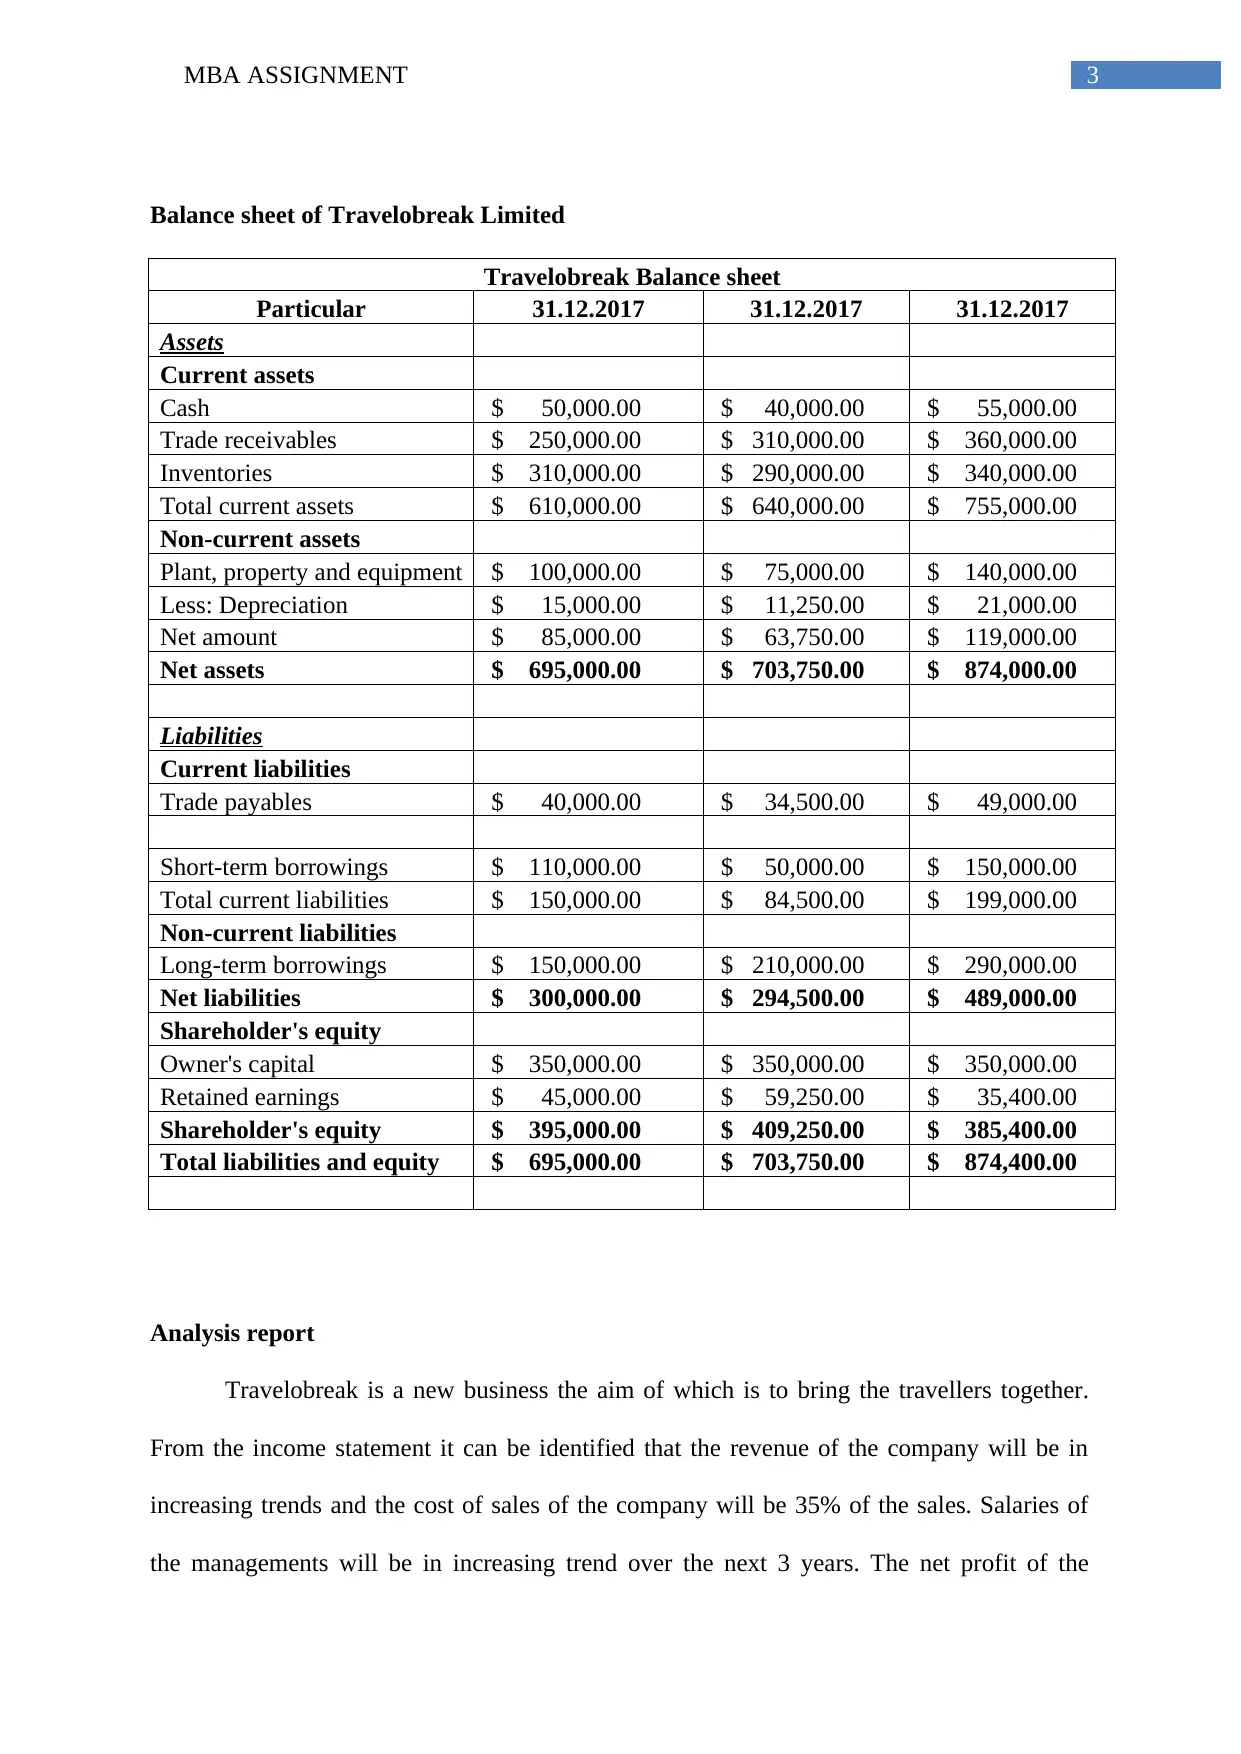
This MBA assignment analyzes the financial performance of Travelobreak, a company focused on bringing travelers together. The report includes a detailed income statement spanning three years (2017-2019), showing revenue, cost of sales, operating expenses, and net profit. A balance sheet for the same period is also provided, detailing assets, liabilities, and shareholder's equity. The analysis highlights increasing revenue trends, consistent cost of sales, and the impact of rising salaries on net profit margins. Depreciation and changes in trade payables and receivables are also discussed. The report concludes with a bibliography of relevant financial accounting resources.
tabler-icon-diamond-filled.svg

Contribute Materials

Your contribution can guide someone’s learning journey. Share your documents today.
Document Page
Running head: MBA ASSIGNMENT
MBA Assignment
Name of the student
Name of the university
Author note
tabler-icon-diamond-filled.svg

Secure Best Marks with AI Grader

Need help grading? Try our AI Grader for instant feedback on your assignments.
Document Page
1MBA ASSIGNMENT
Table of Contents
Income statement of Travelobreak.............................................................................................2
Balance sheet of Travelobreak Limited.....................................................................................3
Analysis report...........................................................................................................................3
Bibliography...............................................................................................................................5
Document Page
2MBA ASSIGNMENT
Income statement of Travelobreak
Travelobreak Income Statement
Particular 31.12.2017 % 31.12.2017 % 31.12.2017 %
Revenue
Toral revenue $ 1,000,000.00 100% $ 1,200,000.00 100% $ 1,500,000.00 100%
Cost of sales $ 350,000.00 35.0% $ 420,000.00 35.0% $ 525,000.00 35.0%
Analysis cost $ 80,000.00 8.0% $ 78,000.00 6.5% $ 112,500.00 7.5%
Discount to cutomers $ 25,000.00 2.5% $ 24,000.00 2.0% $ 30,000.00 2.0%
Gross profit $ 545,000.00 54.5% $ 678,000.00
56.5
% $ 832,500.00 55.5%
Operating expenses
QA testing expenses $ 25,000.00 2.5% $ 35,000.00 2.9% $ 45,000.00 3.0%
Employee training expenses $ 15,000.00 1.5% $ 20,000.00 1.7% $ 22,000.00 1.5%
Logistics expenses $ 5,000.00 6.3% $ 5,000.00 6.4% $ 5,000.00 4.4%
Legal expenses $ 5,000.00 6.3% $ 5,000.00 6.4% $ 5,000.00 4.4%
Marketing expenses $ 5,000.00 0.9% $ 7,500.00 1.1% $ 10,000.00 1.2%
CTO $ - 0.0% $ 5,000.00 0.7% $ -
Product expenses $ 5,000.00 0.5% $ 5,000.00 0.4% $ 7,500.00 0.5%
Depreciation $ 15,000.00 1.5% $ 11,250.00 0.9% $ 21,000.00 1.4%
Salary expenses 0.0%
CEO $ 110,000.00 11.0% $ 150,000.00 12.5% $ 290,000.00 19.3%
Marketing representative $ 55,000.00 5.5% $ 62,000.00 5.2% $ 70,000.00 4.7%
Product manager $ 78,000.00 7.8% $ 85,000.00 7.1% $ 92,000.00 6.1%
Operation manager $ 65,000.00 6.5% $ 80,000.00 6.7% $ 95,000.00 6.3%
Account manager $ 75,000.00 13.8% $ 88,000.00 13.0% $ 96,000.00 11.5%
Total operating expenses $ 458,000.00 45.8% $ 558,750.00 46.6% $ 758,500.00 50.6%
Earnings before interest and tax $ 87,000.00 8.7% $ 119,250.00 9.9% $ 74,000.00 4.9%
Less: Interest expense $ 12,000.00 1.2% $ 20,500.00 1.7% $ 15,000.00 1.0%
Earnings before tax $ 75,000.00 7.5% $ 98,750.00 8.2% $ 59,000.00 3.9%
Income tax $ 30,000.00 3.0% $ 39,500.00 5.8% $ 23,600.00 1.6%
Net profit $ 45,000.00 4.5% $ 59,250.00 8.7% $ 35,400.00 2.4%
Document Page
3MBA ASSIGNMENT
Balance sheet of Travelobreak Limited
Travelobreak Balance sheet
Particular 31.12.2017 31.12.2017 31.12.2017
Assets
Current assets
Cash $ 50,000.00 $ 40,000.00 $ 55,000.00
Trade receivables $ 250,000.00 $ 310,000.00 $ 360,000.00
Inventories $ 310,000.00 $ 290,000.00 $ 340,000.00
Total current assets $ 610,000.00 $ 640,000.00 $ 755,000.00
Non-current assets
Plant, property and equipment $ 100,000.00 $ 75,000.00 $ 140,000.00
Less: Depreciation $ 15,000.00 $ 11,250.00 $ 21,000.00
Net amount $ 85,000.00 $ 63,750.00 $ 119,000.00
Net assets $ 695,000.00 $ 703,750.00 $ 874,000.00
Liabilities
Current liabilities
Trade payables $ 40,000.00 $ 34,500.00 $ 49,000.00
Short-term borrowings $ 110,000.00 $ 50,000.00 $ 150,000.00
Total current liabilities $ 150,000.00 $ 84,500.00 $ 199,000.00
Non-current liabilities
Long-term borrowings $ 150,000.00 $ 210,000.00 $ 290,000.00
Net liabilities $ 300,000.00 $ 294,500.00 $ 489,000.00
Shareholder's equity
Owner's capital $ 350,000.00 $ 350,000.00 $ 350,000.00
Retained earnings $ 45,000.00 $ 59,250.00 $ 35,400.00
Shareholder's equity $ 395,000.00 $ 409,250.00 $ 385,400.00
Total liabilities and equity $ 695,000.00 $ 703,750.00 $ 874,400.00
Analysis report
Travelobreak is a new business the aim of which is to bring the travellers together.
From the income statement it can be identified that the revenue of the company will be in
increasing trends and the cost of sales of the company will be 35% of the sales. Salaries of
the managements will be in increasing trend over the next 3 years. The net profit of the
tabler-icon-diamond-filled.svg

Secure Best Marks with AI Grader

Need help grading? Try our AI Grader for instant feedback on your assignments.
Document Page
4MBA ASSIGNMENT
company will go up to 8.7% in 208 as compared to 4.5% of 2017. However, in 2019 the
profit will reduce to 2.4% due to the increase in the salaries. Looking into the balance sheet it
can be identified that the depreciation on plant and equipment will be provided at 15% for all
the three years. Trade payables will be reduced in 2018 and will again increase in 2019. The
borrowings and trade receivable of the company will be in decreasing trend.
Document Page
5MBA ASSIGNMENT
Bibliography
Henry, E. and Robinson, T.R., 2015. Chapter 1. Financial Statement Analysis: An
Introduction. CFA Institute Investment Books, 2015(2), pp.1-35.
Konchitchki, Y. and Patatoukas, P.N., 2013. Taking the pulse of the real economy using
financial statement analysis: Implications for macro forecasting and stock valuation.
Marshall, D., 2016. Accounting: What the numbers mean. McGraw-Hill Higher Education.
Wahlen, J., Baginski, S. and Bradshaw, M., 2014. Financial reporting, financial statement
analysis and valuation. Nelson Education.
chevron_up_icon
1 out of 6
circle_padding
hide_on_mobile
zoom_out_icon
logo.png

Your All-in-One AI-Powered Toolkit for Academic Success.

Available 24*7 on WhatsApp / Email

[object Object]