Report: Financial Performance Analysis of T-Shirt Plc (2018-2019)

Verified

Added on  2023/01/03

|10
|1391
|38
Report
AI Summary
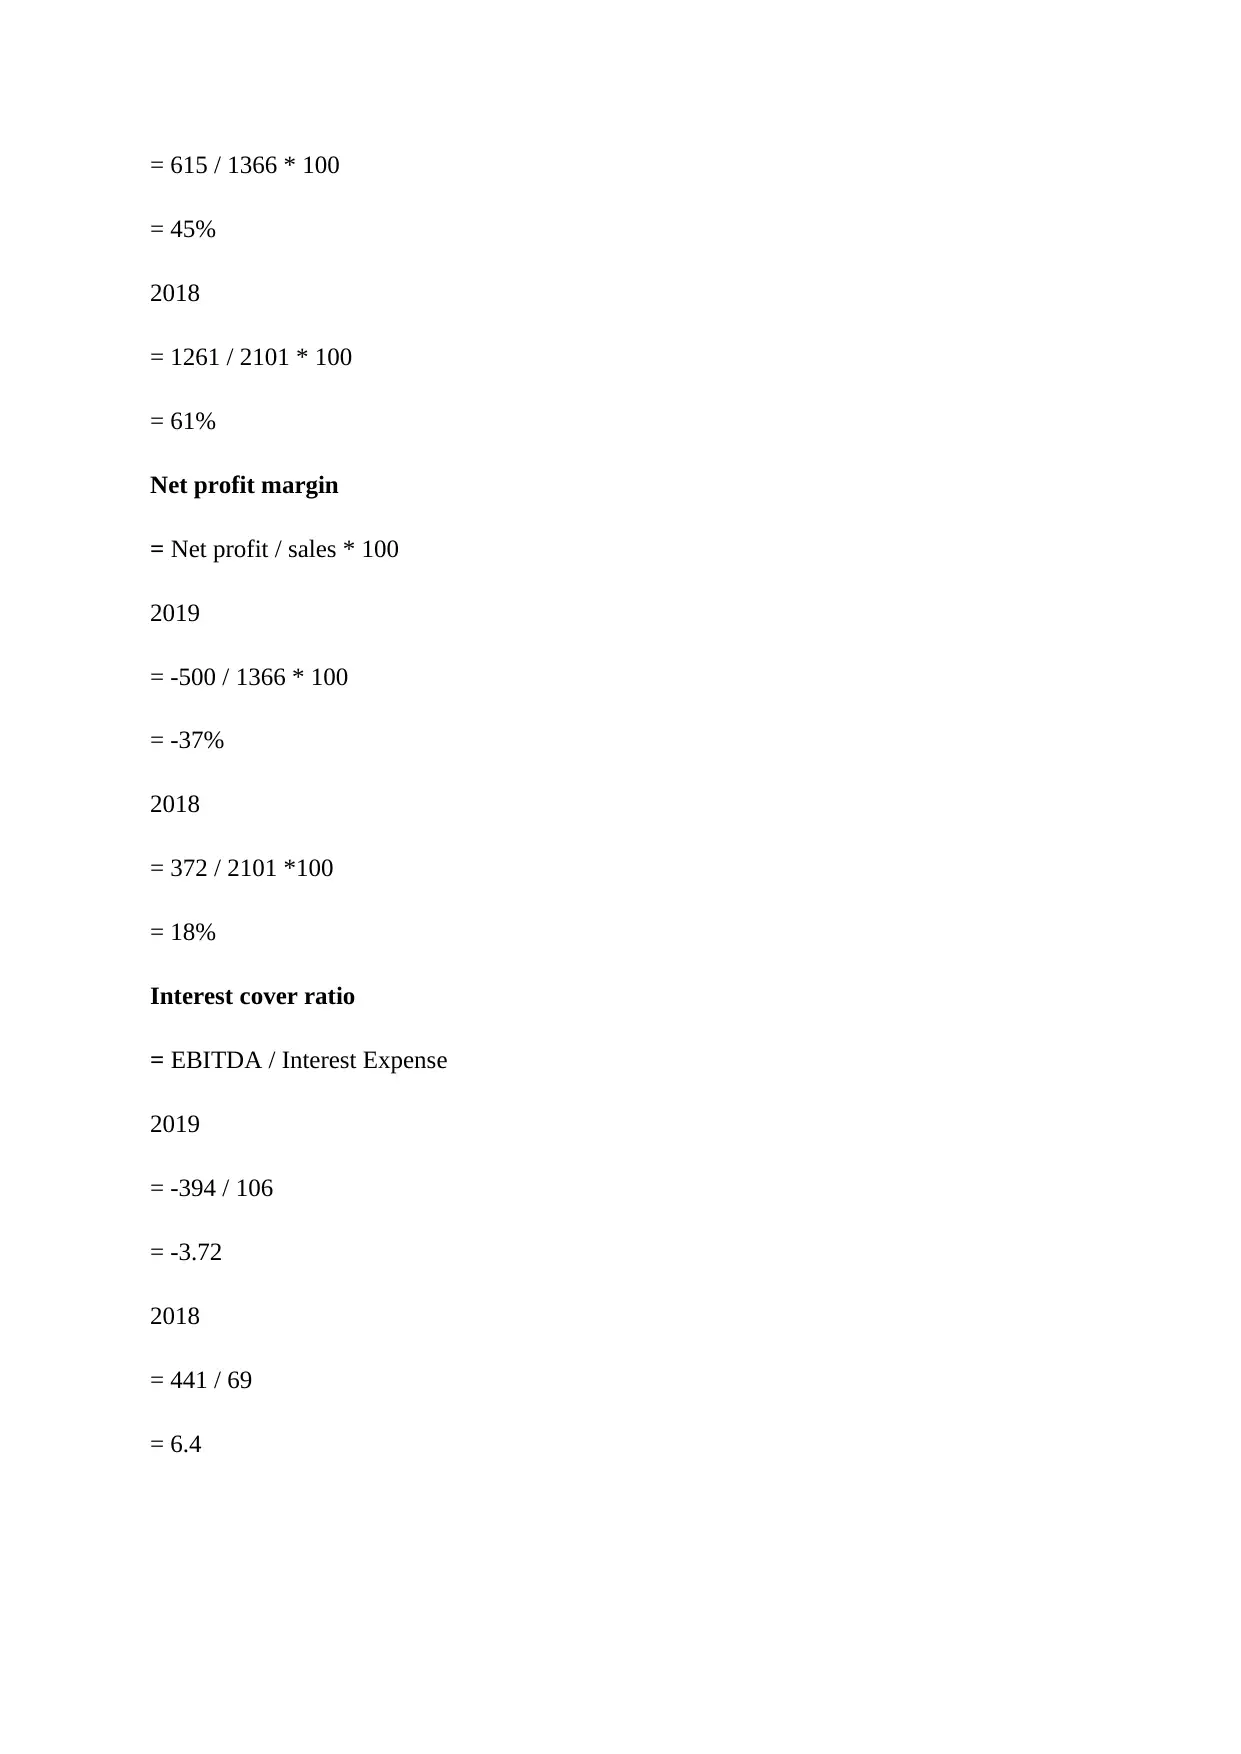
This report presents a financial analysis of T-Shirt Plc, evaluating its performance in 2018 and 2019. The analysis begins with an examination of the profit and loss account, revealing a decline in revenue and a shift from profit to loss. Key financial ratios, including gross profit margin, net profit margin, and interest cover, are calculated and assessed, highlighting a decrease in profitability. The report then shifts to the statement of financial position, assessing the company's assets, liabilities, and equity. Ratios such as the current ratio, quick ratio, inventory days, trade receivable days, and trade payable days are calculated and analyzed to evaluate the company's liquidity and efficiency. The analysis reveals a weakening financial position, with a decrease in the current ratio and an increase in inventory days. The conclusion summarizes the findings, emphasizing the need for management intervention to improve the company's financial performance.
Document Page
menationes in assessment
tabler-icon-diamond-filled.svg

Paraphrase This Document

Need a fresh take? Get an instant paraphrase of this document with our AI Paraphraser
Document Page
Table of Contents
INTRODUCTION.................................................................................................................................3
Part 1.....................................................................................................................................................3
Statement of profit analysis...............................................................................................................3
Statement of Financial position.........................................................................................................5
CONCLUSION.....................................................................................................................................9
REFERENCES....................................................................................................................................10
Document Page
INTRODUCTION
Financial position analysis is all about assessing the financial situation of the
company. This is about to assess the income statement and balance sheet of the respective
company. This report is based on the case study of the T- shirt plc company. In this project
the assessment and analysis will be done over the profit and loss account of the organisation.
Profitability of the organisation will be assessed in this project. Furthermore, this project
would evaluate about the financial position of the organisation. With the support of different
ratios this financial position and profitability would be analysed in this project.
Part 1
Statement of profit analysis
Summary Statement of Profit & Loss for the years ended 31
December
2019 2018 Trend
Analysis£'000 £'000
Revenue 1,366 2,101 - 735 -35%
Cost of sales 751 840 -89 11%
Gross Profit 615 1,261 - 646 -51%
Other expenses 1,009 820 189 23%
Profit before interest and tax -394 441 - 835 -189%
Finance Cost 106 69 37 54%
Profit (loss) for the Year -500 372 -872 -234%
Ratio 2019 2018
Gross Profit Margin 45 61
Net Profit Margin -37 18
Interest Cover -3.72 6.4
Gross profit
= Gross profit / sales * 100
2019
Document Page
= 615 / 1366 * 100
= 45%
2018
= 1261 / 2101 * 100
= 61%
Net profit margin
= Net profit / sales * 100
2019
= -500 / 1366 * 100
= -37%
2018
= 372 / 2101 *100
= 18%
Interest cover ratio
= EBITDA / Interest Expense
2019
= -394 / 106
= -3.72
2018
= 441 / 69
= 6.4
tabler-icon-diamond-filled.svg

Paraphrase This Document

Need a fresh take? Get an instant paraphrase of this document with our AI Paraphraser
Document Page
The assessment of the profit and loss account of the organisation is projected various
aspects about the profitability position of the organisation. T shirt Ltd financial position could
go down. Business is not able to deliver proper results in favour of the organisation. The
gross profit margin of organisation could go down in the year 2019 in comparison to year
2018. The gross profit ratio was 61% in the year 2018 that could go down to 45% in the year
2019. The reduced gross profitability of the organisation indicate that company is completely
unable to deliver the positive outcomes against the business operations entertained by
organisation (Ishak and et.al.,2017). The business practices channelize by organisation is
ineffective which could make the organisation suffer from reduced profitability out of the
trade operations entertained by organisation. Furthermore, the net profitability of the
company has gone to negative mark. This is another negative side of the business operations
undertaken by organisation. The profit and loss account of the company project the poor
position of the organisation against the business operations entertained by company.
Statement of Financial position
Summary Statement of Financial Position as at 31 December
2019 2018 Trend
AnalysisASSETS £'000 £'000
Non-current Assets Property
Plant and Equipment 1,274 1,282 -8 -.624%
Current Assets
Inventories 121 89 32 36%
Trade and other receivables 305 218 87 40%
Document Page
Cash and cash equivalents - 45 -45 -100%
Total Current Assets 426 352 74 21%
Total Assets 1,700 1,634 66 4%
EQUITY AND LIABILITIES
Equity
Share Capital 310 310 0 0%
Retained Earnings - 500 -500 -100%
Total Equity 310 810 -500 -62%
Non-current Liabilities
Long-term borrowings 921 688 233 34%
921 688 233 34%
Current Liabilities
Trade payables 151 136 15 11%
Bank overdraft 318 - 318 100%
Total Current Liabilities 469 136 333 245%
Total Liabilities 1,390 824 566 69%
Total Equity and Liabilities 1,700 1,634 66 4%
- -
Ratio 2019 2018
Current Ratio .91 2.6
Quick Ratio .65 1.93
Inventory Days 51 days 40 days
Trade Receivable Days 70 days 91 days
Trade Payable Days 70 days 60 days
Operating Cash Cycle 121 days 131 days
Current ratio
Document Page
= Current asset / current liability
2019
= 426 / 469
= .91
2018
= 352 / 136
= 2.6
Quick ratio
= Current asset – Inventory / current liability
2019
= 426 – 121 / 469
= .65
2018
= 352 – 89 / 136
= 1.93
Inventory days
= Average stock / cost of goods sold * 365
2019
= 105 (121 + 89 / 2) / 751 * 365
= 51 days
2018
= 92 (89 + 95 / 2) / 840 * 365
= 40 days
tabler-icon-diamond-filled.svg

Paraphrase This Document

Need a fresh take? Get an instant paraphrase of this document with our AI Paraphraser
Document Page
(In case of year 2018 opening stock has taken hypothetically in the absence of the proper
information about opening stock)
Trade receivable days
= Average trade receivable / sales * 365
2019
= 262(305 + 218 / 2) / 1366 * 365
= 70 Days
2018
= 209 (218 + 200 / 2) / 840 * 365
= 91 Days
(Opening balance of trade debtor in the 2018 is taken as the hypothetical due to unavailability
of the proper balance of opening debtor of 2018)
Trade payable days
= Average creditor / Purchase * 365
2019
= 144 (151 + 136 / 2) / 751 * 365
= 70 days
2018
= 138 (136 + 140 / 2) / 840 * 365
= 60 days
(Opening creditors of the year 2018 is taken hypothetically in th absence of proper
information)
Operating cash cycle
= Inventory period + account receivable period
Document Page
2019
= 51 +70
= 121
2018
= 40 + 91
= 131
The financial position of the T shirt Ltd Company indicates that organisation has gone
to the poor current ratio. The position of the current asset of the company was well
maintained in the year 2018 against the current liability of the company. The year 2019 the
current ratio has gone to the lowest evel of .91 against the 2.6 mark in the year 2018 which
indicate that company’s current asset could sink as compare to the current liability of the
company. Further quick ratio also reduces which indicate that company’s liquidity position
also infected in the organisation. Inventory days increased in the year 2019 by 11 days that
reflect that products offer by company spend more time in the stock as compare to the year
2018. Trade receivable day’s ratio project that company needed less time to recover its
debtors as compare to the 2018. This is positive sign against the business operations of the
organisation (Parapat, 2018). Company is taking more time to pay its dues which is not a
good indicator of the good financial position and situation of organisation. The overall
reflection of the financial position of the company indicates that the financial condition of the
organisation could go down as compare to the previous financial year.
CONCLUSION
The financial condition of the T shirt ltd could go down. The performance of the
organisation is poor as compare to the year 2018. The net profitability of the organisation
could completely go down which indicate that organisation has been unable to control its
expenditure along with is not able to improve its sales. Management at the T shirt ltd required
immediate decisions in order to achieve the best level of growth opportunities against the
business operations undertaken by company.
Document Page
REFERENCES
Books and Journals
Ishak, I. and et.al.,2017. The effects of financial ratio and GDP towards company
performance in trading and services sector. Journal of Humanities, Language,
Culture and Business. 1(4). pp.163-169.
Parapat, E. P. S., 2018. Effect of Company Financial Ratio, Price Earning Ratio on Stock
Return and Earning Per Share as Moderating Variables In Manufacturing Companies
Listed In Indonesia Stock Exchange. International Journal of Public Budgeting,
Accounting and Finance. 1(4). pp.1-13.
chevron_up_icon
1 out of 10
circle_padding
hide_on_mobile
zoom_out_icon
[object Object]