ACC97003M: Financial Analysis of Tuuli Plc - Performance and Options
VerifiedAdded on 2023/05/10
|11
|2492
|274
Report
AI Summary
This report presents a financial analysis of Tuuli Plc, focusing on its performance in 2020 and 2021. The analysis begins with an executive summary, followed by an introduction that outlines the company's background and the report's structure. Part A delves into a critical analysis of financial ratios, including liquidity, solvency, and profitability ratios, to assess the company's financial position. The report calculates and interprets current, quick, debt-to-equity, interest coverage, ROCE, ROE, gross profit margin, and net profit margin ratios. Part B evaluates three strategic options for a clearance sale, recommending Option 2 (participation in a UK show) as the most suitable, supported by detailed calculations and estimated values. The report concludes with a summary of findings and recommendations, emphasizing Tuuli Plc's overall financial health and potential for future growth. The appendix includes detailed calculations and references.

ACC97003M
Financial Analysis, Appraisal & Decision Making
Financial Analysis, Appraisal & Decision Making
Paraphrase This Document
Need a fresh take? Get an instant paraphrase of this document with our AI Paraphraser
UMAR SHAHZAD
26211752
Contents
EXECUTIVE SUMMARY.........................................................................................................................2
Introduction..............................................................................................................................................3
PART-A......................................................................................................................................................3
CRITICAL ANALYSIS OF RATIOS.......................................................................................................3
LIQUIDITY RATIOS.............................................................................................................................3
SOLVENCY RATIOS...........................................................................................................................4
PROFITABILITY RATIOS...................................................................................................................4
PART-B......................................................................................................................................................5
Option 1.................................................................................................................................................5
Option 2.................................................................................................................................................5
Option 3.................................................................................................................................................5
Recommendations for Option 2..........................................................................................................5
CONCLUSION..........................................................................................................................................6
APPENDIX................................................................................................................................................6
References...............................................................................................................................................8
1
UMAR SHAHZAD
26211752
EXECUTIVE SUMMARY
This reports is based in facts and figures taken from Tuuli Plc as calculations done on
the basis of provided financial statement of the company for the year 2020 and 2021.
Report is comprised of two parts and in part one analysis of ratios is done on the basis
of results to know the financial position of the company, for this liquidity, solvency and
profitability and other ratios are calculated which shows company’s overall performance
is good and Tuuli Plc is a stable company.
In part two of the report three given options are discussed to for clearance sale and
most suitable options is recommend on the basis of facts and figures.
Recommendations are made for future betterment of the company by analysing the
current situation from the available options. In first option one profit and loss is
discussed but as per evaluation company can face loss if it adopt option 1 so company
has two more options of UK show and investment in social housing project and as per
calculations these both methods are suitable for company and recommendation are
also made on the basis of selected option.
2
⊘ This is a preview!⊘
Do you want full access?
Subscribe today to unlock all pages.
Trusted by 1+ million students worldwide
UMAR SHAHZAD
26211752
Introduction
Tuuli Plc is a growing organisation in energy sector which has started in 2000 as a wind
turbine company but later on expanded business to energy sector. As a new employee
in organisation under graduate scheme company’s financial statement is elaborated in
detail to know the scenario of Tuuli Plc and its future. Based on different calculations
and current issues or opportunities recommendations will be made at the end of the
report.
This report is based on two parts; part A and part B. In part A, financial Ratio analysis
will be done in the report to know the current position of company in different
perspectives along with comparison with previous year. Liquidity ratios will be calculated
to know about short term obligations of company (Sherman, 2015) in year 2020 and
2021. Solvency ratios will also be discussed to know the profitability status of Tuuli Plc
and investment or earnings ratios will also be discussed to know performance of
company in investor’s point of view. In part B different optioned will be discussed and
one best fit option will be chosen for company along with its recommendations.
PART-A
CRITICAL ANALYSIS OF RATIOS
Financial ratios gives the best picture of company’s overall performance and it helps to
analyses that how company is performing currently and how it performed in past
(Manzler, 2004).
LIQUIDITY RATIOS
Liquidity is very important for any company because a company can survive in loss but
can never survive without liquidity (Rashid, 2021). Liquidity ratios shows ability of
company to pay its debts and short term obligations (Sherman, 2015). Short term
coverage for the company is essential (Davies & Crawford, 2012). As it can see in
calculations that current ratio of Tuuli Plc in 2020 is 1.55 and in 2021 is 1.75 so it means
company is strong enough to pay its debts and it even stronger in 2021 as compared to
2020 which is a good sign. In 2020 it seems company was short in cash to its short term
obligations but in 2021 company had enough cash to meet its short term obligations.
3
Paraphrase This Document
Need a fresh take? Get an instant paraphrase of this document with our AI Paraphraser
UMAR SHAHZAD
26211752
Quick ratio of company in 2020 is 1.18 and in 2021 is 1.38 and that is good sign for
Tuuli Plc in paying off its liabilities.
SOLVENCY RATIOS
Solvency ratios generally measures the company’s profitability and it shows a clear view
to investors that how company can pay its debts in long term. Entrepreneurs look at
solvency ratios of the most of the times to check cash flows and management flexibility
(Vasiu & Gheorghe, 2014).
Debt to equity ratio of Tuuli Plc in 2020 is 3.22 and in 2021 is 2.43 It indicates in 2020
more of business was funded by equity. And in 2020 company was more dependent on
equity as compared to 2021. So it is a good sign for company as their debt is
decreasing as compared to previous year. Here it can be analyzed that high debt to
equity ratio show more investment in loan capital as compared to equity (Patel, 2015).
Interest coverage ratio depicts how strong is firm to pay interest on debt so according to
results of Calculation, Company in both years 2020 and 2021 is good enough to pay the
interest on debt. In 2020 company was 5.22 times stronger to pay interest and in 2021 it
is 4.45 times stronger in paying off interest on debts.
PROFITABILITY RATIOS
Profitability ratios depicts that how efficient is the company in generating profit as it
investigates the profitability of company in different perspectives with net profit and
gross profit margin and ROCE (return on capital employed) & ROE ( return of equity)
depicts how company is valuable for its shareholders. Profitability indicates that how
much capital is invested (Rashid, 2021).
ROCE ratio in 2020 is 7.40% and in 2021 is 6.85%, it shows how well company is
generating profit from capital so according to calculations in 2020 ratio was higher but in
2021 it has decreased which is indicates little decrease in growth of company and it also
shows less return on investment. High value in return on capital employed indicates
competitive advantage of company (Singh & Yadav, 2013). ROE in 2020 was 26.20%
and in 2021 it is 20.2%, this shows decrease in ability of company in profit generation
and growing the value of shareholders.
Gross profit margin generally shows how successful is the company in generating
revenue and in case of Tuuli Plc gross profit margin in 2020 was 26.7 and in 2021 it
decreased to 28.3 % which is a healthy sign for the company as its gross profit margin
is increased by 1.6%.
4
UMAR SHAHZAD
26211752
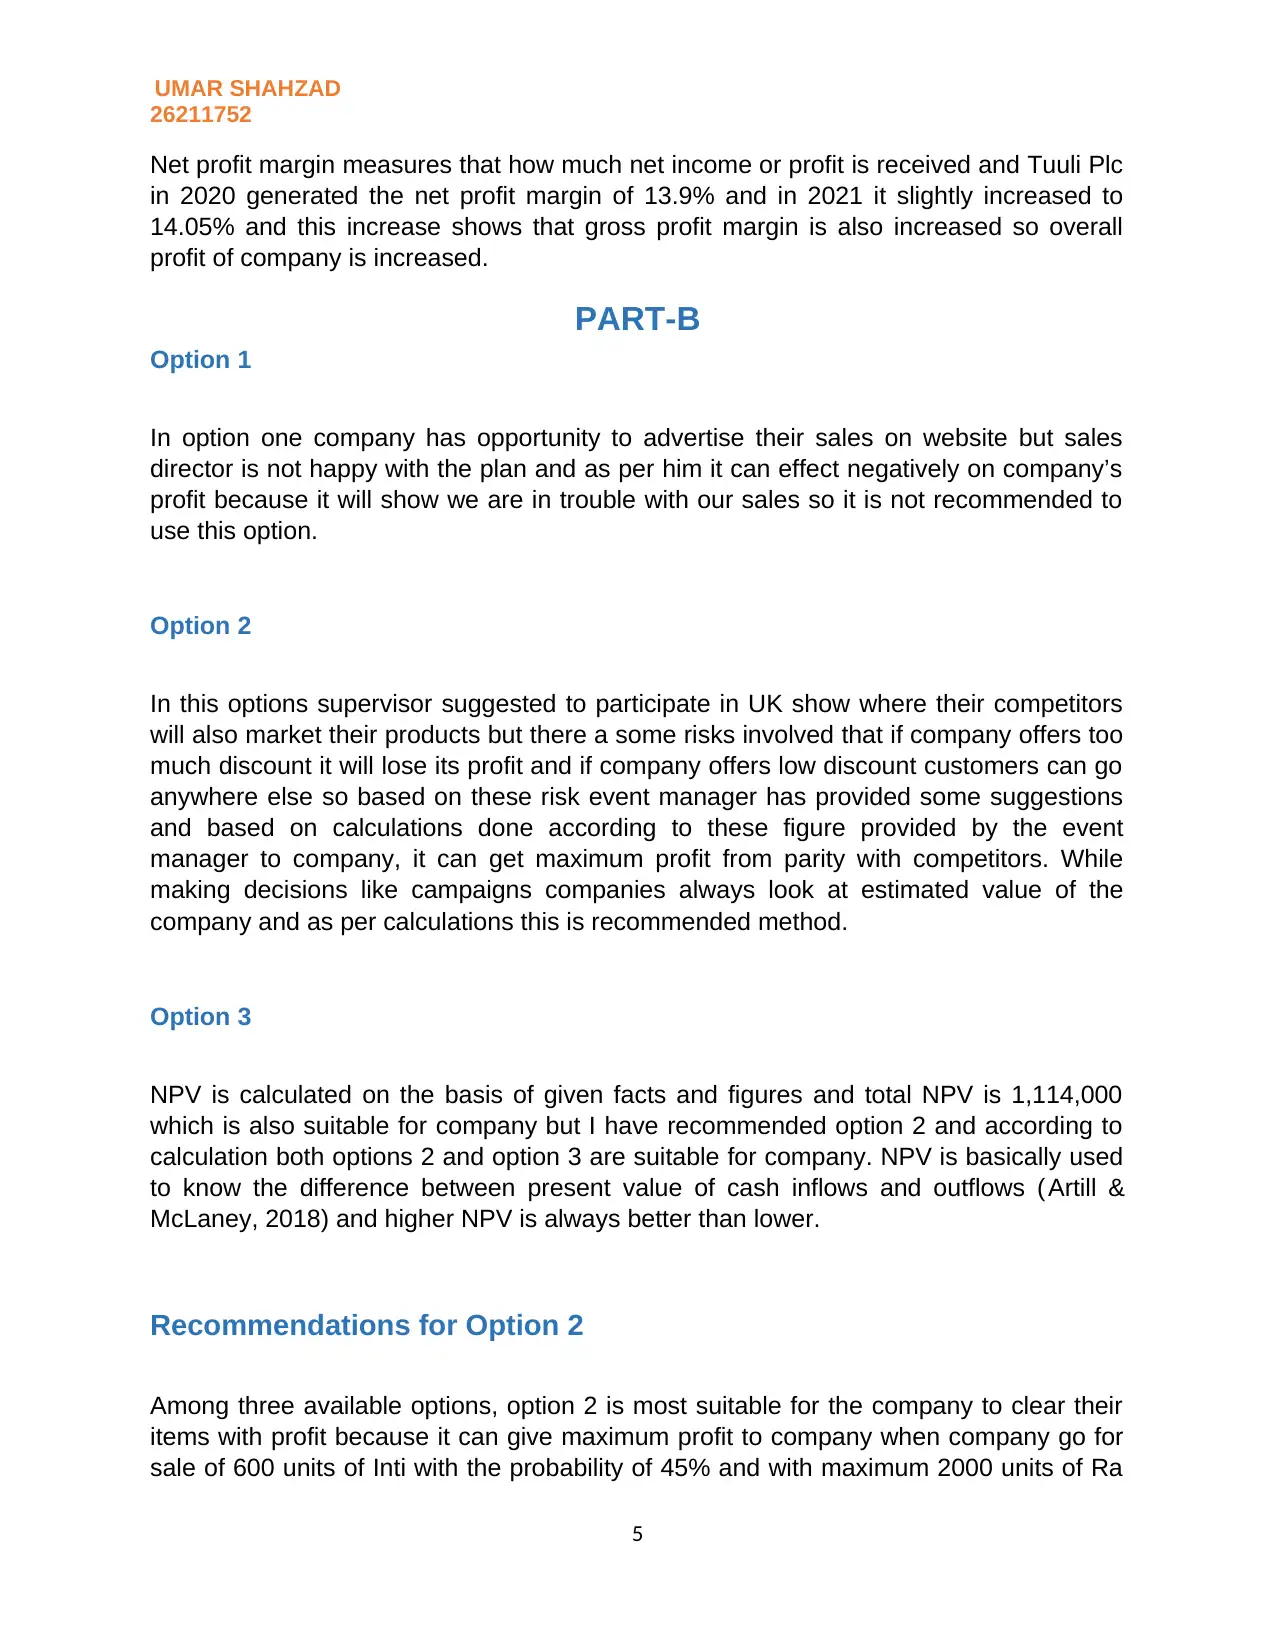
Net profit margin measures that how much net income or profit is received and Tuuli Plc
in 2020 generated the net profit margin of 13.9% and in 2021 it slightly increased to
14.05% and this increase shows that gross profit margin is also increased so overall
profit of company is increased.
PART-B
Option 1
In option one company has opportunity to advertise their sales on website but sales
director is not happy with the plan and as per him it can effect negatively on company’s
profit because it will show we are in trouble with our sales so it is not recommended to
use this option.
Option 2
In this options supervisor suggested to participate in UK show where their competitors
will also market their products but there a some risks involved that if company offers too
much discount it will lose its profit and if company offers low discount customers can go
anywhere else so based on these risk event manager has provided some suggestions
and based on calculations done according to these figure provided by the event
manager to company, it can get maximum profit from parity with competitors. While
making decisions like campaigns companies always look at estimated value of the
company and as per calculations this is recommended method.
Option 3
NPV is calculated on the basis of given facts and figures and total NPV is 1,114,000
which is also suitable for company but I have recommended option 2 and according to
calculation both options 2 and option 3 are suitable for company. NPV is basically used
to know the difference between present value of cash inflows and outflows ( Artill &
McLaney, 2018) and higher NPV is always better than lower.
Recommendations for Option 2
Among three available options, option 2 is most suitable for the company to clear their
items with profit because it can give maximum profit to company when company go for
sale of 600 units of Inti with the probability of 45% and with maximum 2000 units of Ra
5
26211752
Net profit margin measures that how much net income or profit is received and Tuuli Plc
in 2020 generated the net profit margin of 13.9% and in 2021 it slightly increased to
14.05% and this increase shows that gross profit margin is also increased so overall
profit of company is increased.
PART-B
Option 1
In option one company has opportunity to advertise their sales on website but sales
director is not happy with the plan and as per him it can effect negatively on company’s
profit because it will show we are in trouble with our sales so it is not recommended to
use this option.
Option 2
In this options supervisor suggested to participate in UK show where their competitors
will also market their products but there a some risks involved that if company offers too
much discount it will lose its profit and if company offers low discount customers can go
anywhere else so based on these risk event manager has provided some suggestions
and based on calculations done according to these figure provided by the event
manager to company, it can get maximum profit from parity with competitors. While
making decisions like campaigns companies always look at estimated value of the
company and as per calculations this is recommended method.
Option 3
NPV is calculated on the basis of given facts and figures and total NPV is 1,114,000
which is also suitable for company but I have recommended option 2 and according to
calculation both options 2 and option 3 are suitable for company. NPV is basically used
to know the difference between present value of cash inflows and outflows ( Artill &
McLaney, 2018) and higher NPV is always better than lower.
Recommendations for Option 2
Among three available options, option 2 is most suitable for the company to clear their
items with profit because it can give maximum profit to company when company go for
sale of 600 units of Inti with the probability of 45% and with maximum 2000 units of Ra
5
⊘ This is a preview!⊘
Do you want full access?
Subscribe today to unlock all pages.
Trusted by 1+ million students worldwide
UMAR SHAHZAD
26211752
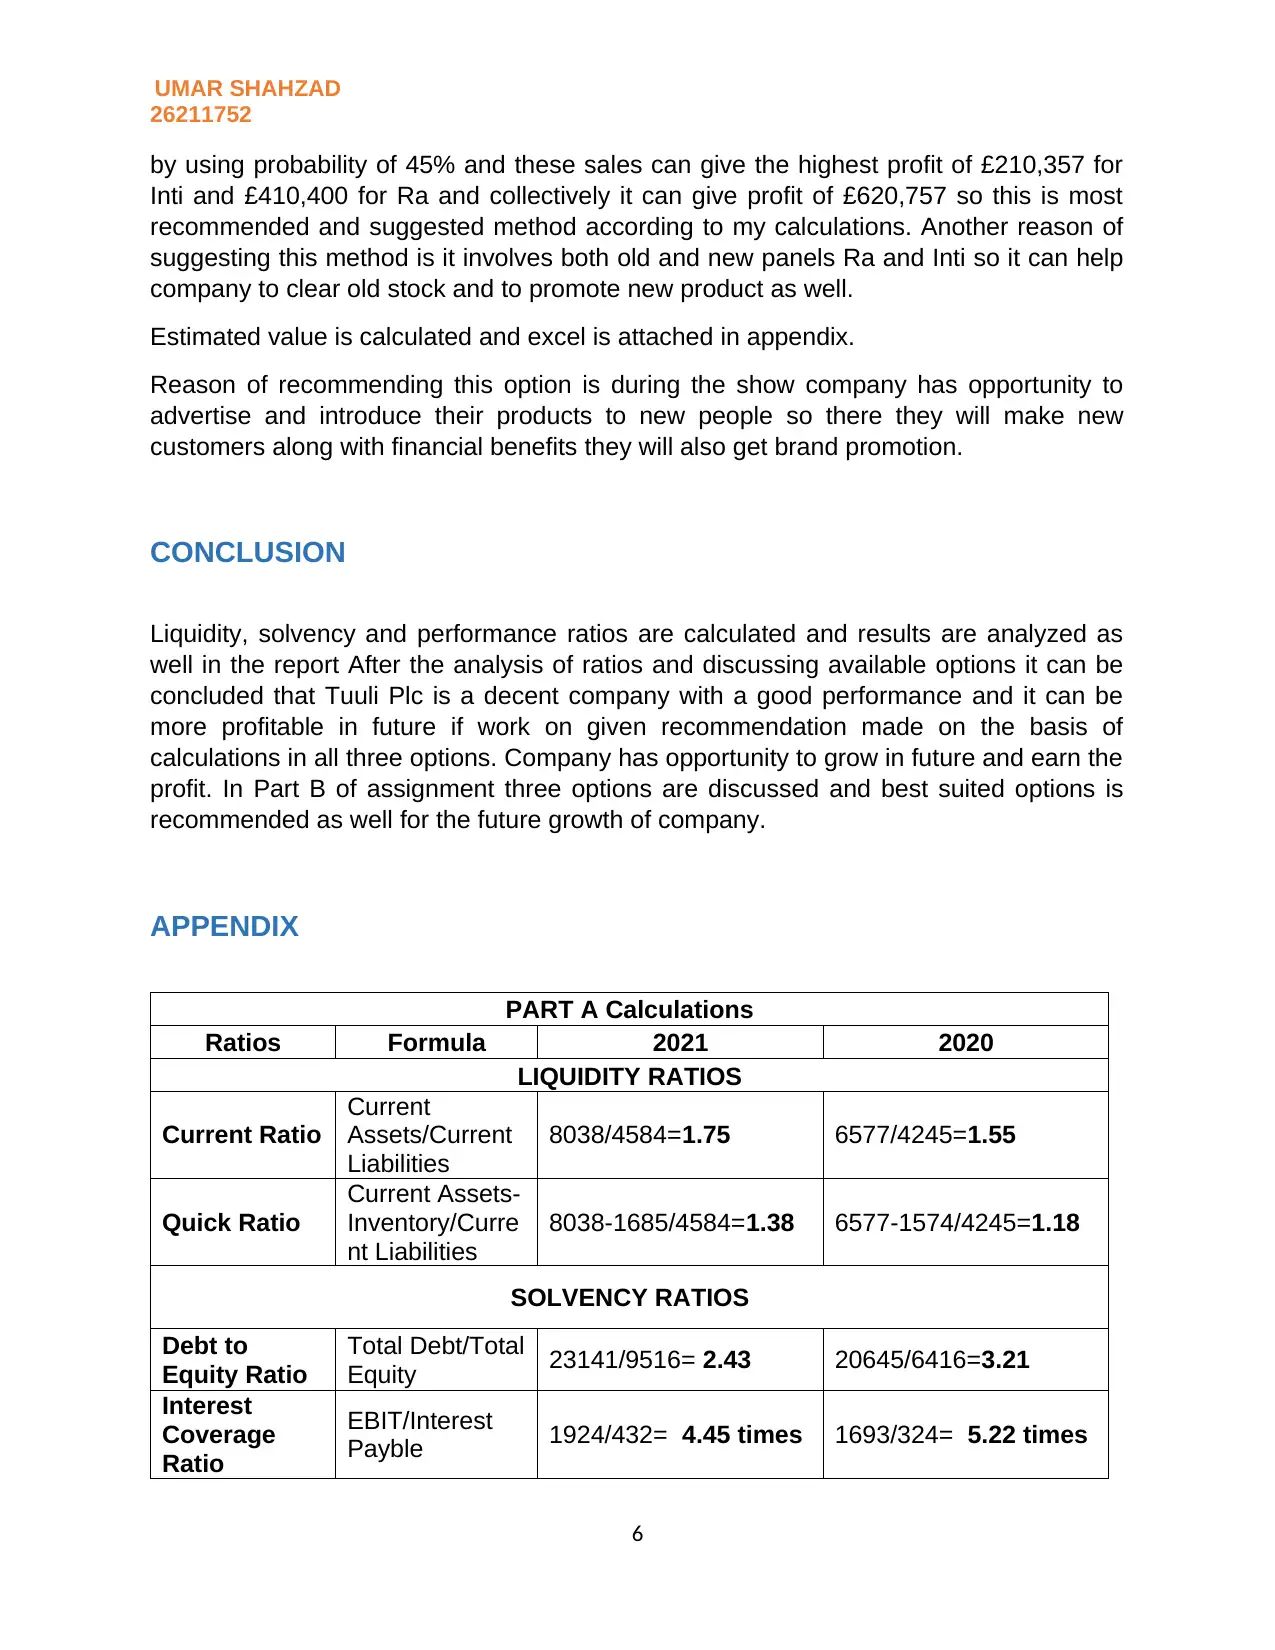
by using probability of 45% and these sales can give the highest profit of £210,357 for
Inti and £410,400 for Ra and collectively it can give profit of £620,757 so this is most
recommended and suggested method according to my calculations. Another reason of
suggesting this method is it involves both old and new panels Ra and Inti so it can help
company to clear old stock and to promote new product as well.
Estimated value is calculated and excel is attached in appendix.
Reason of recommending this option is during the show company has opportunity to
advertise and introduce their products to new people so there they will make new
customers along with financial benefits they will also get brand promotion.
CONCLUSION
Liquidity, solvency and performance ratios are calculated and results are analyzed as
well in the report After the analysis of ratios and discussing available options it can be
concluded that Tuuli Plc is a decent company with a good performance and it can be
more profitable in future if work on given recommendation made on the basis of
calculations in all three options. Company has opportunity to grow in future and earn the
profit. In Part B of assignment three options are discussed and best suited options is
recommended as well for the future growth of company.
APPENDIX
PART A Calculations
Ratios Formula 2021 2020
LIQUIDITY RATIOS
Current Ratio
Current
Assets/Current
Liabilities
8038/4584=1.75 6577/4245=1.55
Quick Ratio
Current Assets-
Inventory/Curre
nt Liabilities
8038-1685/4584=1.38 6577-1574/4245=1.18
SOLVENCY RATIOS
Debt to
Equity Ratio
Total Debt/Total
Equity 23141/9516= 2.43 20645/6416=3.21
Interest
Coverage
Ratio
EBIT/Interest
Payble 1924/432= 4.45 times 1693/324= 5.22 times
6
26211752
by using probability of 45% and these sales can give the highest profit of £210,357 for
Inti and £410,400 for Ra and collectively it can give profit of £620,757 so this is most
recommended and suggested method according to my calculations. Another reason of
suggesting this method is it involves both old and new panels Ra and Inti so it can help
company to clear old stock and to promote new product as well.
Estimated value is calculated and excel is attached in appendix.
Reason of recommending this option is during the show company has opportunity to
advertise and introduce their products to new people so there they will make new
customers along with financial benefits they will also get brand promotion.
CONCLUSION
Liquidity, solvency and performance ratios are calculated and results are analyzed as
well in the report After the analysis of ratios and discussing available options it can be
concluded that Tuuli Plc is a decent company with a good performance and it can be
more profitable in future if work on given recommendation made on the basis of
calculations in all three options. Company has opportunity to grow in future and earn the
profit. In Part B of assignment three options are discussed and best suited options is
recommended as well for the future growth of company.
APPENDIX
PART A Calculations
Ratios Formula 2021 2020
LIQUIDITY RATIOS
Current Ratio
Current
Assets/Current
Liabilities
8038/4584=1.75 6577/4245=1.55
Quick Ratio
Current Assets-
Inventory/Curre
nt Liabilities
8038-1685/4584=1.38 6577-1574/4245=1.18
SOLVENCY RATIOS
Debt to
Equity Ratio
Total Debt/Total
Equity 23141/9516= 2.43 20645/6416=3.21
Interest
Coverage
Ratio
EBIT/Interest
Payble 1924/432= 4.45 times 1693/324= 5.22 times
6
Paraphrase This Document
Need a fresh take? Get an instant paraphrase of this document with our AI Paraphraser
UMAR SHAHZAD
26211752
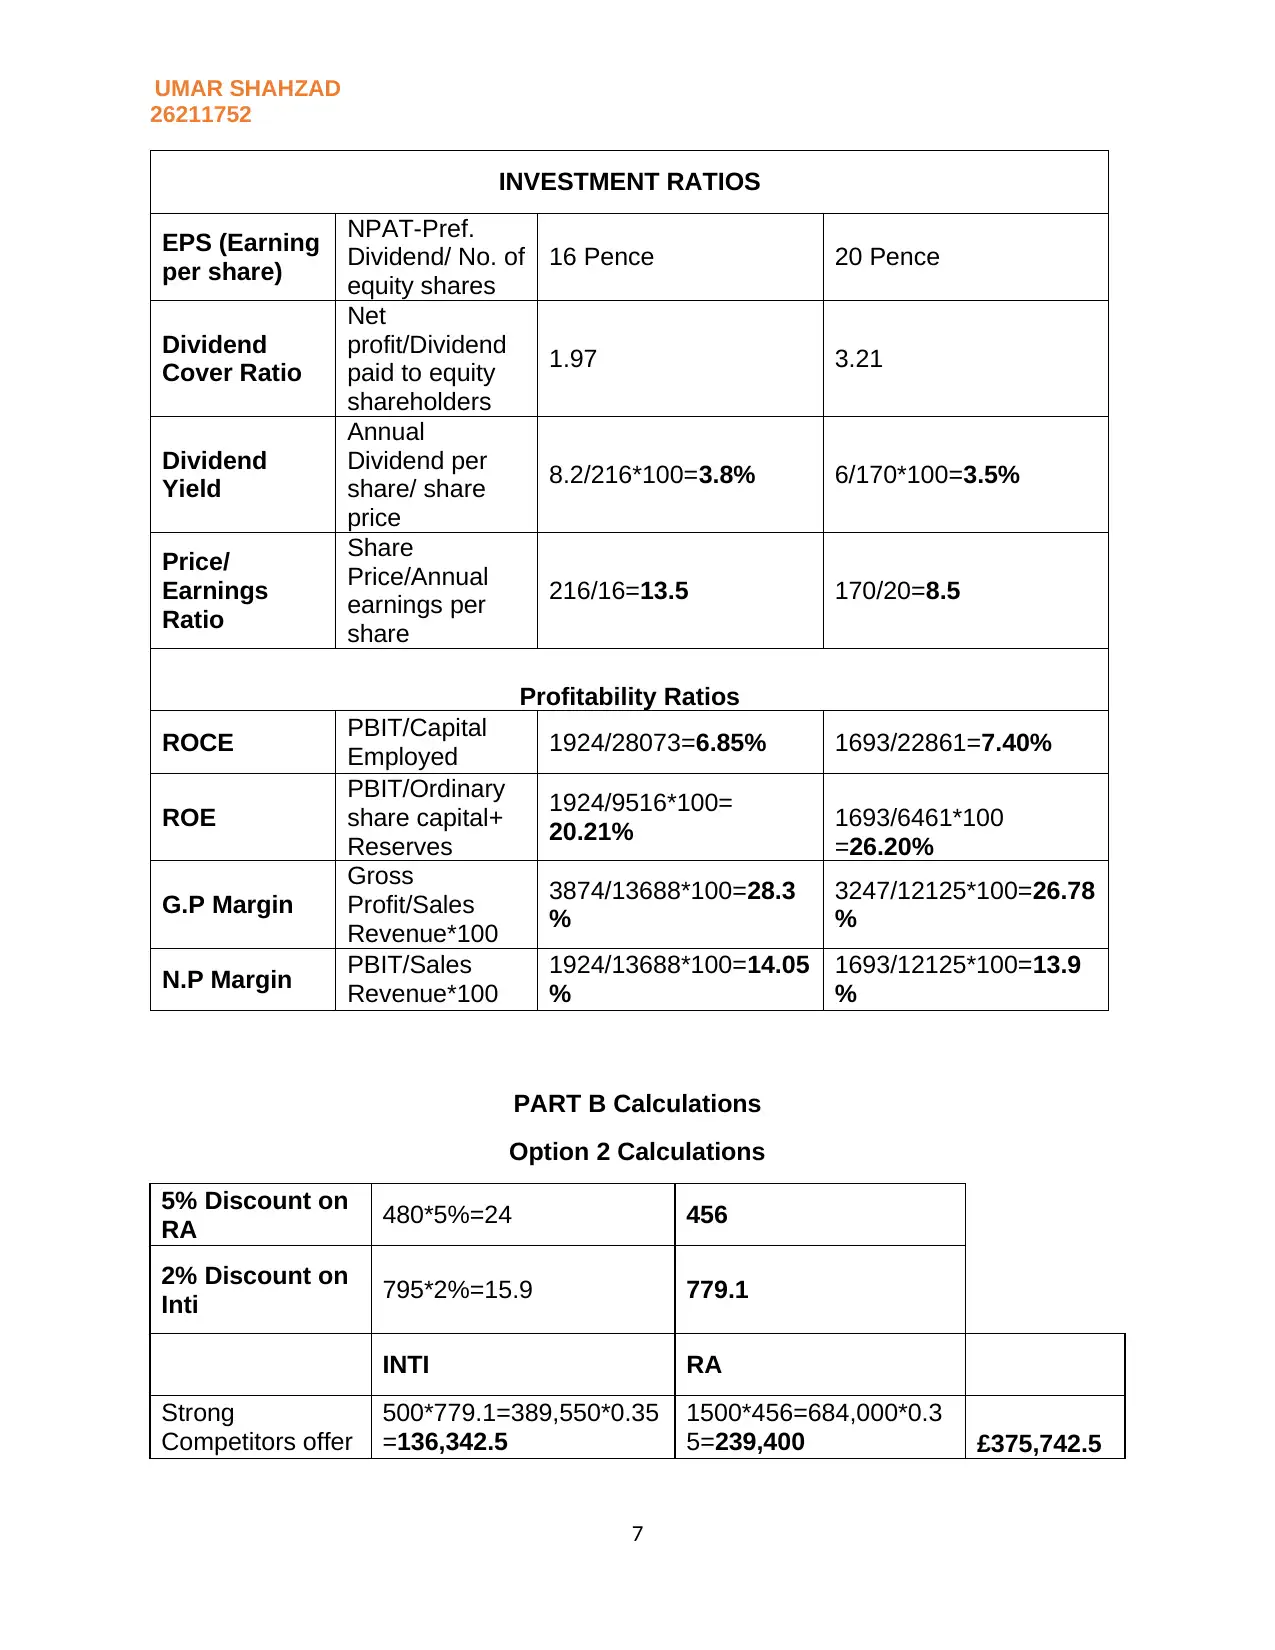
INVESTMENT RATIOS
EPS (Earning
per share)
NPAT-Pref.
Dividend/ No. of
equity shares
16 Pence 20 Pence
Dividend
Cover Ratio
Net
profit/Dividend
paid to equity
shareholders
1.97 3.21
Dividend
Yield
Annual
Dividend per
share/ share
price
8.2/216*100=3.8% 6/170*100=3.5%
Price/
Earnings
Ratio
Share
Price/Annual
earnings per
share
216/16=13.5 170/20=8.5
Profitability Ratios
ROCE PBIT/Capital
Employed 1924/28073=6.85% 1693/22861=7.40%
ROE
PBIT/Ordinary
share capital+
Reserves
1924/9516*100=
20.21% 1693/6461*100
=26.20%
G.P Margin
Gross
Profit/Sales
Revenue*100
3874/13688*100=28.3
%
3247/12125*100=26.78
%
N.P Margin PBIT/Sales
Revenue*100
1924/13688*100=14.05
%
1693/12125*100=13.9
%
PART B Calculations
Option 2 Calculations
5% Discount on
RA 480*5%=24 456
2% Discount on
Inti 795*2%=15.9 779.1
INTI RA
Strong
Competitors offer
500*779.1=389,550*0.35
=136,342.5
1500*456=684,000*0.3
5=239,400 £375,742.5
7
26211752
INVESTMENT RATIOS
EPS (Earning
per share)
NPAT-Pref.
Dividend/ No. of
equity shares
16 Pence 20 Pence
Dividend
Cover Ratio
Net
profit/Dividend
paid to equity
shareholders
1.97 3.21
Dividend
Yield
Annual
Dividend per
share/ share
price
8.2/216*100=3.8% 6/170*100=3.5%
Price/
Earnings
Ratio
Share
Price/Annual
earnings per
share
216/16=13.5 170/20=8.5
Profitability Ratios
ROCE PBIT/Capital
Employed 1924/28073=6.85% 1693/22861=7.40%
ROE
PBIT/Ordinary
share capital+
Reserves
1924/9516*100=
20.21% 1693/6461*100
=26.20%
G.P Margin
Gross
Profit/Sales
Revenue*100
3874/13688*100=28.3
%
3247/12125*100=26.78
%
N.P Margin PBIT/Sales
Revenue*100
1924/13688*100=14.05
%
1693/12125*100=13.9
%
PART B Calculations
Option 2 Calculations
5% Discount on
RA 480*5%=24 456
2% Discount on
Inti 795*2%=15.9 779.1
INTI RA
Strong
Competitors offer
500*779.1=389,550*0.35
=136,342.5
1500*456=684,000*0.3
5=239,400 £375,742.5
7
UMAR SHAHZAD
26211752
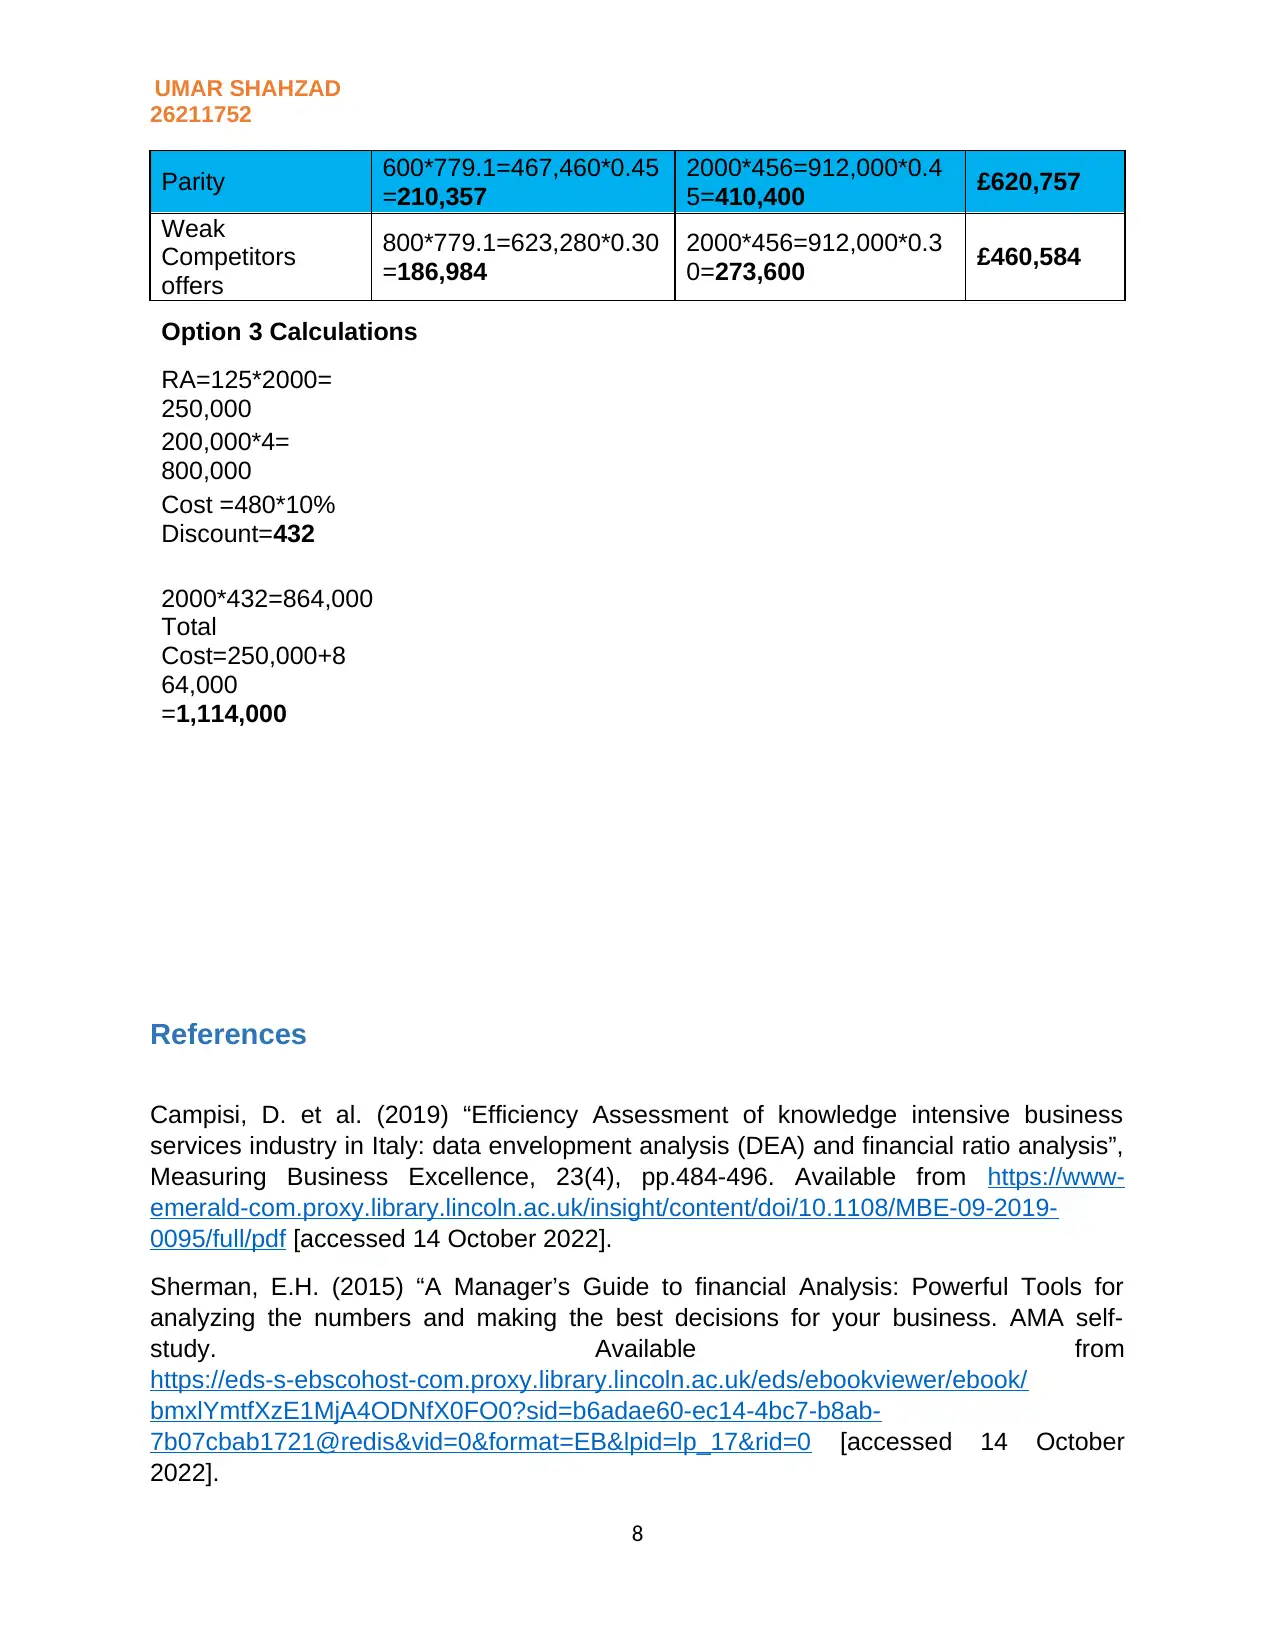
Parity 600*779.1=467,460*0.45
=210,357
2000*456=912,000*0.4
5=410,400 £620,757
Weak
Competitors
offers
800*779.1=623,280*0.30
=186,984
2000*456=912,000*0.3
0=273,600 £460,584
Option 3 Calculations
RA=125*2000=
250,000
200,000*4=
800,000
Cost =480*10%
Discount=432
2000*432=864,000
Total
Cost=250,000+8
64,000
=1,114,000
References
Campisi, D. et al. (2019) “Efficiency Assessment of knowledge intensive business
services industry in Italy: data envelopment analysis (DEA) and financial ratio analysis”,
Measuring Business Excellence, 23(4), pp.484-496. Available from https://www-
emerald-com.proxy.library.lincoln.ac.uk/insight/content/doi/10.1108/MBE-09-2019-
0095/full/pdf [accessed 14 October 2022].
Sherman, E.H. (2015) “A Manager’s Guide to financial Analysis: Powerful Tools for
analyzing the numbers and making the best decisions for your business. AMA self-
study. Available from
https://eds-s-ebscohost-com.proxy.library.lincoln.ac.uk/eds/ebookviewer/ebook/
bmxlYmtfXzE1MjA4ODNfX0FO0?sid=b6adae60-ec14-4bc7-b8ab-
7b07cbab1721@redis&vid=0&format=EB&lpid=lp_17&rid=0 [accessed 14 October
2022].
8
26211752
Parity 600*779.1=467,460*0.45
=210,357
2000*456=912,000*0.4
5=410,400 £620,757
Weak
Competitors
offers
800*779.1=623,280*0.30
=186,984
2000*456=912,000*0.3
0=273,600 £460,584
Option 3 Calculations
RA=125*2000=
250,000
200,000*4=
800,000
Cost =480*10%
Discount=432
2000*432=864,000
Total
Cost=250,000+8
64,000
=1,114,000
References
Campisi, D. et al. (2019) “Efficiency Assessment of knowledge intensive business
services industry in Italy: data envelopment analysis (DEA) and financial ratio analysis”,
Measuring Business Excellence, 23(4), pp.484-496. Available from https://www-
emerald-com.proxy.library.lincoln.ac.uk/insight/content/doi/10.1108/MBE-09-2019-
0095/full/pdf [accessed 14 October 2022].
Sherman, E.H. (2015) “A Manager’s Guide to financial Analysis: Powerful Tools for
analyzing the numbers and making the best decisions for your business. AMA self-
study. Available from
https://eds-s-ebscohost-com.proxy.library.lincoln.ac.uk/eds/ebookviewer/ebook/
bmxlYmtfXzE1MjA4ODNfX0FO0?sid=b6adae60-ec14-4bc7-b8ab-
7b07cbab1721@redis&vid=0&format=EB&lpid=lp_17&rid=0 [accessed 14 October
2022].
8
⊘ This is a preview!⊘
Do you want full access?
Subscribe today to unlock all pages.
Trusted by 1+ million students worldwide
UMAR SHAHZAD
26211752
Edmister, R.O. (1972) “An Empirical Test of Financial Ratio Analysis for small Business
Failure Prediction,” Journal of Financial & Quantitative Analysis. Cambridge University
Press, 7(2), pp. 1477-1493. Available from
https://www.cambridge.org/core/journals/journal-of-financial-and-quantitative-analysis/
article/abs/an-empirical-test-of-financial-ratio-analysis-for-small-business-failure-
prediction/5B6446728276923EE0657CA4ADD84F83 [Accessed 14 Oct 2022].
Rashid, C.A. (2021) “The Efficiency of financial ratios analysis to evaluate company’s
profitability.” Journal of Global Economic & Business, 2(4), pp.119-132. Available from
https://www.researchgate.net/publication/348686551_THE_EFFICIENCY_OF_FINANCI
AL_RATIOS_ANALYSIS_TO_EVALUATE_COMPANY'S_PROFITABILITY [Accessed
13 Oct 2021].
Manzler, D. (2004) “Liquidity Ratios & Business Performance.” Journal of Financial
Ratios Analysis, 67(45), pp12-16. Available from
https://ictactjournals.in/paper/IJMS_V6_I3_Paper_5_1273_1275.pdf [Accessed 13 Oct
2022].
Suthar, K.U. (2018) “Financial Ratio Analysis: A Theoretical Study.” International journal
of research in all subjects in Multi-languages, 6(3). Available from
http://www.raijmr.com/ijrsml/wp-content/uploads/2018/06/IJRSML_2018_vol06_issue_3
_Eng_09.pdf [Accessed 14 Oct 2022].
Srividhya, S, et al., (2020) “A study on financial ratio Analysis of Planys technologies
Pvt. Ltd. India.” Elementary Education online 19(3), pp. 4642-4652. Available from
https://www.ilkogretim-online.org/fulltext/218-1642781318.pdf [Accessed 14 Oct 2022].
Vasiu, D.E. & Gheorghe, I. (2014) “ Case study regarding solvency analysis, during
2006-2012, of the companies having the business line in Industry and construction,
Listed and Traded on the Bucharest Stock Exchange”. PP. 258-269. Available from
https://www.sciencedirect.com/science/article/pii/S2212567114007990?
ref=pdf_download&fr=RR-2&rr=75c2f824da8d8861 [Accessed 13 Oct 2022].
Patel, M.K.V. (2015) “Analysis of Solvency of selected FMCG Companies in India.”
Journal of research in Humanities and Soc. Sciences, 3(9). Available from
https://www.raijmr.com/ijrhs/wp-content/uploads/2017/11/IJRHS_2015_vol03_issue_09
_06.pdf [Accessed 13 Oct 2022].
Singh, J. & Yadav, P. (2013) “Return on Capital Employed- A tool for analyzing
Profitability of companies.” International Journal of Techno- Management Research,
1(1). Available from https://www.ijtmr.com/docs/vol1/ju2013(5).pdf [Accessed 14 Oct
2022].
Artill, P. & McLaney, E. (2018) “Accounting and Finance for non- specialists, Pearson
Education, Limited, Harlow. Available from https://ebookcentral-proquest-
com.proxy.library.lincoln.ac.uk/lib/ulinc/detail.action?docID=5601284# [Accessed 14 Oct
2022].
9
Paraphrase This Document
Need a fresh take? Get an instant paraphrase of this document with our AI Paraphraser

UMAR SHAHZAD
26211752
10
26211752
10
1 out of 11
Related Documents


Your All-in-One AI-Powered Toolkit for Academic Success.
+13062052269
info@desklib.com
Available 24*7 on WhatsApp / Email
![[object Object]](/_next/static/media/star-bottom.7253800d.svg)
Unlock your academic potential
Copyright © 2020–2026 A2Z Services. All Rights Reserved. Developed and managed by ZUCOL.