Business Accounting & Finance: Financial Ratio & Investment Analysis
VerifiedAdded on 2024/05/17
|17
|3558
|174
Report
AI Summary
This report provides a comprehensive financial analysis of three UK gambling companies—William Hill, Ladbrokes, and Paddy Power—using financial ratio analysis to assess their profitability, liquidity, operational efficiency, and gearing. The analysis covers the period from 2014 to 2016, comparing key financial ratios such as gross profit margin, EBIT margin, ROE, current ratio, quick ratio, net assets turnover, interest cover, collection period, credit period, and gearing ratio. The report identifies Paddy Power as the best-performing company due to its superior profitability, liquidity, and operational efficiency, while Ladbrokes is identified as the poorest-performing company, with recommendations for improving its profitability, efficiency, and liquidity. Additionally, the report outlines the key stages in the capital investment decision-making process and explains the key methods of investment appraisal, including payback period, accounting rate of return, net present value, and internal rate of return.

ACCOUNTING AND FINANCE FOR MANAGERS
Paraphrase This Document
Need a fresh take? Get an instant paraphrase of this document with our AI Paraphraser
Table of contents
Section A..................................................................................................................................... 3
1.a Financial ratio analysis...........................................................................................................3
1.b Identifying the best performing company.............................................................................11
1.c Identifying the poor performing company.............................................................................11
Section B................................................................................................................................... 12
2.a Identifying and explaining the key stages in the capital investment decision making process
.................................................................................................................................................. 12
2.b Identifying and explaining the key methods of investment appraisal....................................14
Reference list............................................................................................................................. 17
Section A
1.a Financial ratio analysis
Financial ratios can be considered as one of the best performance indicators of the companies.
Considering the growth scenario of the Gambling industry in the United Kingdom, it can be
stated that analyzing the financial performances of the companies is very important. Here, the
performances of the three Gambling companies in UK have been analyzed using the financial
ratios:
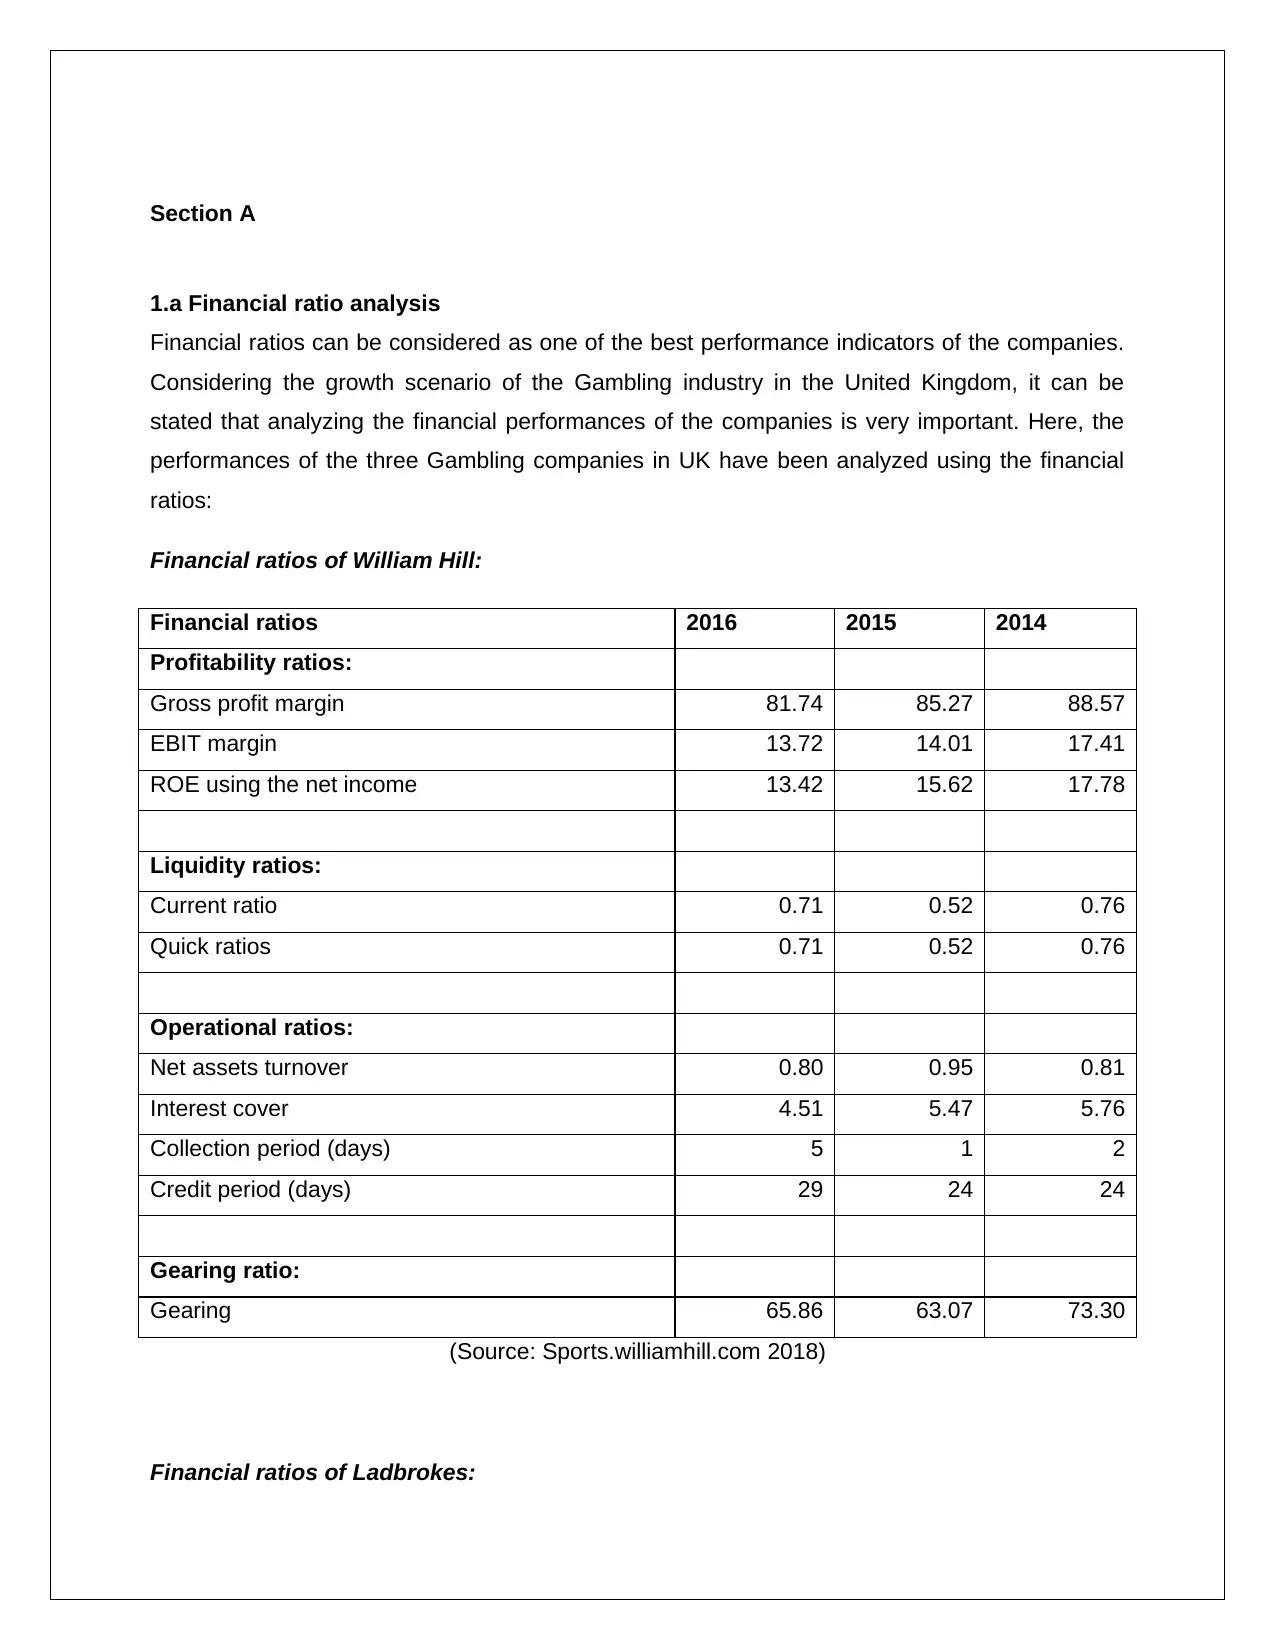
Financial ratios of William Hill:
Financial ratios 2016 2015 2014
Profitability ratios:
Gross profit margin 81.74 85.27 88.57
EBIT margin 13.72 14.01 17.41
ROE using the net income 13.42 15.62 17.78
Liquidity ratios:
Current ratio 0.71 0.52 0.76
Quick ratios 0.71 0.52 0.76
Operational ratios:
Net assets turnover 0.80 0.95 0.81
Interest cover 4.51 5.47 5.76
Collection period (days) 5 1 2
Credit period (days) 29 24 24
Gearing ratio:
Gearing 65.86 63.07 73.30
(Source: Sports.williamhill.com 2018)
Financial ratios of Ladbrokes:
1.a Financial ratio analysis
Financial ratios can be considered as one of the best performance indicators of the companies.
Considering the growth scenario of the Gambling industry in the United Kingdom, it can be
stated that analyzing the financial performances of the companies is very important. Here, the
performances of the three Gambling companies in UK have been analyzed using the financial
ratios:
Financial ratios of William Hill:
Financial ratios 2016 2015 2014
Profitability ratios:
Gross profit margin 81.74 85.27 88.57
EBIT margin 13.72 14.01 17.41
ROE using the net income 13.42 15.62 17.78
Liquidity ratios:
Current ratio 0.71 0.52 0.76
Quick ratios 0.71 0.52 0.76
Operational ratios:
Net assets turnover 0.80 0.95 0.81
Interest cover 4.51 5.47 5.76
Collection period (days) 5 1 2
Credit period (days) 29 24 24
Gearing ratio:
Gearing 65.86 63.07 73.30
(Source: Sports.williamhill.com 2018)
Financial ratios of Ladbrokes:
⊘ This is a preview!⊘
Do you want full access?
Subscribe today to unlock all pages.
Trusted by 1+ million students worldwide
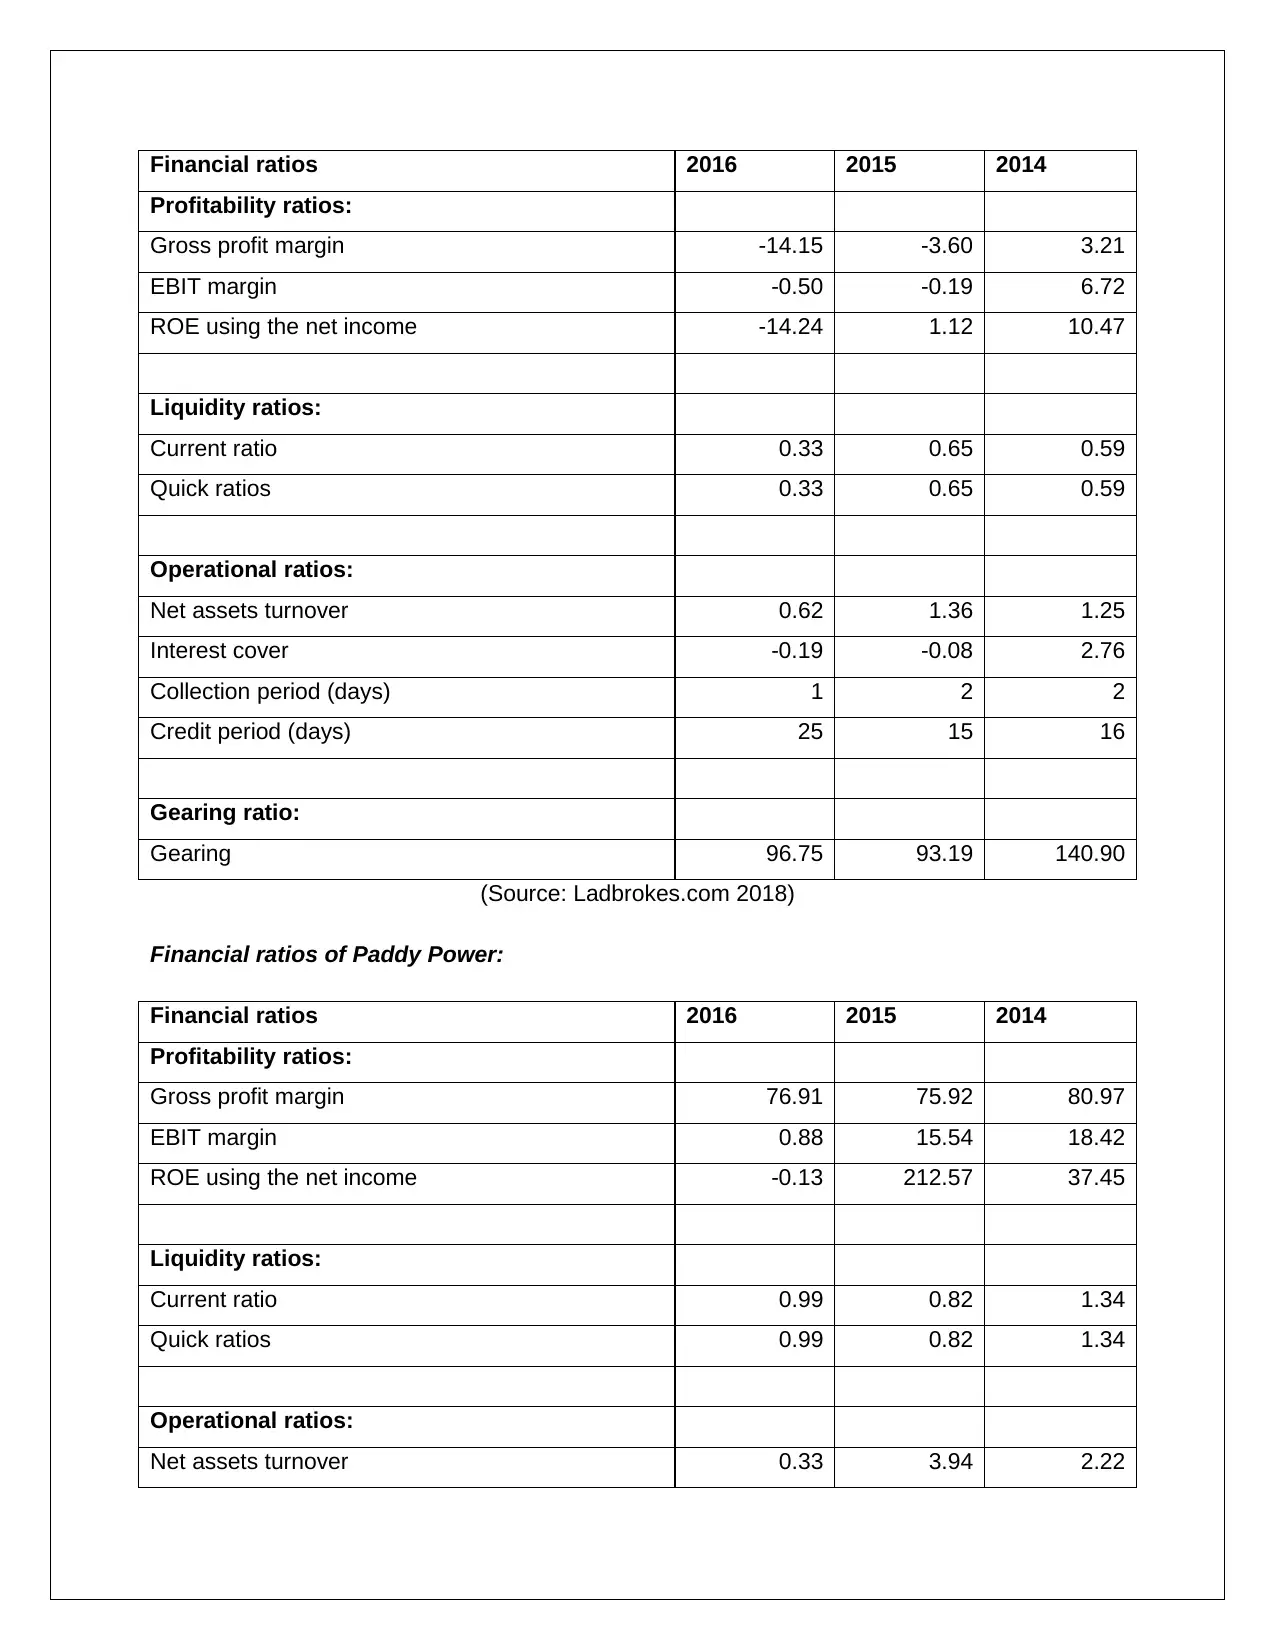
Financial ratios 2016 2015 2014
Profitability ratios:
Gross profit margin -14.15 -3.60 3.21
EBIT margin -0.50 -0.19 6.72
ROE using the net income -14.24 1.12 10.47
Liquidity ratios:
Current ratio 0.33 0.65 0.59
Quick ratios 0.33 0.65 0.59
Operational ratios:
Net assets turnover 0.62 1.36 1.25
Interest cover -0.19 -0.08 2.76
Collection period (days) 1 2 2
Credit period (days) 25 15 16
Gearing ratio:
Gearing 96.75 93.19 140.90
(Source: Ladbrokes.com 2018)
Financial ratios of Paddy Power:
Financial ratios 2016 2015 2014
Profitability ratios:
Gross profit margin 76.91 75.92 80.97
EBIT margin 0.88 15.54 18.42
ROE using the net income -0.13 212.57 37.45
Liquidity ratios:
Current ratio 0.99 0.82 1.34
Quick ratios 0.99 0.82 1.34
Operational ratios:
Net assets turnover 0.33 3.94 2.22
Profitability ratios:
Gross profit margin -14.15 -3.60 3.21
EBIT margin -0.50 -0.19 6.72
ROE using the net income -14.24 1.12 10.47
Liquidity ratios:
Current ratio 0.33 0.65 0.59
Quick ratios 0.33 0.65 0.59
Operational ratios:
Net assets turnover 0.62 1.36 1.25
Interest cover -0.19 -0.08 2.76
Collection period (days) 1 2 2
Credit period (days) 25 15 16
Gearing ratio:
Gearing 96.75 93.19 140.90
(Source: Ladbrokes.com 2018)
Financial ratios of Paddy Power:
Financial ratios 2016 2015 2014
Profitability ratios:
Gross profit margin 76.91 75.92 80.97
EBIT margin 0.88 15.54 18.42
ROE using the net income -0.13 212.57 37.45
Liquidity ratios:
Current ratio 0.99 0.82 1.34
Quick ratios 0.99 0.82 1.34
Operational ratios:
Net assets turnover 0.33 3.94 2.22
Paraphrase This Document
Need a fresh take? Get an instant paraphrase of this document with our AI Paraphraser
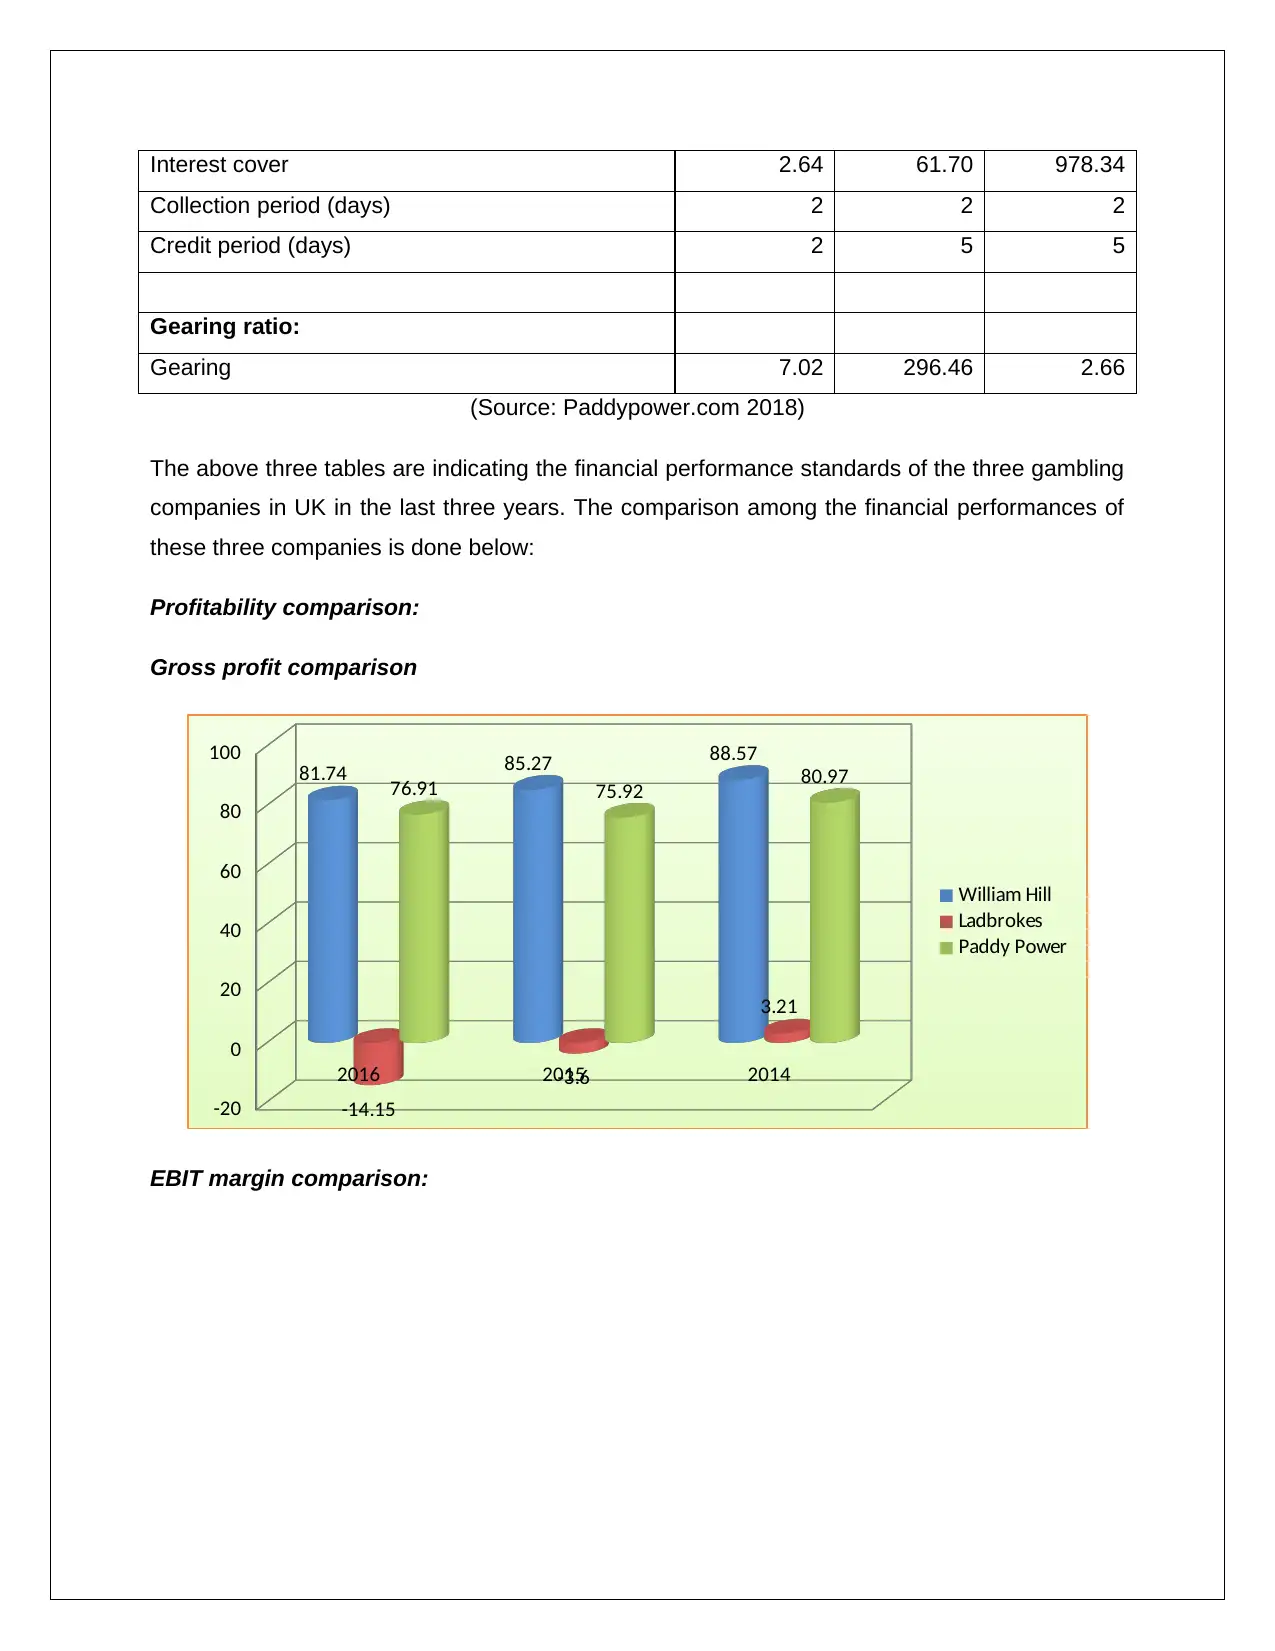
Interest cover 2.64 61.70 978.34
Collection period (days) 2 2 2
Credit period (days) 2 5 5
Gearing ratio:
Gearing 7.02 296.46 2.66
(Source: Paddypower.com 2018)
The above three tables are indicating the financial performance standards of the three gambling
companies in UK in the last three years. The comparison among the financial performances of
these three companies is done below:
Profitability comparison:
Gross profit comparison
2016 2015 2014
-20
0
20
40
60
80
100
81.74 85.27 88.57
-14.15
-3.6
3.21
76.91 75.92 80.97
William Hill
Ladbrokes
Paddy Power
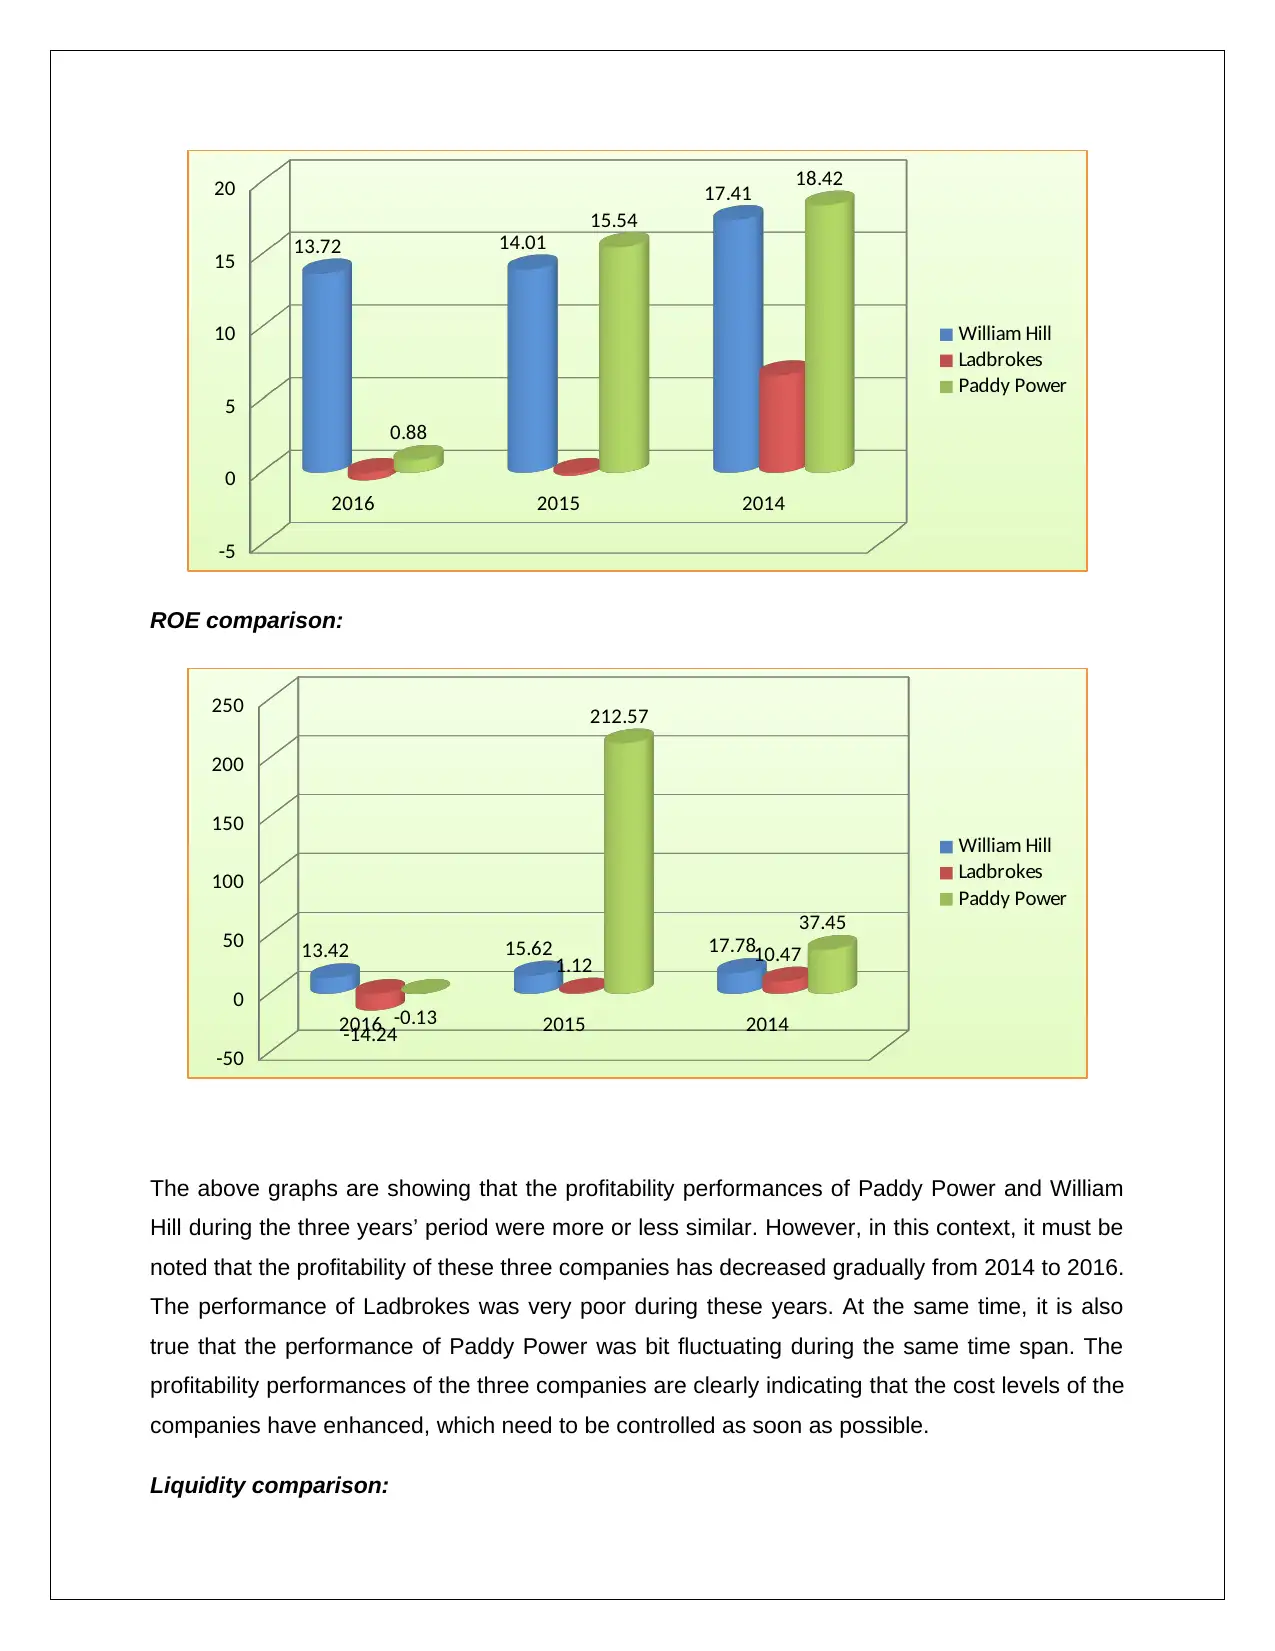
EBIT margin comparison:
Collection period (days) 2 2 2
Credit period (days) 2 5 5
Gearing ratio:
Gearing 7.02 296.46 2.66
(Source: Paddypower.com 2018)
The above three tables are indicating the financial performance standards of the three gambling
companies in UK in the last three years. The comparison among the financial performances of
these three companies is done below:
Profitability comparison:
Gross profit comparison
2016 2015 2014
-20
0
20
40
60
80
100
81.74 85.27 88.57
-14.15
-3.6
3.21
76.91 75.92 80.97
William Hill
Ladbrokes
Paddy Power
EBIT margin comparison:
2016 2015 2014
-5
0
5
10
15
20
13.72 14.01
17.41
0.88
15.54
18.42
William Hill
Ladbrokes
Paddy Power
ROE comparison:
2016 2015 2014
-50
0
50
100
150
200
250
13.42 15.62 17.78
-14.24
1.12 10.47
-0.13
212.57
37.45
William Hill
Ladbrokes
Paddy Power
The above graphs are showing that the profitability performances of Paddy Power and William
Hill during the three years’ period were more or less similar. However, in this context, it must be
noted that the profitability of these three companies has decreased gradually from 2014 to 2016.
The performance of Ladbrokes was very poor during these years. At the same time, it is also
true that the performance of Paddy Power was bit fluctuating during the same time span. The
profitability performances of the three companies are clearly indicating that the cost levels of the
companies have enhanced, which need to be controlled as soon as possible.
Liquidity comparison:
⊘ This is a preview!⊘
Do you want full access?
Subscribe today to unlock all pages.
Trusted by 1+ million students worldwide
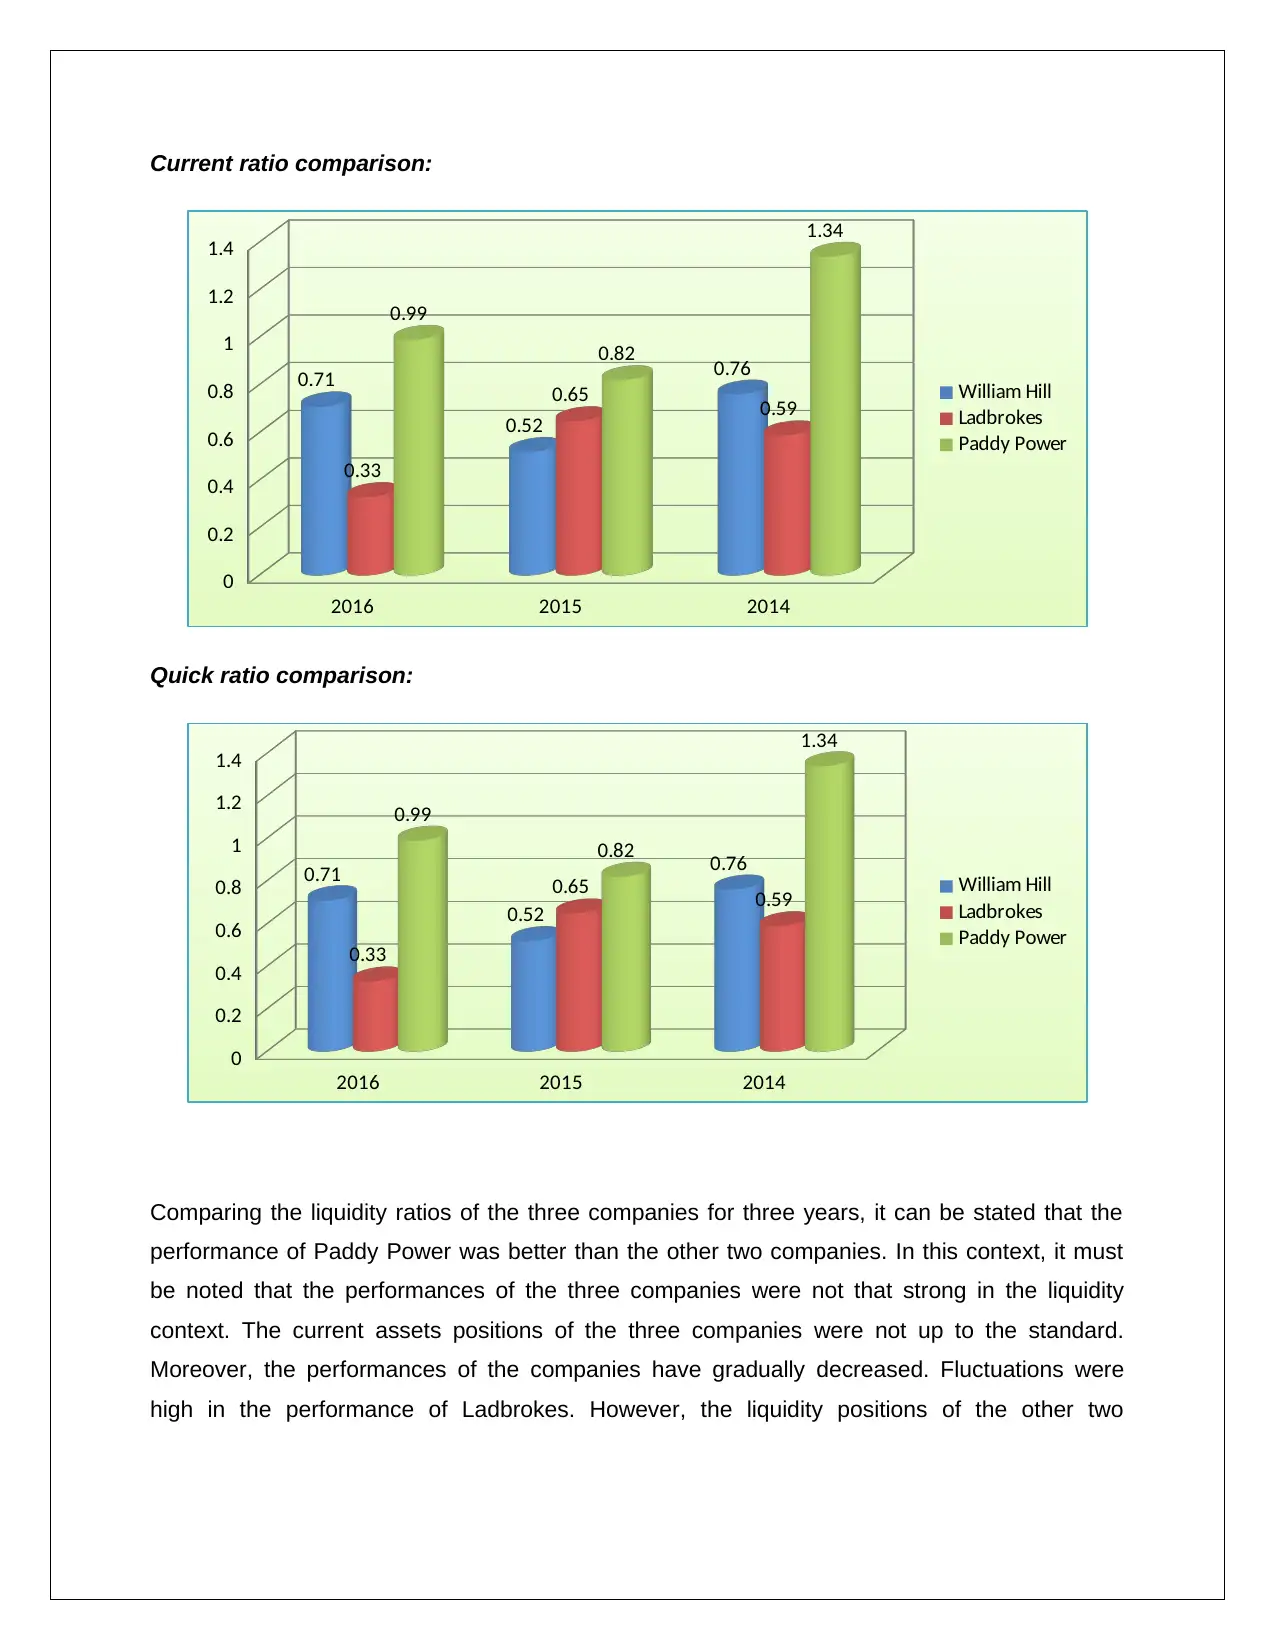
Current ratio comparison:
2016 2015 2014
0
0.2
0.4
0.6
0.8
1
1.2
1.4
0.71
0.52
0.76
0.33
0.65 0.59
0.99
0.82
1.34
William Hill
Ladbrokes
Paddy Power
Quick ratio comparison:
2016 2015 2014
0
0.2
0.4
0.6
0.8
1
1.2
1.4
0.71
0.52
0.76
0.33
0.65 0.59
0.99
0.82
1.34
William Hill
Ladbrokes
Paddy Power
Comparing the liquidity ratios of the three companies for three years, it can be stated that the
performance of Paddy Power was better than the other two companies. In this context, it must
be noted that the performances of the three companies were not that strong in the liquidity
context. The current assets positions of the three companies were not up to the standard.
Moreover, the performances of the companies have gradually decreased. Fluctuations were
high in the performance of Ladbrokes. However, the liquidity positions of the other two
2016 2015 2014
0
0.2
0.4
0.6
0.8
1
1.2
1.4
0.71
0.52
0.76
0.33
0.65 0.59
0.99
0.82
1.34
William Hill
Ladbrokes
Paddy Power
Quick ratio comparison:
2016 2015 2014
0
0.2
0.4
0.6
0.8
1
1.2
1.4
0.71
0.52
0.76
0.33
0.65 0.59
0.99
0.82
1.34
William Hill
Ladbrokes
Paddy Power
Comparing the liquidity ratios of the three companies for three years, it can be stated that the
performance of Paddy Power was better than the other two companies. In this context, it must
be noted that the performances of the three companies were not that strong in the liquidity
context. The current assets positions of the three companies were not up to the standard.
Moreover, the performances of the companies have gradually decreased. Fluctuations were
high in the performance of Ladbrokes. However, the liquidity positions of the other two
Paraphrase This Document
Need a fresh take? Get an instant paraphrase of this document with our AI Paraphraser
companies were also fluctuating. It means in the coming years the companies need to enhance
their short term assets to improve the situation.
Comparing the operational ratios:
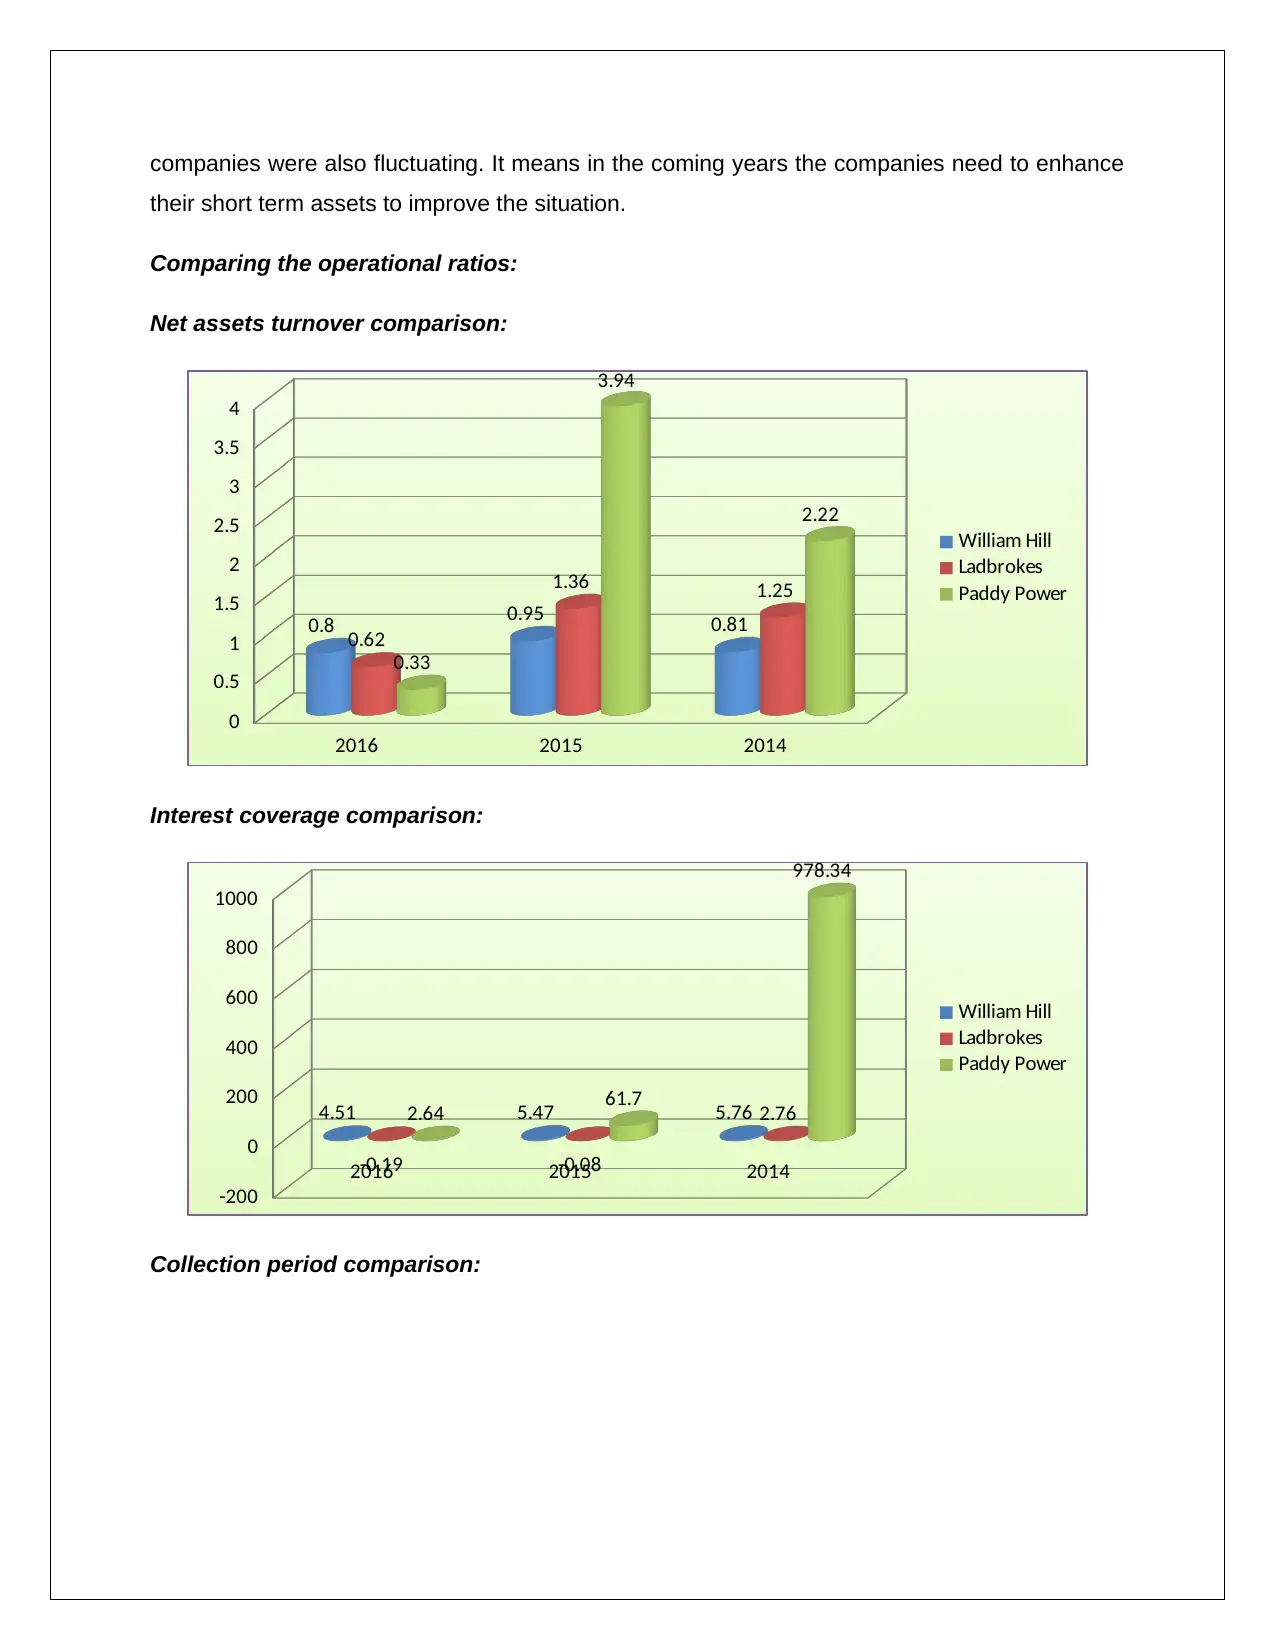
Net assets turnover comparison:
2016 2015 2014
0
0.5
1
1.5
2
2.5
3
3.5
4
0.8 0.95 0.81
0.62
1.36 1.25
0.33
3.94
2.22
William Hill
Ladbrokes
Paddy Power
Interest coverage comparison:
2016 2015 2014
-200
0
200
400
600
800
1000
4.51 5.47 5.76
-0.19 -0.08
2.762.64 61.7
978.34
William Hill
Ladbrokes
Paddy Power
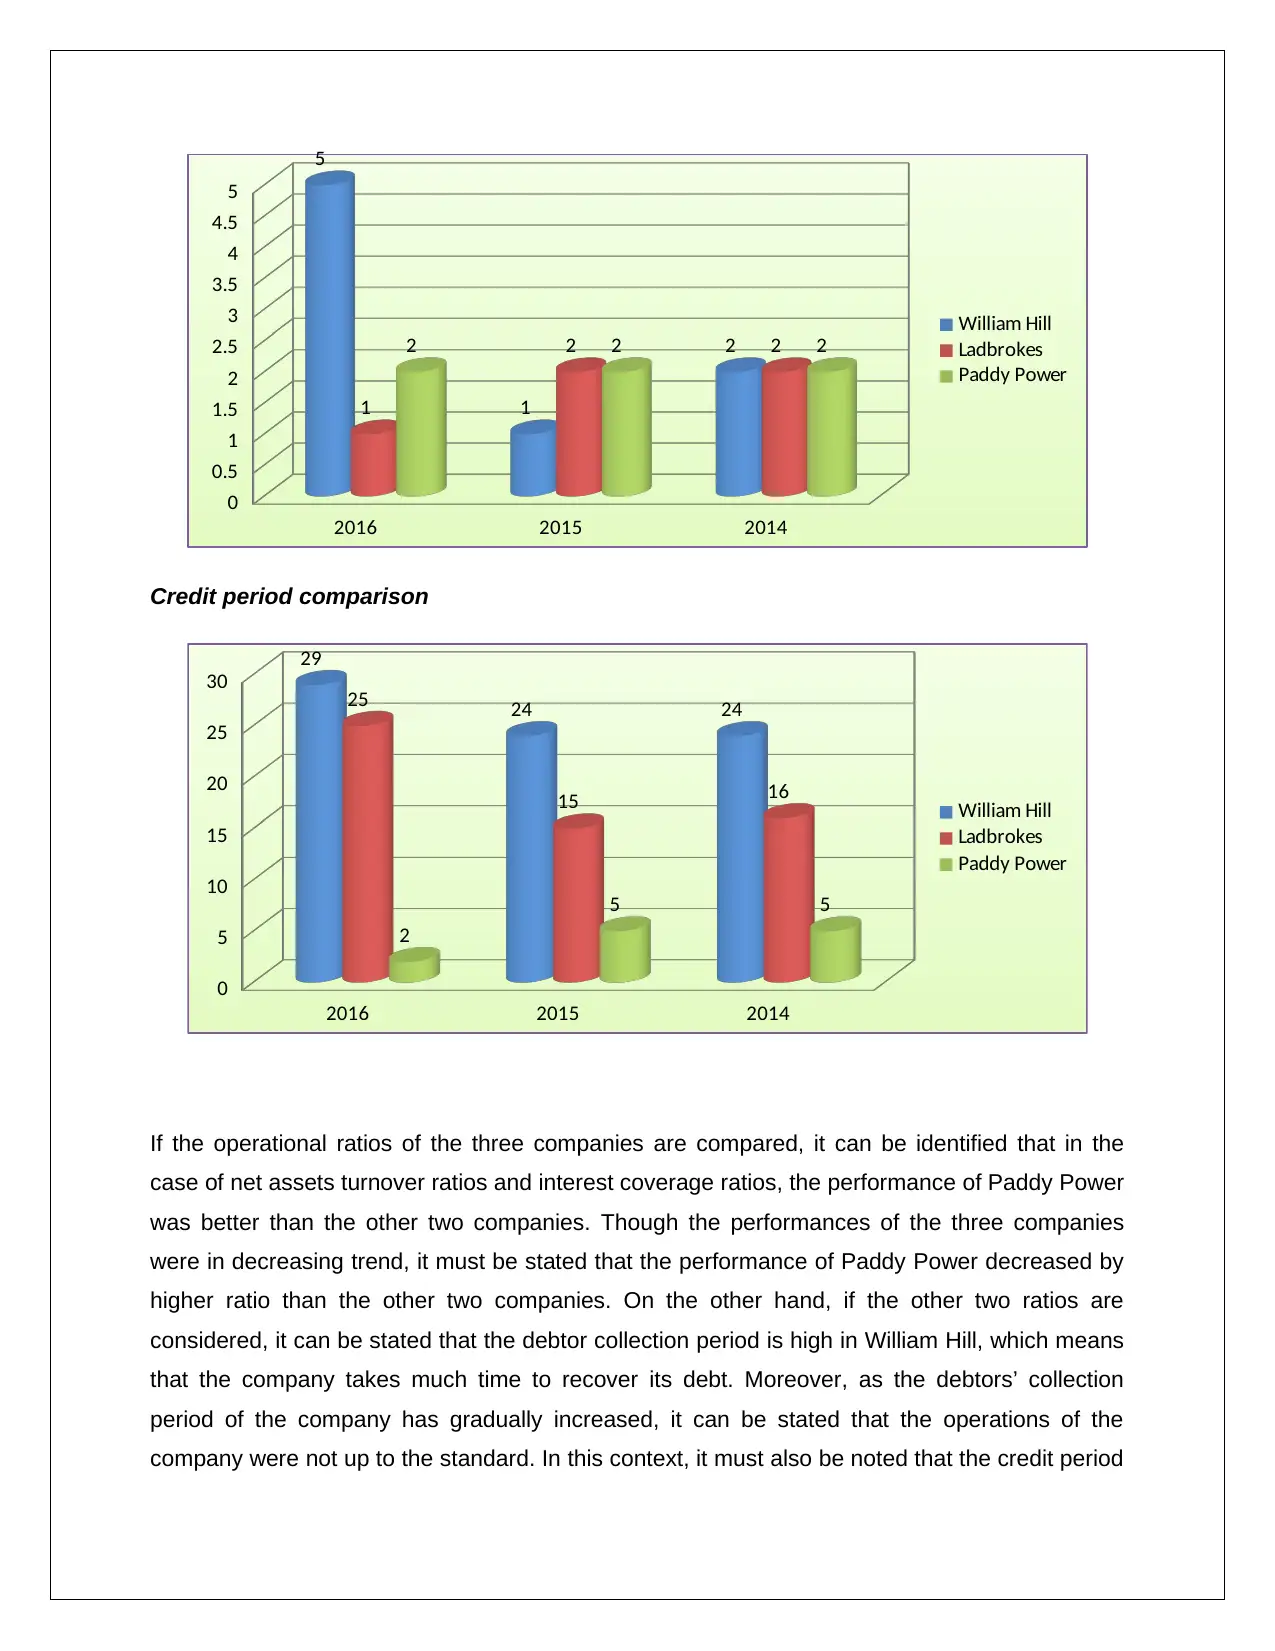
Collection period comparison:
their short term assets to improve the situation.
Comparing the operational ratios:
Net assets turnover comparison:
2016 2015 2014
0
0.5
1
1.5
2
2.5
3
3.5
4
0.8 0.95 0.81
0.62
1.36 1.25
0.33
3.94
2.22
William Hill
Ladbrokes
Paddy Power
Interest coverage comparison:
2016 2015 2014
-200
0
200
400
600
800
1000
4.51 5.47 5.76
-0.19 -0.08
2.762.64 61.7
978.34
William Hill
Ladbrokes
Paddy Power
Collection period comparison:
2016 2015 2014
0
0.5
1
1.5
2
2.5
3
3.5
4
4.5
5
5
1
2
1
2 22 2 2
William Hill
Ladbrokes
Paddy Power
Credit period comparison
2016 2015 2014
0
5
10
15
20
25
30
29
24 2425
15 16
2
5 5
William Hill
Ladbrokes
Paddy Power
If the operational ratios of the three companies are compared, it can be identified that in the
case of net assets turnover ratios and interest coverage ratios, the performance of Paddy Power
was better than the other two companies. Though the performances of the three companies
were in decreasing trend, it must be stated that the performance of Paddy Power decreased by
higher ratio than the other two companies. On the other hand, if the other two ratios are
considered, it can be stated that the debtor collection period is high in William Hill, which means
that the company takes much time to recover its debt. Moreover, as the debtors’ collection
period of the company has gradually increased, it can be stated that the operations of the
company were not up to the standard. In this context, it must also be noted that the credit period
0
0.5
1
1.5
2
2.5
3
3.5
4
4.5
5
5
1
2
1
2 22 2 2
William Hill
Ladbrokes
Paddy Power
Credit period comparison
2016 2015 2014
0
5
10
15
20
25
30
29
24 2425
15 16
2
5 5
William Hill
Ladbrokes
Paddy Power
If the operational ratios of the three companies are compared, it can be identified that in the
case of net assets turnover ratios and interest coverage ratios, the performance of Paddy Power
was better than the other two companies. Though the performances of the three companies
were in decreasing trend, it must be stated that the performance of Paddy Power decreased by
higher ratio than the other two companies. On the other hand, if the other two ratios are
considered, it can be stated that the debtor collection period is high in William Hill, which means
that the company takes much time to recover its debt. Moreover, as the debtors’ collection
period of the company has gradually increased, it can be stated that the operations of the
company were not up to the standard. In this context, it must also be noted that the credit period
⊘ This is a preview!⊘
Do you want full access?
Subscribe today to unlock all pages.
Trusted by 1+ million students worldwide
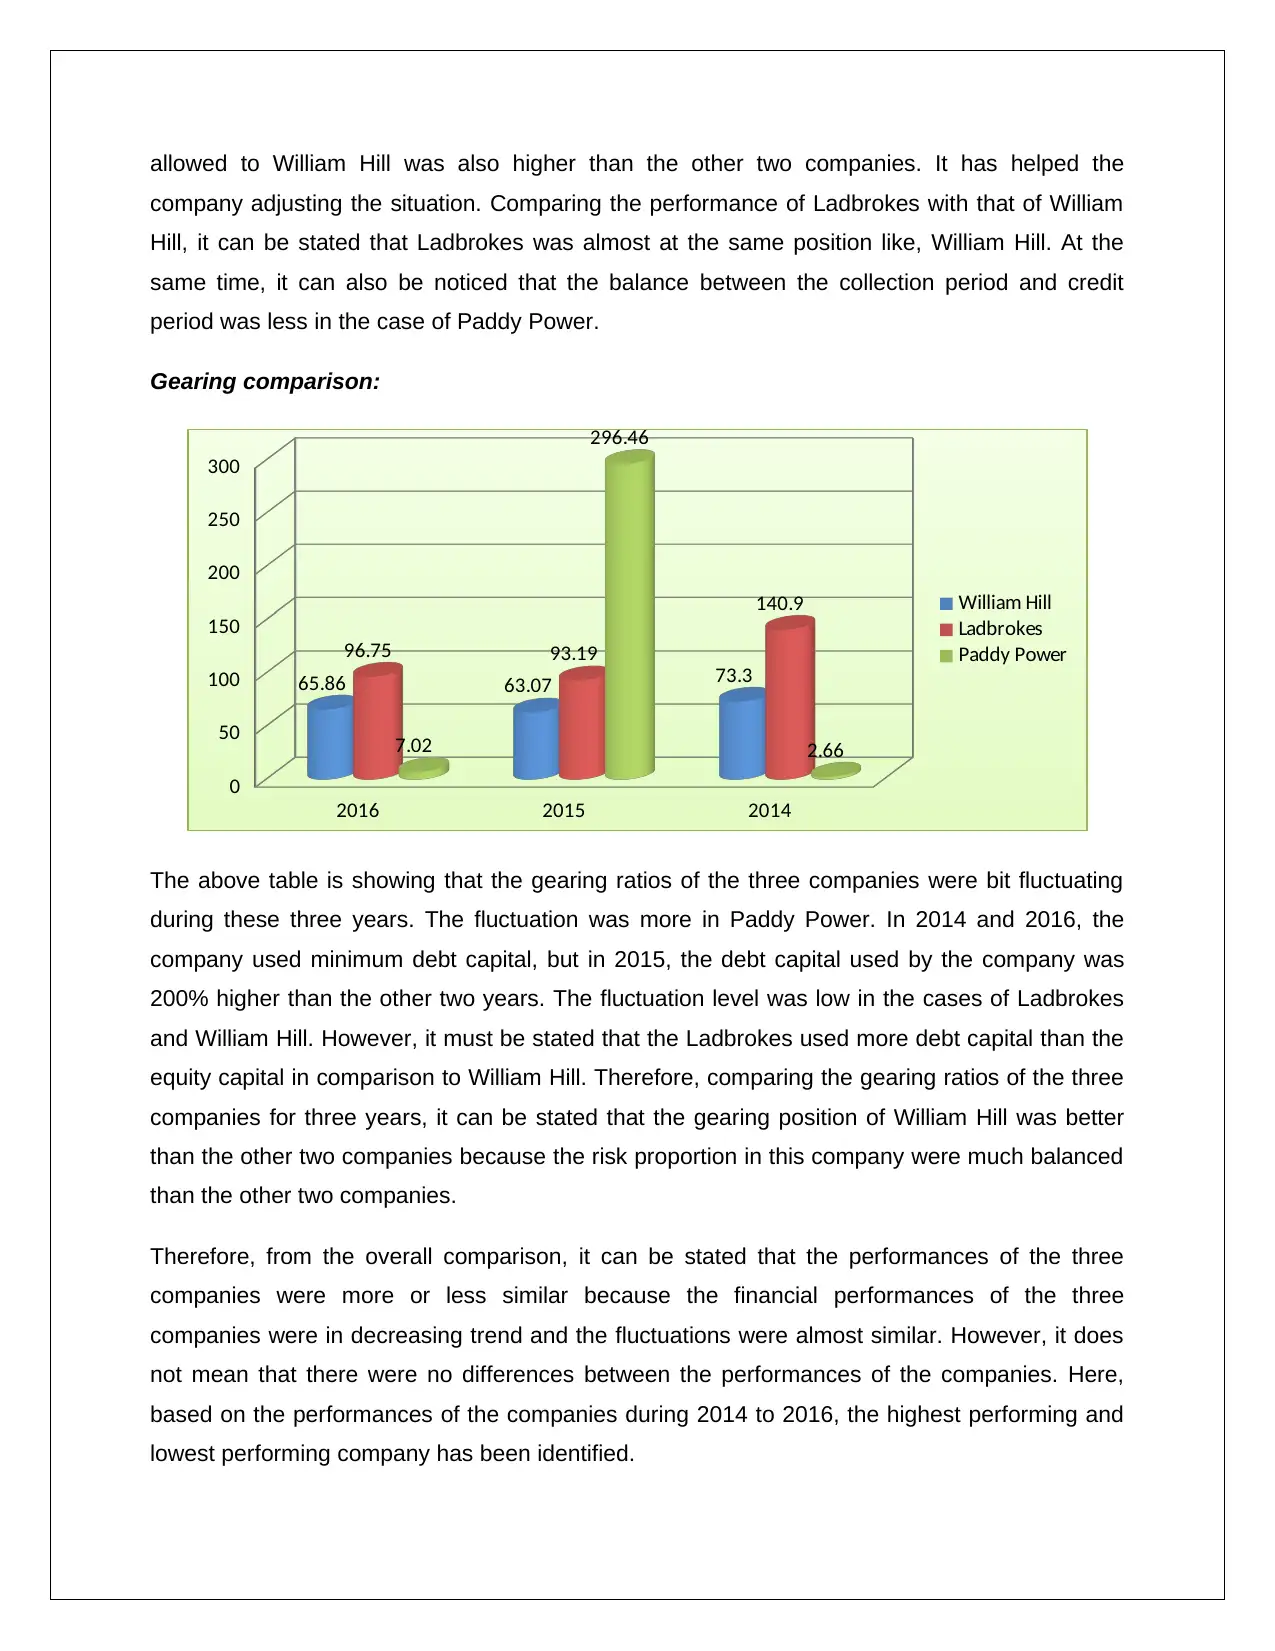
allowed to William Hill was also higher than the other two companies. It has helped the
company adjusting the situation. Comparing the performance of Ladbrokes with that of William
Hill, it can be stated that Ladbrokes was almost at the same position like, William Hill. At the
same time, it can also be noticed that the balance between the collection period and credit
period was less in the case of Paddy Power.
Gearing comparison:
2016 2015 2014
0
50
100
150
200
250
300
65.86 63.07 73.3
96.75 93.19
140.9
7.02
296.46
2.66
William Hill
Ladbrokes
Paddy Power
The above table is showing that the gearing ratios of the three companies were bit fluctuating
during these three years. The fluctuation was more in Paddy Power. In 2014 and 2016, the
company used minimum debt capital, but in 2015, the debt capital used by the company was
200% higher than the other two years. The fluctuation level was low in the cases of Ladbrokes
and William Hill. However, it must be stated that the Ladbrokes used more debt capital than the
equity capital in comparison to William Hill. Therefore, comparing the gearing ratios of the three
companies for three years, it can be stated that the gearing position of William Hill was better
than the other two companies because the risk proportion in this company were much balanced
than the other two companies.
Therefore, from the overall comparison, it can be stated that the performances of the three
companies were more or less similar because the financial performances of the three
companies were in decreasing trend and the fluctuations were almost similar. However, it does
not mean that there were no differences between the performances of the companies. Here,
based on the performances of the companies during 2014 to 2016, the highest performing and
lowest performing company has been identified.
Paraphrase This Document
Need a fresh take? Get an instant paraphrase of this document with our AI Paraphraser
1.b Identifying the best performing company
Considering the overall financial performances of the three companies, it can be stated that the
Paddy Power was the best performing or highest performing company among three. As this is
the best performing company, investment opportunities are high in this particular organization.
However, the reasons that made this company as the highest opportunities holder are stated
below:
The gross profit and other profitability ratios of this company were better in this
company. Though the ROE of the company has decreased in the financial year 2016,
the company has the capability of improving the scenario as the other profitability ratios
were at better position. As the profitability position of the company was better than the
other two companies, it can be expected that this company has better opportunity of
generating higher percentage of return in the near future (Talebnia and Aliari Erdi 2018).
Hence, it can be considered as a better investment option.
The liquidity position of the company was also better than the other two companies. The
strong liquidity position of the company has secured its future sustainability. If the future
of a company is secured, it can be expected that in future the company will be able to
maintain its performance standard and survive properly (Riyadi 2017).
The operational level of this company was also better than the other two companies. The
company was able to utilize its assets in a better way, which indicates that the efficiency
level of the company was better. As the efficiency level of the company was better, it can
be expected that in future the company will generate more revenue and return to the
investors (Trumpp and Guenther 2017).
1.c Identifying the poor performing company
In the above discussion, it has been identified that the Paddy power is the best performing
company among the three companies. In this context, it must be noted that Ladbrokes is the
lowest or poorest performing company among these three gambling companies in the United
Kingdom. The profitability position of the company was very poor during these years and at the
same time, the liquidity and efficiency levels of the business was also not satisfactory in
comparison to the other companies in the industry. However, the management of Ladbrokes
can improve the situation if they consider the following recommendations properly:
The management of the company needs to develop better strategies for improving the
profitability scenario by controlling the direct and indirect cost levels. The management
can change the costing method and implement more advanced costing system like,
activity based costing system (Riyadi 2017). This will help to reduce the cost level by
reducing the waste level of the business.
The management of Ladbrokes also needs to improve the efficiency level of the
managers as well as the other employees. This can be done in a better way if the
company introduces some training programs for the managers and the employees
(Talebnia and Aliari Erdi 2018).
The management also needs to improve the position of current assets of the business.
In order to improve the current ratio, the organization needs to enhance the cash inflow
of the business and the level of cash inflow can be enhanced by eliminating
unnecessary cash outflow from the business.
Section B
2.a Identifying and explaining the key stages in the capital investment decision making
process
Capital investment decision-making is a very critical and time consuming process. This
particular process involves some stages, which are as follows:
Stage 1: The first stage in the capital investment decision-making is the identification of
the investment opportunities. In this stage, the managements of the companies need to
explore the new opportunities. For any particular capital investment decision, there might
be more than two opportunities (Li and Trutnevyte 2017). Therefore, the management
needs to identify the better opportunities for the company.
Stage 2: After exploring the new capital investment opportunities, the management
needs to verify or compute the cost of each investment opportunity separately. This is
one of the most important stages in the whole capital investment decision making
process. The company needs to analyze the costs of each opportunity critically
considering the cost of implementation as well as the cost of maintenance (Hicks 2017).
Stage 3: The third stage in the capital investment decision making process is
determining the future cash inflows from each investment opportunity. This is also needs
to be done for each investment opportunity separately. This is a very critical stage in the
capital investment decision making process. In order to identify the future cash flow from
⊘ This is a preview!⊘
Do you want full access?
Subscribe today to unlock all pages.
Trusted by 1+ million students worldwide
1 out of 17
Related Documents


Your All-in-One AI-Powered Toolkit for Academic Success.
+13062052269
info@desklib.com
Available 24*7 on WhatsApp / Email
![[object Object]](/_next/static/media/star-bottom.7253800d.svg)
Unlock your academic potential
Copyright © 2020–2026 A2Z Services. All Rights Reserved. Developed and managed by ZUCOL.