Under Armour Financial Performance Analysis: 2011-2015 Review

Verified

Added on  2022/09/18

|2
|272
|117
Report
AI Summary
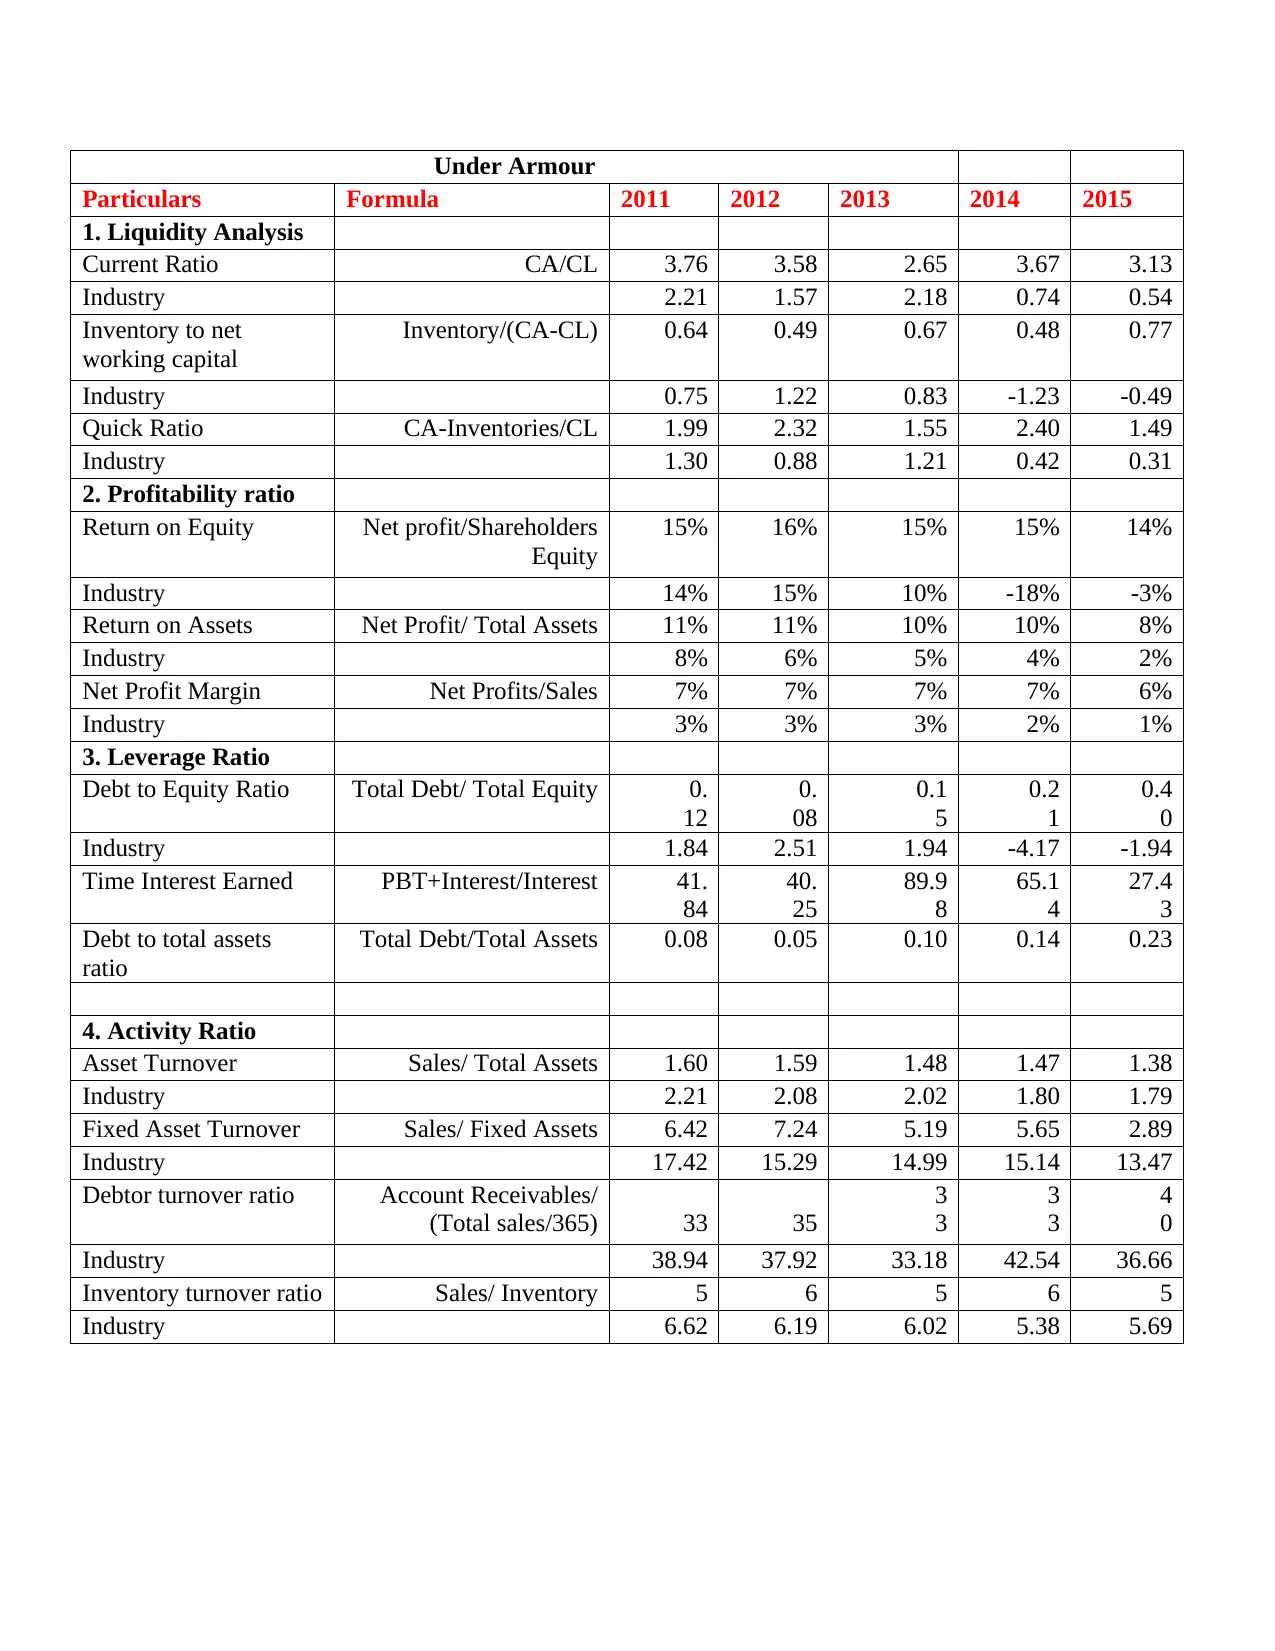
This report presents a financial analysis of Under Armour's performance from 2011 to 2015. It examines key financial ratios, including liquidity ratios (current ratio, quick ratio), profitability ratios (return on equity, return on assets, net profit margin), leverage ratios (debt to equity, debt to total assets, times interest earned), and activity ratios (asset turnover, fixed asset turnover, debtor turnover, inventory turnover). The analysis compares Under Armour's performance to industry averages, highlighting trends and providing insights into the company's financial health and operational efficiency over the specified period. The report offers a comprehensive overview of Under Armour's financial standing, enabling a better understanding of its financial strategies and overall business performance.
Document Page
RUNNING HEAD: BUSINESS POLICY
0
Business Policy
tabler-icon-diamond-filled.svg

Paraphrase This Document

Need a fresh take? Get an instant paraphrase of this document with our AI Paraphraser
Document Page
Under Armour
Particulars Formula 2011 2012 2013 2014 2015
1. Liquidity Analysis
Current Ratio CA/CL 3.76 3.58 2.65 3.67 3.13
Industry 2.21 1.57 2.18 0.74 0.54
Inventory to net
working capital
Inventory/(CA-CL) 0.64 0.49 0.67 0.48 0.77
Industry 0.75 1.22 0.83 -1.23 -0.49
Quick Ratio CA-Inventories/CL 1.99 2.32 1.55 2.40 1.49
Industry 1.30 0.88 1.21 0.42 0.31
2. Profitability ratio
Return on Equity Net profit/Shareholders
Equity
15% 16% 15% 15% 14%
Industry 14% 15% 10% -18% -3%
Return on Assets Net Profit/ Total Assets 11% 11% 10% 10% 8%
Industry 8% 6% 5% 4% 2%
Net Profit Margin Net Profits/Sales 7% 7% 7% 7% 6%
Industry 3% 3% 3% 2% 1%
3. Leverage Ratio
Debt to Equity Ratio Total Debt/ Total Equity 0.
12
0.
08
0.1
5
0.2
1
0.4
0
Industry 1.84 2.51 1.94 -4.17 -1.94
Time Interest Earned PBT+Interest/Interest 41.
84
40.
25
89.9
8
65.1
4
27.4
3
Debt to total assets
ratio
Total Debt/Total Assets 0.08 0.05 0.10 0.14 0.23
4. Activity Ratio
Asset Turnover Sales/ Total Assets 1.60 1.59 1.48 1.47 1.38
Industry 2.21 2.08 2.02 1.80 1.79
Fixed Asset Turnover Sales/ Fixed Assets 6.42 7.24 5.19 5.65 2.89
Industry 17.42 15.29 14.99 15.14 13.47
Debtor turnover ratio Account Receivables/
(Total sales/365) 33 35
3
3
3
3
4
0
Industry 38.94 37.92 33.18 42.54 36.66
Inventory turnover ratio Sales/ Inventory 5 6 5 6 5
Industry 6.62 6.19 6.02 5.38 5.69
chevron_up_icon
1 out of 2
circle_padding
hide_on_mobile
zoom_out_icon
[object Object]