Unilever Plc Financial Report: A Shareholder's Investment Analysis
VerifiedAdded on 2022/08/14
|21
|4954
|17
Report
AI Summary
This report provides a comprehensive financial analysis of Unilever Plc from a shareholder's perspective, evaluating the company's strengths, weaknesses, and opportunities for growth. It assesses the share price behavior by calculating returns, standard deviation, and correlation with the FTSE-100 index, further constructing portfolios to identify efficient investment strategies. The report investigates Unilever's capital structure, estimates systematic risk using beta coefficients, and determines the cost of equity through the Capital Asset Pricing Model (CAPM). Additionally, it examines the Price-Earnings (P/E) ratio and analyzes the company's financial statements to offer insights into its financial health and investment potential. The analysis aims to assist shareholders in making informed decisions regarding buying or selling shares, based on the company's financial performance and market position.
Running head: FINANCIAL MANAGEMENT
Financial Management
Name of the Student
Name of theUniversity
Author note
Financial Management
Name of the Student
Name of theUniversity
Author note
Paraphrase This Document
Need a fresh take? Get an instant paraphrase of this document with our AI Paraphraser
1
FINANCIAL MANAGEMENT
Executive Summary
The aim of this report is to perform a financial analysis of Unilever Plc for the company's
shareholders. The financial analysis will help shareholders in deciding whether to buy or to sell
the shares of the company. The financial analysis will be performed by evaluating its return and
by comparing it with the market return, by evaluating its capital structure and studying the
financial statements. It helps in assessing the financial growth and performance of the company.
The report discusses the strength, weaknesses, and opportunities of the company through various
analyses.
2
FINANCIAL MANAGEMENT
Table of Contents
Introduction:....................................................................................................................................3
Discussion:.......................................................................................................................................3
Part A: Analysis of Share price behaviour of Unilever...............................................................3
Part B: Investigation of Capital structure and Cost of Capital....................................................5
Part C: Concluding Remark.......................................................................................................11
Appendix:..................................................................................................................................13
⊘ This is a preview!⊘
Do you want full access?
Subscribe today to unlock all pages.
Trusted by 1+ million students worldwide
3
FINANCIAL MANAGEMENT
Introduction:
Unilever Plc is a multinational dual-listed company with its headquarters being situated
in Rotterdam and London. It operates as a single business unit with four main divisions- foods,
beauty and personal care, refreshments, and home care. Unilever Plcis listed on the London
Stock Exchange and is a constituent of the FTSE 100 Index(Unilever.com, 2020). The financial
management of the company is necessary for the performance of the company and to perform
proper management and utilization of resources and funds(Londonstockexchange.com, 2020). It
helps in performing portfolio management, capital management, ratio analysis, distribution of
dividends, and security analysis. The discussion is in three parts to conduct a full performance
analysis of the company. The report aims to analyse the company’s growth over the short term
and long term period.
Discussion:
Part A: Analysis of Share pricebehaviour of Unilever
This part consists of analyzing the price behavior of the company by computing its
return, standard deviation, and variance. For evaluating its current situation, the comparison is
being conducted with the market return for the last five years.
(i) Expected monthly returns: The monthly return of the company is calculated by
computing the difference between the opening price and closing price of the shares(Lee
& So, 2017). The expected monthly returns of an investment is the probability
distribution of the possible returns that is been provided to the investors(Bali & Zhou,
2016). The expected return of Unilever Plc based on five-year data (sixty-one months) is
Paraphrase This Document
Need a fresh take? Get an instant paraphrase of this document with our AI Paraphraser
4
FINANCIAL MANAGEMENT
0.83%. The monthly return for the period 2014-2018 is shown in table 1 (Appendix 1),
along with the company’s monthly share prices.
(ii) Standard Deviation on monthly returns: The standard deviationis often used to measure
the risk of the stock or portfolio(Ball et al., 2020). The more the stock return varies from
the average return of the stock, the higher the volatility.The annualized monthly standard
deviation will help in the approximation of the standard deviation annually(Hamid &
Habib, 2017). The standard deviation of monthly returns of Unilever is 4.86%, and
shown in table 1 in Appendix 1.
(iii) Correlation of monthly returns: The average market return is 0.02%, and the monthly
return is calculated based on the difference between monthly prices (Carroll et al., 2017).
The correlation refers to the strength of the linear relationship between the two variables,
and it comes to 0.484 between the company’s return and FTSE-100 index returns (Hamid
& Habib, 2017). The relation can be a perfectly positive correlation, moderate positive
correlation, and perfect negative correlation. The stock with the lowest correlation will
result in the maximum benefit of diversification in the form of risk reduction (Dimic et
al., 2016). The monthly return computation is shown in Table 2 (Appendix 1)
(iv) Portfolio: A portfolio is constructed with the company’s shares and FTSE-100 index in
different propositions.
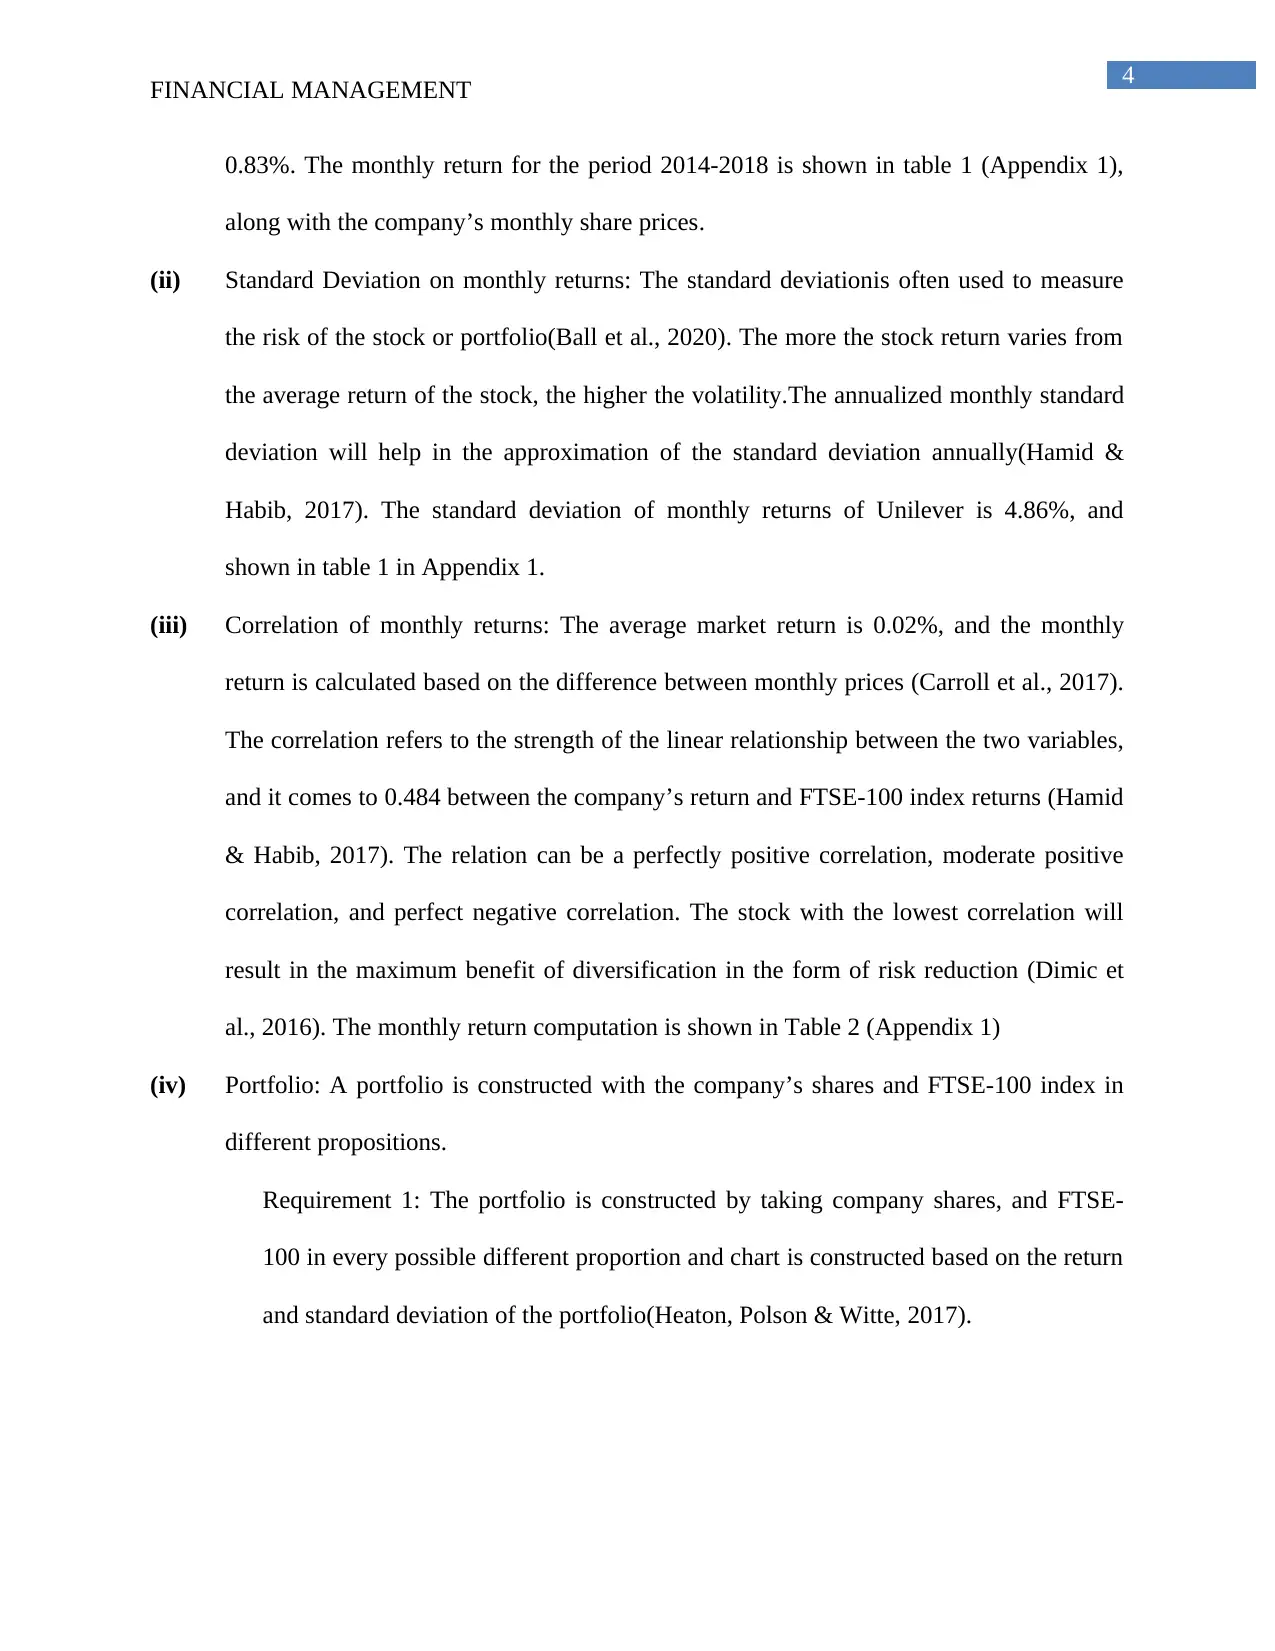
Requirement 1: The portfolio is constructed by taking company shares, and FTSE-
100 in every possible different proportion and chart is constructed based on the return
and standard deviation of the portfolio(Heaton, Polson & Witte, 2017).
FINANCIAL MANAGEMENT
0.83%. The monthly return for the period 2014-2018 is shown in table 1 (Appendix 1),
along with the company’s monthly share prices.
(ii) Standard Deviation on monthly returns: The standard deviationis often used to measure
the risk of the stock or portfolio(Ball et al., 2020). The more the stock return varies from
the average return of the stock, the higher the volatility.The annualized monthly standard
deviation will help in the approximation of the standard deviation annually(Hamid &
Habib, 2017). The standard deviation of monthly returns of Unilever is 4.86%, and
shown in table 1 in Appendix 1.
(iii) Correlation of monthly returns: The average market return is 0.02%, and the monthly
return is calculated based on the difference between monthly prices (Carroll et al., 2017).
The correlation refers to the strength of the linear relationship between the two variables,
and it comes to 0.484 between the company’s return and FTSE-100 index returns (Hamid
& Habib, 2017). The relation can be a perfectly positive correlation, moderate positive
correlation, and perfect negative correlation. The stock with the lowest correlation will
result in the maximum benefit of diversification in the form of risk reduction (Dimic et
al., 2016). The monthly return computation is shown in Table 2 (Appendix 1)
(iv) Portfolio: A portfolio is constructed with the company’s shares and FTSE-100 index in
different propositions.
Requirement 1: The portfolio is constructed by taking company shares, and FTSE-
100 in every possible different proportion and chart is constructed based on the return
and standard deviation of the portfolio(Heaton, Polson & Witte, 2017).
5
FINANCIAL MANAGEMENT
Requirement 2: The efficient portfolio is the portfolio which provides a higher return at
lower risk compared to the other inefficient portfolio(Drake, Kleindorfer & Van 2016). In the
portfolio sets made above, the efficient portfolio will start from the set of 45% of company stock
and 55% of FTSE-100, where the return is .38%, and the standard deviation is 2.85% till the set
of 99% company stock and 1% FTSE-100 stock (Wadhwa, Phelps & Kotha, 2016). The
inefficient portfolios are those which consists of entirely market stock since it provides the
highest risk and those which entirely of company stocks since they provide the lowest return at
considerable risk. The portfolio is provided in table 3 (Appendix 2)
Part B: Investigation of Capital structure and Cost of Capital
(i) Estimation of Systematic risk: Systematic risk is the type of business risk thatis caused by
external factors and cannot be diversified away by holding several securities, and thus it
cannot be avoided entirely. The external factors are such as social, political, and
economic factors, and it can be measured through computing sensitivity of company
return and market return(Pham, 2020). The systematic risk does include the market risk,
purchasing power risk, interest rate risk and exchange rate risk. The systematic risk is
⊘ This is a preview!⊘
Do you want full access?
Subscribe today to unlock all pages.
Trusted by 1+ million students worldwide
6
FINANCIAL MANAGEMENT
considered as the part of the total risk which is being caused by different factors which is
out there to control of the specific organization. it does help in capturing the sensevity of
the security’s return which is in respect of the market return(Osadchiy, Gaur & Seshadri,
2016). The beta of the stock helps in the votality of instrument which has been related to
the market volality. This is been used as an proxy which is for the systematic risk fo the
stock and it is been used on measuring the risk if the stock is relative to the market risk.
Thus, this sensivity of the security’s return is in the respect to the market
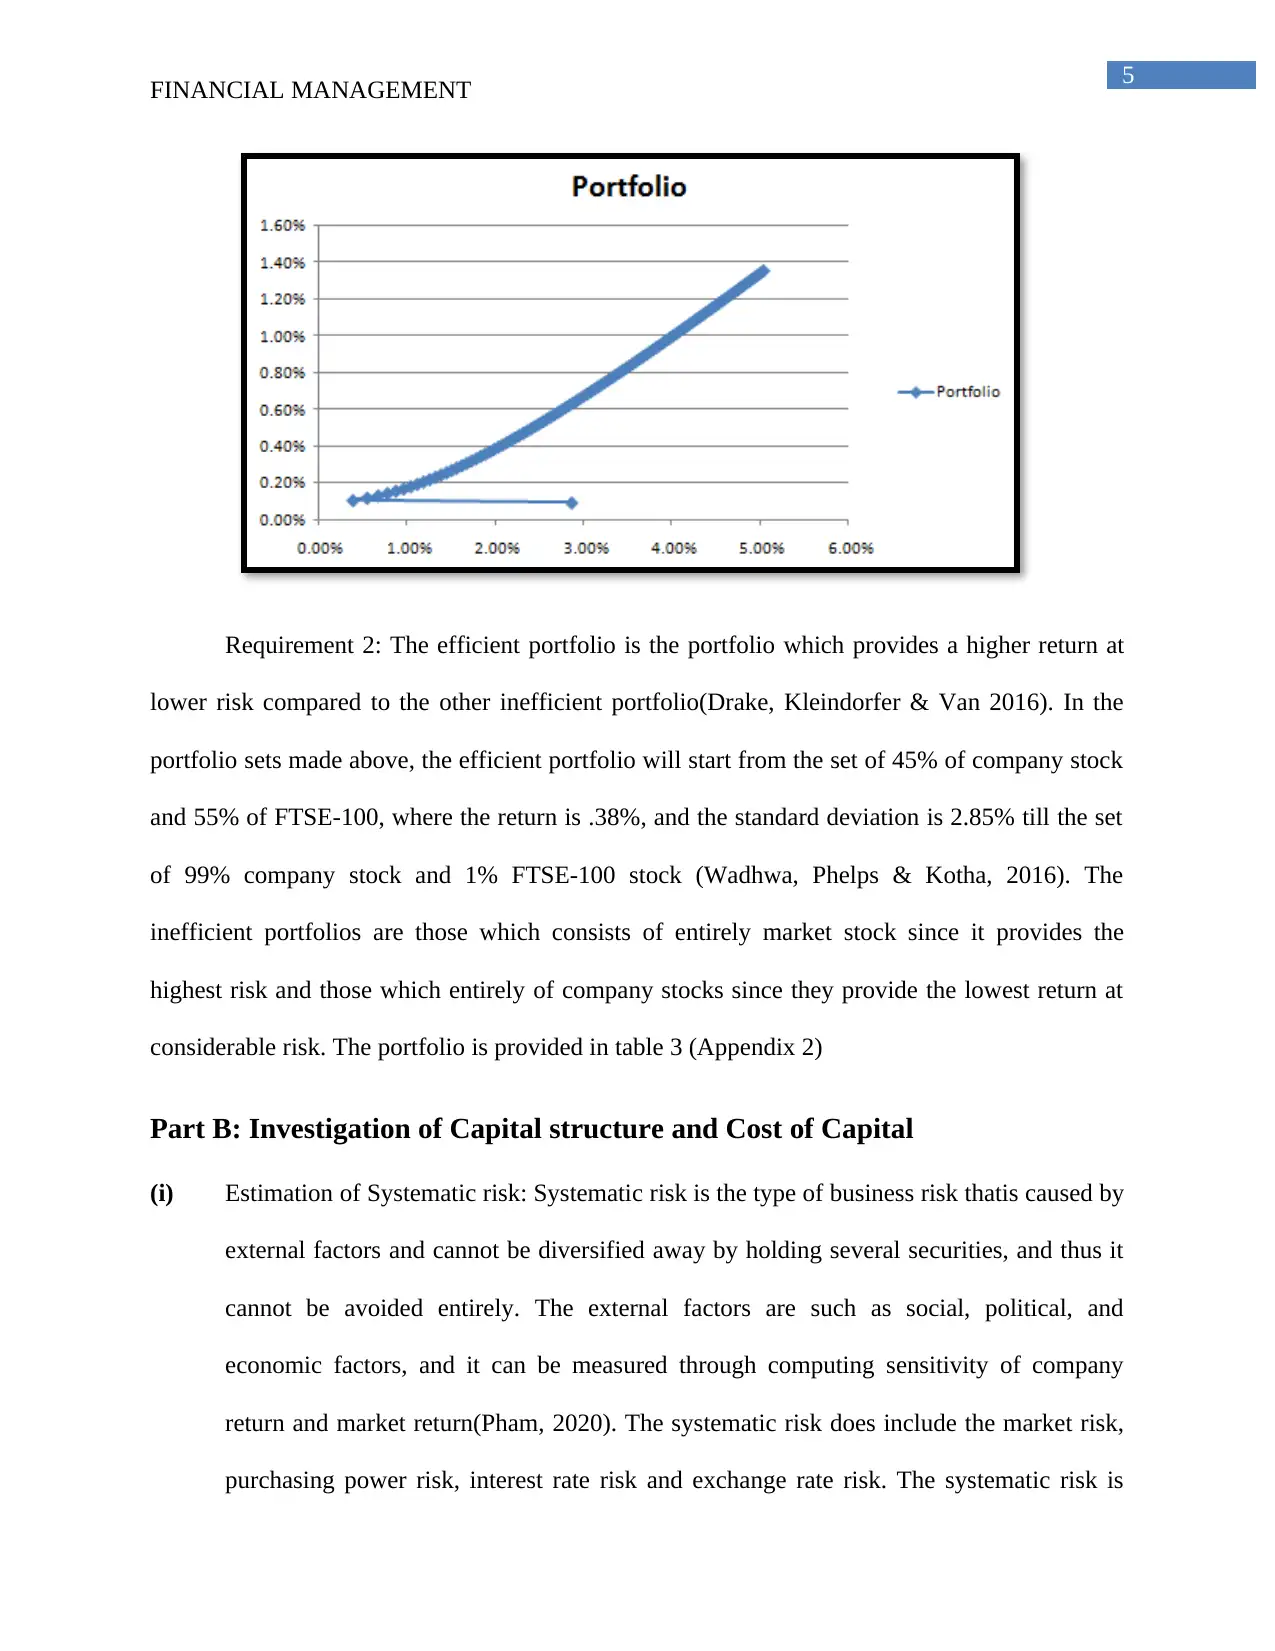
return(Puspitaningtyas, 2017). The beta coefficient represents the sensitivity, and it is
calculated with the help of covariance between market and company return and variance
of the market return. For Unilever the beta is as follows:
The variance of the market is calculated by taking the market’s monthly return, and
covariance is computed by taking company stock and market return. Beta represents the slope of
the best fit line through the market and individual stock (Xing & Yan, 2019). The beta
coefficient below 1 shows that stock has a systematic risk lower than the market and means that
it is less volatile than the overall index. When the beta coefficient is higher than one, it shows
that stock has an above-average return and risk and is more volatile than the market index(Jafari
et al., 2018). Unilever’s security beta coefficient is .8056, which is below 1, and this shows that
security is less risky, but it will also provide less return. The security with a beta higher than 1 is
riskier but will give higher returns. The Unilever shares are less risky and hence suitable for risk-
averse shareholders but not ideal for shareholders who are risk-takers and want higher returns.
FINANCIAL MANAGEMENT
considered as the part of the total risk which is being caused by different factors which is
out there to control of the specific organization. it does help in capturing the sensevity of
the security’s return which is in respect of the market return(Osadchiy, Gaur & Seshadri,
2016). The beta of the stock helps in the votality of instrument which has been related to
the market volality. This is been used as an proxy which is for the systematic risk fo the
stock and it is been used on measuring the risk if the stock is relative to the market risk.
Thus, this sensivity of the security’s return is in the respect to the market
return(Puspitaningtyas, 2017). The beta coefficient represents the sensitivity, and it is
calculated with the help of covariance between market and company return and variance
of the market return. For Unilever the beta is as follows:
The variance of the market is calculated by taking the market’s monthly return, and
covariance is computed by taking company stock and market return. Beta represents the slope of
the best fit line through the market and individual stock (Xing & Yan, 2019). The beta
coefficient below 1 shows that stock has a systematic risk lower than the market and means that
it is less volatile than the overall index. When the beta coefficient is higher than one, it shows
that stock has an above-average return and risk and is more volatile than the market index(Jafari
et al., 2018). Unilever’s security beta coefficient is .8056, which is below 1, and this shows that
security is less risky, but it will also provide less return. The security with a beta higher than 1 is
riskier but will give higher returns. The Unilever shares are less risky and hence suitable for risk-
averse shareholders but not ideal for shareholders who are risk-takers and want higher returns.
Paraphrase This Document
Need a fresh take? Get an instant paraphrase of this document with our AI Paraphraser
7
FINANCIAL MANAGEMENT
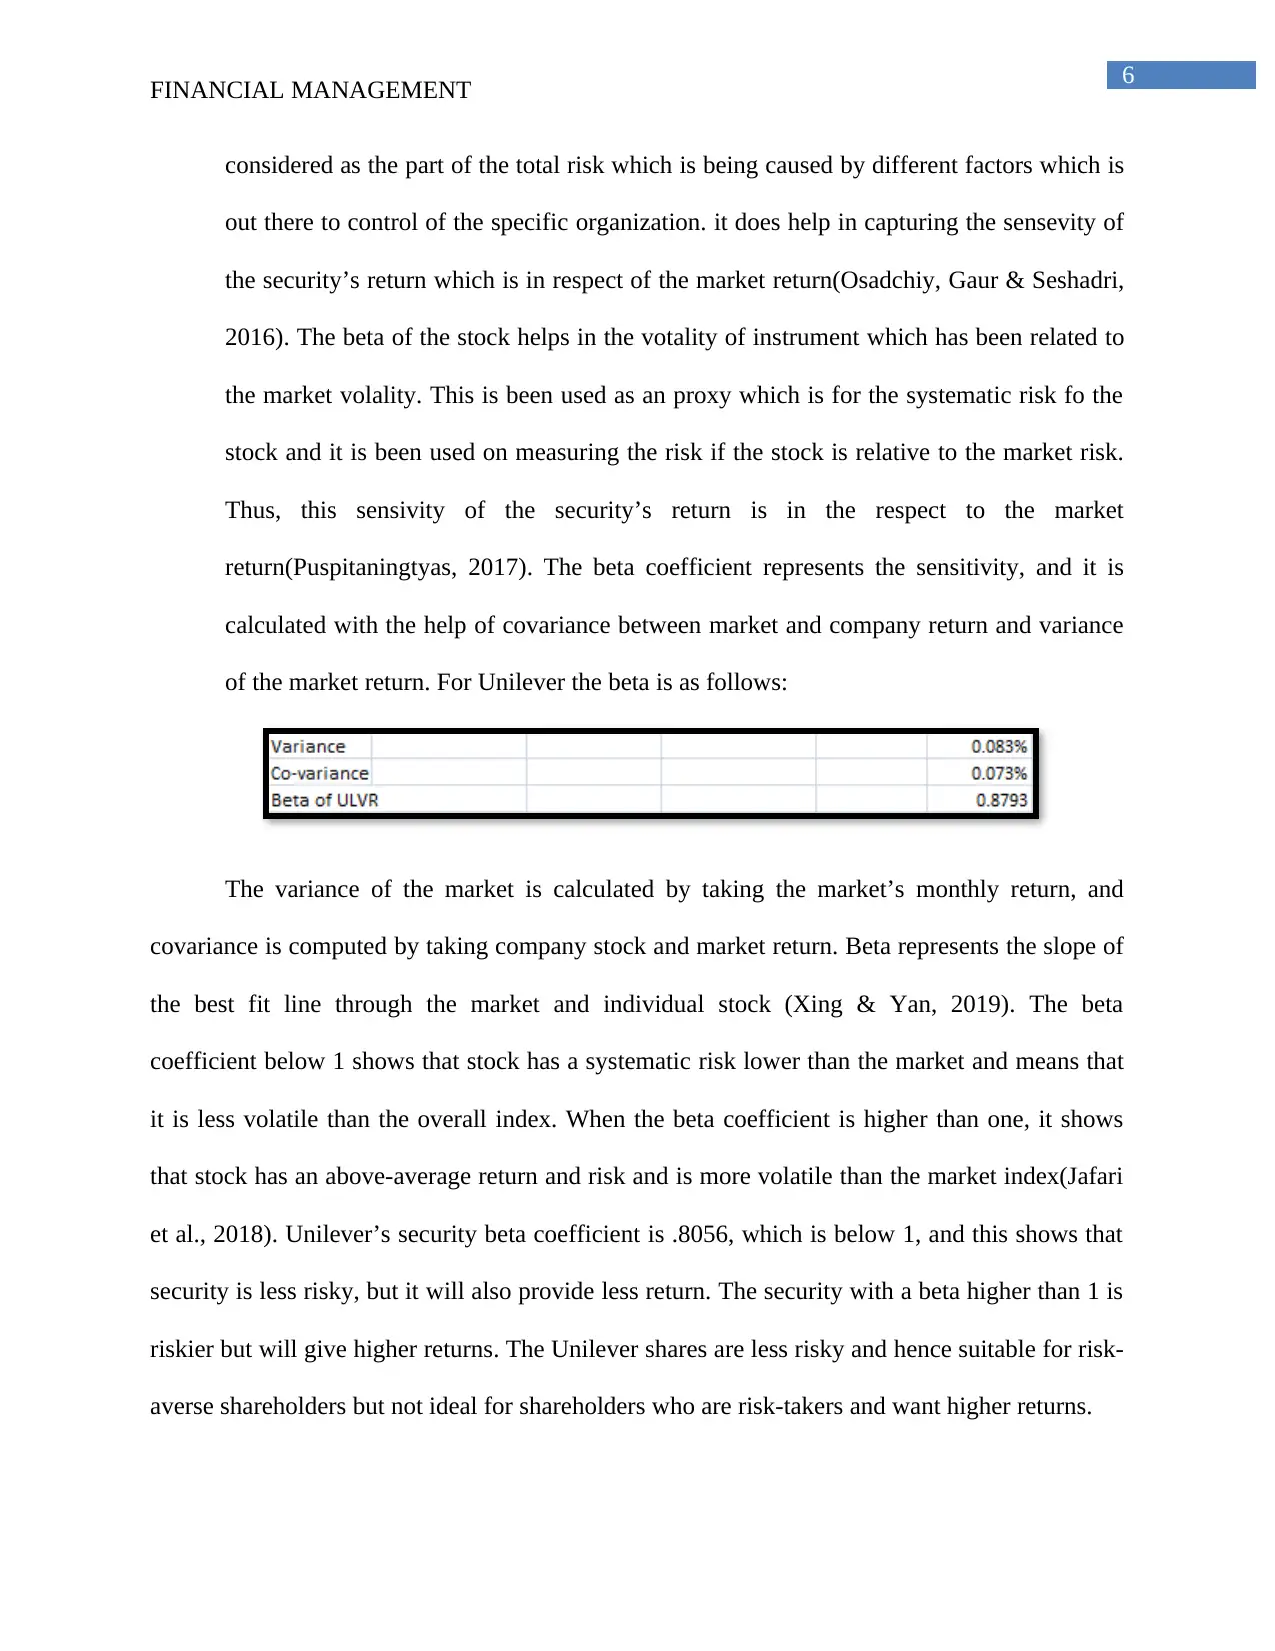
(ii) The cost of equity is the required rate of return by shareholders for investing capital into
the business. The rate of return is based upon the level of risk attached to the investment,
and it is measured as the historical volatility of returns(Dhaliwal et al., 2016). The cost of
equity is computed using the Capital Asset Pricing Model (CAPM), which shows that the
return of share is equal to the risk-free return plus the market risk premium based on the
beta of the security(Berger, Chen & Li, 2018). The cost of equity capital of Unilever
comes to .184%, and the calculation is here as below:
This return is the required rate of return by the investors, and this is the minimum cost
required to retain its investors(El et al., 2016). The cost of equity is calculated using CAPM, so
the return depends on the beta of the security, and if security has higher beta, investors will
require a higher rate of return. Since the company’s security beta is lower, the average return
required by investors will be comparatively lower to the higher beta security.
(iii) The price-earnings ratio is the ratio that helps in the stock valuation of the company by
assessing the current share price to earnings per share of the company. The higher P/E
ratio indicates that the investors are willing to pay a high price due to the higher future
expectations(Sha, 2017). The low P/E possible demonstrates that the current price is low
relative to the earnings. The P/E ratio helps in analyzing the stock price and also future
growth.
FINANCIAL MANAGEMENT
(ii) The cost of equity is the required rate of return by shareholders for investing capital into
the business. The rate of return is based upon the level of risk attached to the investment,
and it is measured as the historical volatility of returns(Dhaliwal et al., 2016). The cost of
equity is computed using the Capital Asset Pricing Model (CAPM), which shows that the
return of share is equal to the risk-free return plus the market risk premium based on the
beta of the security(Berger, Chen & Li, 2018). The cost of equity capital of Unilever
comes to .184%, and the calculation is here as below:
This return is the required rate of return by the investors, and this is the minimum cost
required to retain its investors(El et al., 2016). The cost of equity is calculated using CAPM, so
the return depends on the beta of the security, and if security has higher beta, investors will
require a higher rate of return. Since the company’s security beta is lower, the average return
required by investors will be comparatively lower to the higher beta security.
(iii) The price-earnings ratio is the ratio that helps in the stock valuation of the company by
assessing the current share price to earnings per share of the company. The higher P/E
ratio indicates that the investors are willing to pay a high price due to the higher future
expectations(Sha, 2017). The low P/E possible demonstrates that the current price is low
relative to the earnings. The P/E ratio helps in analyzing the stock price and also future
growth.
8
FINANCIAL MANAGEMENT
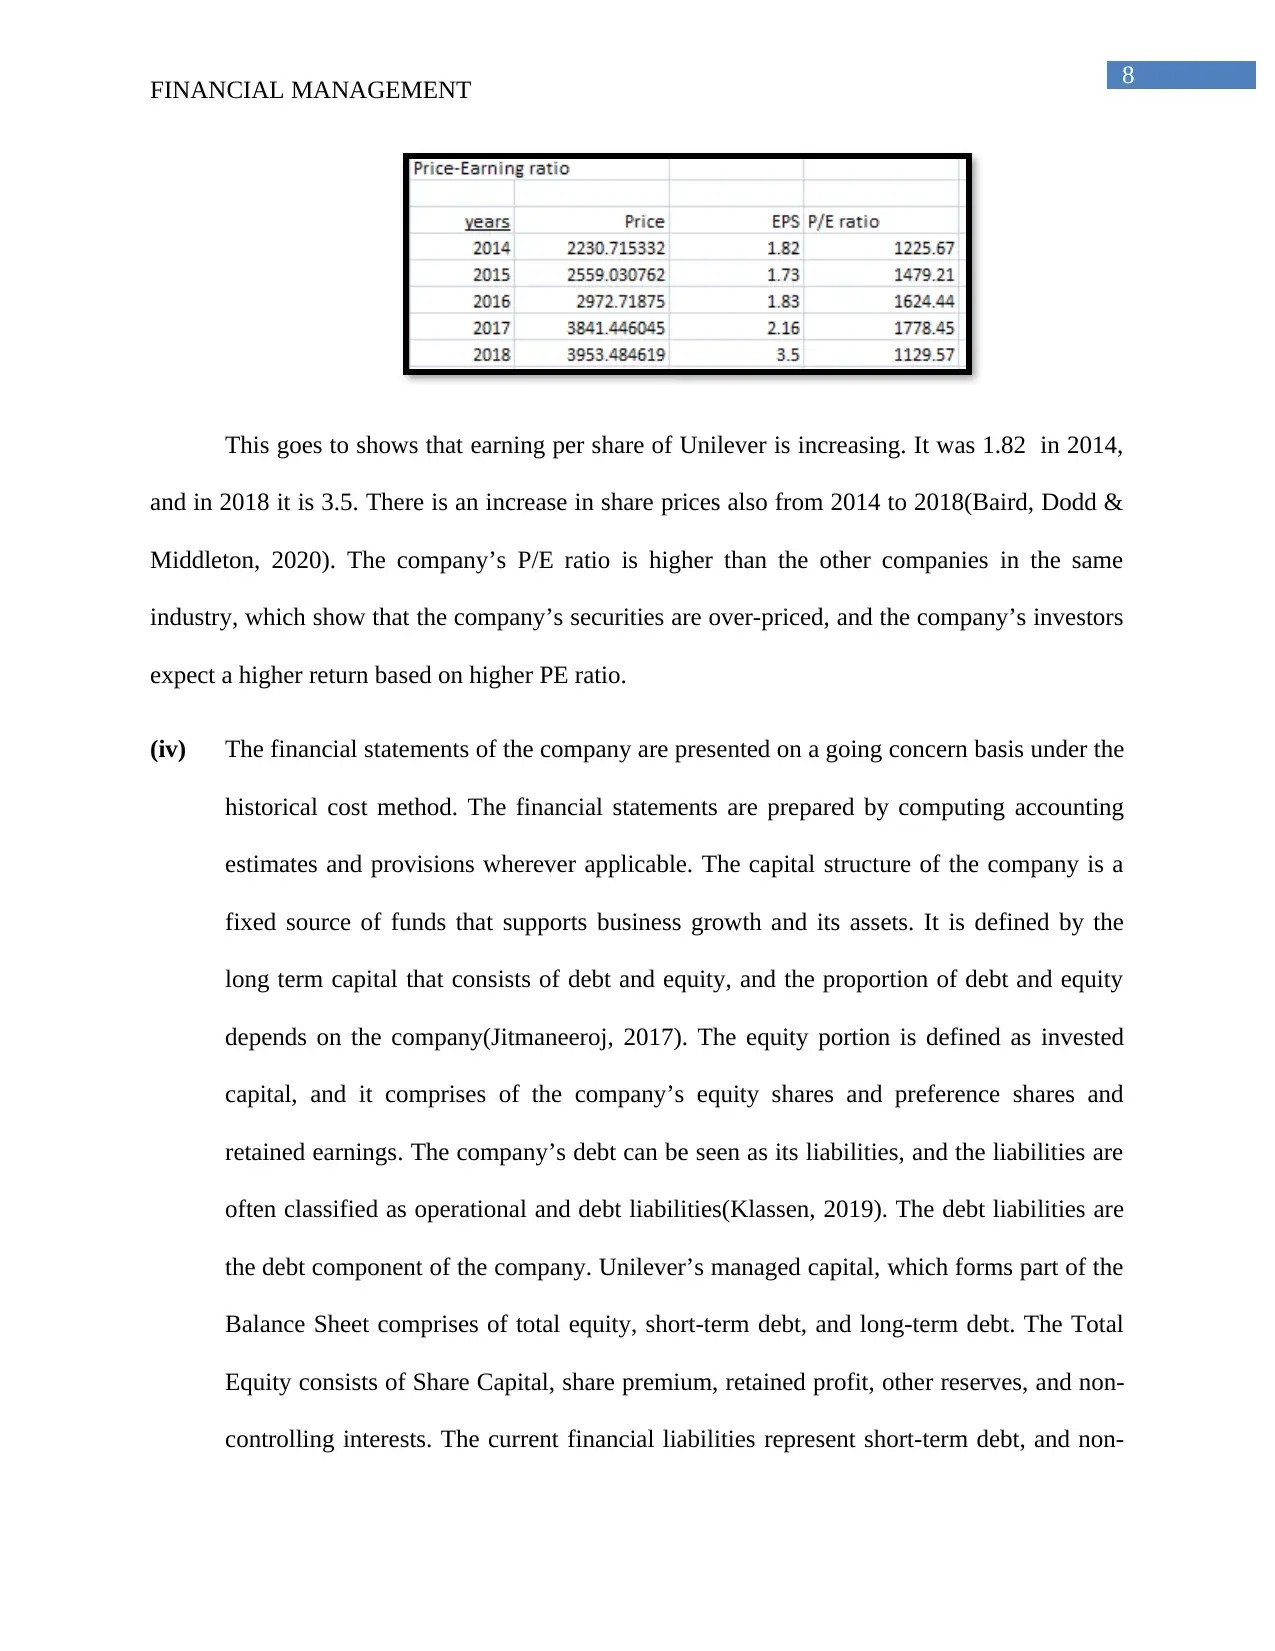
This goes to shows that earning per share of Unilever is increasing. It was 1.82 in 2014,
and in 2018 it is 3.5. There is an increase in share prices also from 2014 to 2018(Baird, Dodd &
Middleton, 2020). The company’s P/E ratio is higher than the other companies in the same
industry, which show that the company’s securities are over-priced, and the company’s investors
expect a higher return based on higher PE ratio.
(iv) The financial statements of the company are presented on a going concern basis under the
historical cost method. The financial statements are prepared by computing accounting
estimates and provisions wherever applicable. The capital structure of the company is a
fixed source of funds that supports business growth and its assets. It is defined by the
long term capital that consists of debt and equity, and the proportion of debt and equity
depends on the company(Jitmaneeroj, 2017). The equity portion is defined as invested
capital, and it comprises of the company’s equity shares and preference shares and
retained earnings. The company’s debt can be seen as its liabilities, and the liabilities are
often classified as operational and debt liabilities(Klassen, 2019). The debt liabilities are
the debt component of the company. Unilever’s managed capital, which forms part of the
Balance Sheet comprises of total equity, short-term debt, and long-term debt. The Total
Equity consists of Share Capital, share premium, retained profit, other reserves, and non-
controlling interests. The current financial liabilities represent short-term debt, and non-
FINANCIAL MANAGEMENT
This goes to shows that earning per share of Unilever is increasing. It was 1.82 in 2014,
and in 2018 it is 3.5. There is an increase in share prices also from 2014 to 2018(Baird, Dodd &
Middleton, 2020). The company’s P/E ratio is higher than the other companies in the same
industry, which show that the company’s securities are over-priced, and the company’s investors
expect a higher return based on higher PE ratio.
(iv) The financial statements of the company are presented on a going concern basis under the
historical cost method. The financial statements are prepared by computing accounting
estimates and provisions wherever applicable. The capital structure of the company is a
fixed source of funds that supports business growth and its assets. It is defined by the
long term capital that consists of debt and equity, and the proportion of debt and equity
depends on the company(Jitmaneeroj, 2017). The equity portion is defined as invested
capital, and it comprises of the company’s equity shares and preference shares and
retained earnings. The company’s debt can be seen as its liabilities, and the liabilities are
often classified as operational and debt liabilities(Klassen, 2019). The debt liabilities are
the debt component of the company. Unilever’s managed capital, which forms part of the
Balance Sheet comprises of total equity, short-term debt, and long-term debt. The Total
Equity consists of Share Capital, share premium, retained profit, other reserves, and non-
controlling interests. The current financial liabilities represent short-term debt, and non-
⊘ This is a preview!⊘
Do you want full access?
Subscribe today to unlock all pages.
Trusted by 1+ million students worldwide
9
FINANCIAL MANAGEMENT
current financial liabilities represent long-term debt. The company manages the capital
efficiently and effectively by maintaining an appropriate combination of debt and equity
to continue as a going concern and to create maximum value for shareholders(Zhou,
2017). The company's capital structure is maintained and balanced as per the risk
characteristic and economic conditions to meet its daily requirements an operating needs.
The company monitors the quantitative and qualitative factors based on ranking by credit
rating agencies at regular intervals.
The company raises its share capital by issuing shares in exchange for the investment by
the shareholders. The capital structure, when solely consists of equity share capital, offers several
benefits and several disadvantages(Walker & Kramer, 2016). The advantage it provides is the
sharing of risks, and there is no obligation to pay investors regularly. When there is only equity
capital, there is no obligation to pay any interest expense, and the cash inflows can be
conveniently used for business activities, but if there is a debt component, there will be a
constant obligation to pay finance cost at regular intervals as per the agreement, and there will be
lack of funds for increasing the business operations(Jitmaneeroj, 2017). There is less risk if its
capital is wholly equity-financed because there is no debt obligation, and when it's debt-financed,
it is riskier because then there is a liability to pay. The company, if dealing with credit problems,
should structure its capital with equity since the debt component will be hard to manage due to
high-interest rates. The equity shareholders bear the business risk and demand returns or
dividends only when there is the availability of profit. The possible demerits are that when
capital is equity-financed, there might be an obligation to share profits with the equity partners,
which can be higher than the debt financing. In wholly equity financing, there will be a loss of
control when the new investors join, and there might also be a possibility of conflict in voicing
Paraphrase This Document
Need a fresh take? Get an instant paraphrase of this document with our AI Paraphraser
10
FINANCIAL MANAGEMENT
opinions. The cost of equity using CAPM in the company is .184%. The company repurchased
its preference shares in 2017.
The debt-financing is a way of raising capital by borrowing money from financial
institutions. In debt-financing, the interests which are paid on loan are tax-deductible, but the
dividends which are payable to shareholders are not(Minnis & Sutherland, 2017). The loans can
be short-term or long-term depending on the agreement between the lender and the company,
and the principal and interest repayments are fixed in advance which helps in managing cash
flow and preparing cash budgets to implement proper control. The lenders have a time-based
contract with the company, and they have no right to interfere in the company affairs, but
shareholders have the right to vote and voice their opinions(Traina, 2018). In debt-financing,
there is a debt obligation, a liability to pay interest at regular intervals. The finance cost of
Unilever is total euro 591 million, which includes Bank loans and overdrafts of euro 44 million
and interest on bonds and other loans of euro 560 million after adjusting the net gain of euro 13
million. The probable disadvantage of debt is that if there will be any decline in sales and if cash
inflows get affected, it will be difficult to repay the loan and its interests. The company, when
taking huge debts it will cause a lot of cash outflow and will affect the financial performance and
share price of the company’s security(Muda et al., 2017). The financial leverage may affect the
EPS of the company, and if there is any change in the level of debt, there will be an equivalent
impact on the level of interest payable by the company, and an increase in interest would lead to
a decrease in EPS. For capital structure management, it is essential to consider the advantages
and disadvantages of equity and debt financing(Rouxelin, Wongsunwai & Yehuda, 2018). The
capital structure should consist of a balanced proportion of debt and equity, which results in
optimum profits and efficient business operations. The weighted average cost of capital is the
11
FINANCIAL MANAGEMENT
firm’s cost of capital, which reflects the return that security holders require for investing their
funds in the company.
The company raises the money through various sources like issuing equity, preferred
stock, by taking loans, issuing warrants, through debentures and options, and all these different
sources of capital generate a separate return(Berger, Minnis & Sutherland, 2017). Thus, the
weighted average cost of capital is computed by incorporating returns in the proportion of their
weights and the weights are according to their market value. The company’s value depends on its
earnings and the Weighted Average Cost of Capital. The WACC is the return all the equity
owners and lenders expect from the company and this reflects the value of the company. For
evaluation of the company’s value calculation of Ke and WACC is essential. For calculating the
WACC calculation of the cost of debt and cost of equity is necessary(Kahn & Baum, 2020). The
factors which help in assessing the financial performance of the company can be through its P/E
ratio, Earning per Share, Net Income, Cost of Equity. The other factors can be by analyzing the
sales and comparing them from previous years' sales, and the profit margin reflects the
growth(Do & Tran, 2017). At the time of financial analysis, it is vital to assess the long-term
solvency of the company through structural and coverage ratios. The structural ratios help in
determining the long-term financial viability by analyzing the structure of debt and equity in the
capital(Winfree et al., 2018). The coverage ratios help in assessing the long-term performance
based on the relationship between sources of funds and debt-financing commitments. The debt-
equity ratio indicates the contribution of total debt and total equity in the existing capital
structure of the company. The debt consists of total liabilities and equity comprises of equity and
preference capital and retained earnings(Voss, 2019). The debt-equity ratio helps in evaluating
the capital structure and assists in measuring the performance through this.
⊘ This is a preview!⊘
Do you want full access?
Subscribe today to unlock all pages.
Trusted by 1+ million students worldwide
1 out of 21
Related Documents


Your All-in-One AI-Powered Toolkit for Academic Success.
+13062052269
info@desklib.com
Available 24*7 on WhatsApp / Email
![[object Object]](/_next/static/media/star-bottom.7253800d.svg)
Unlock your academic potential
Copyright © 2020–2026 A2Z Services. All Rights Reserved. Developed and managed by ZUCOL.