Financial Analysis of Virgin Australia: Cost of Capital and Valuation
VerifiedAdded on 2020/05/08
|19
|2142
|78
Report
AI Summary
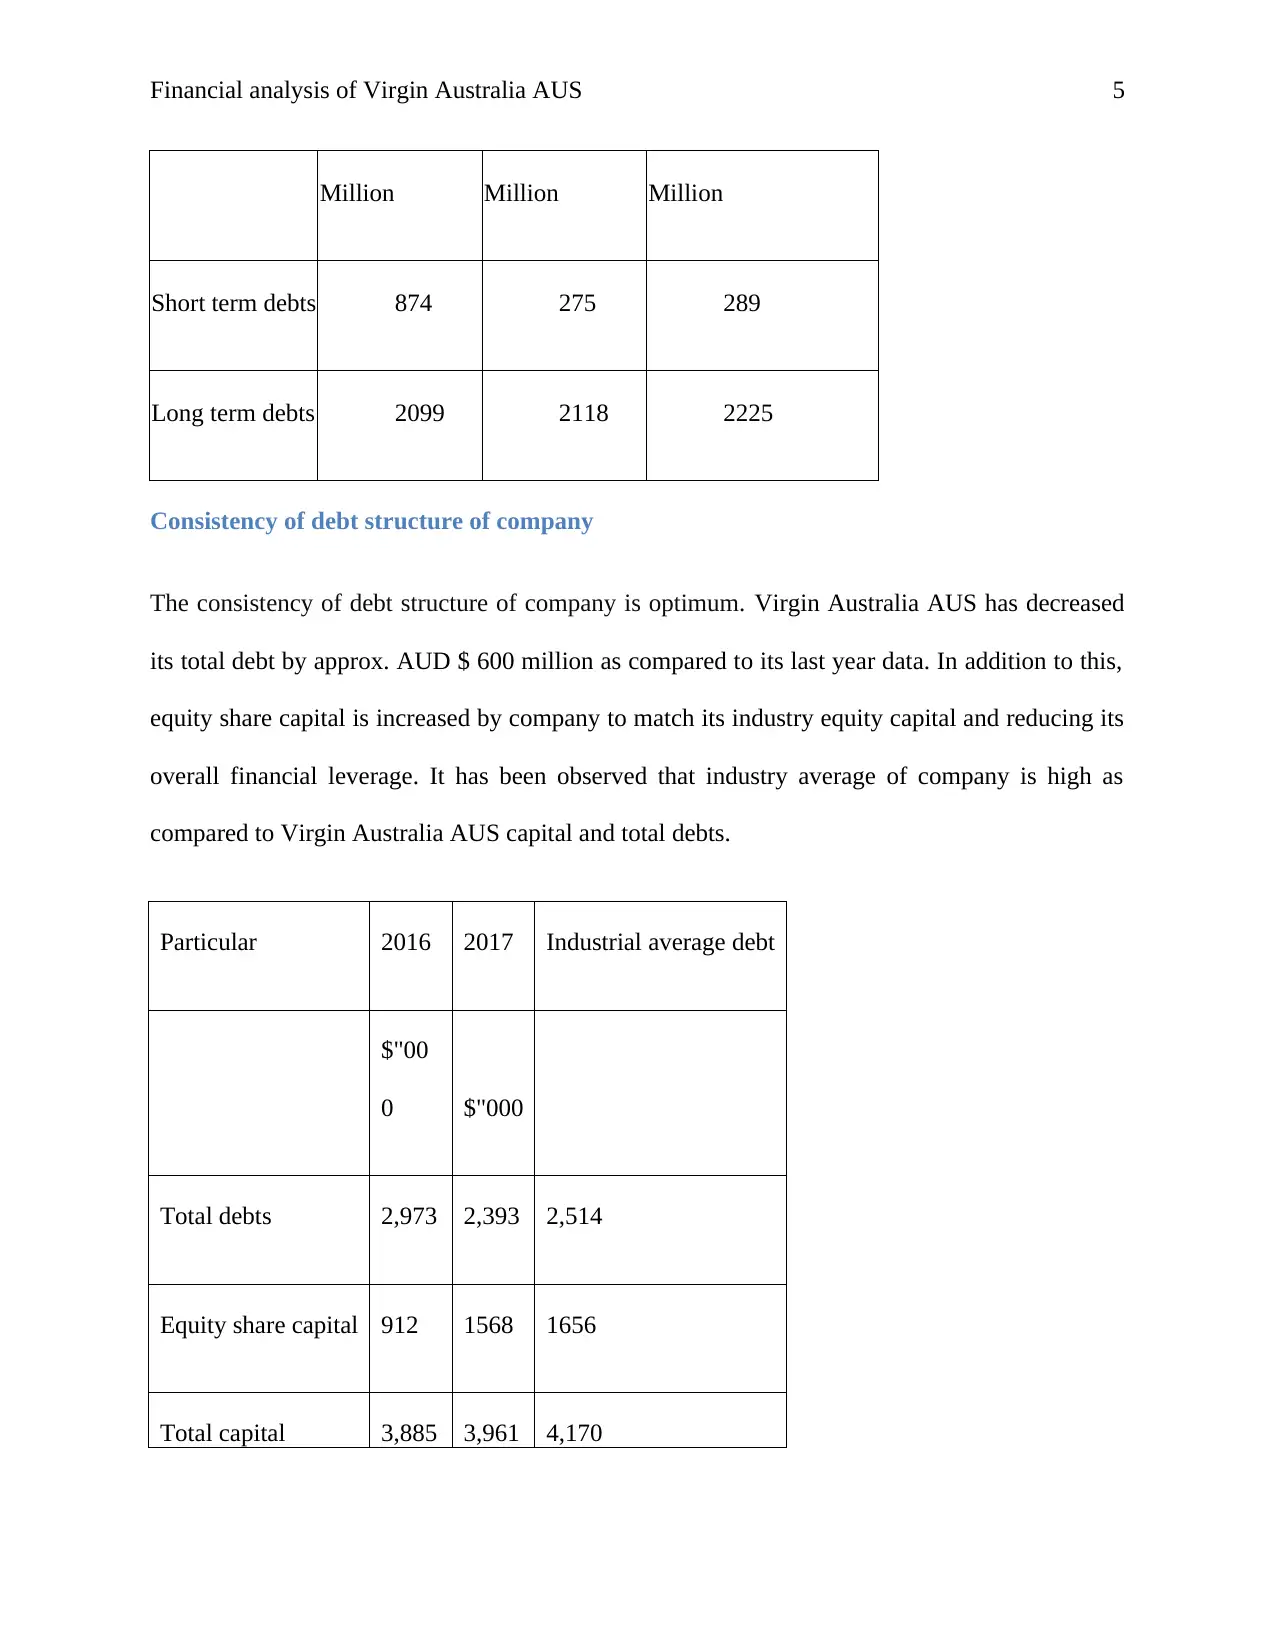
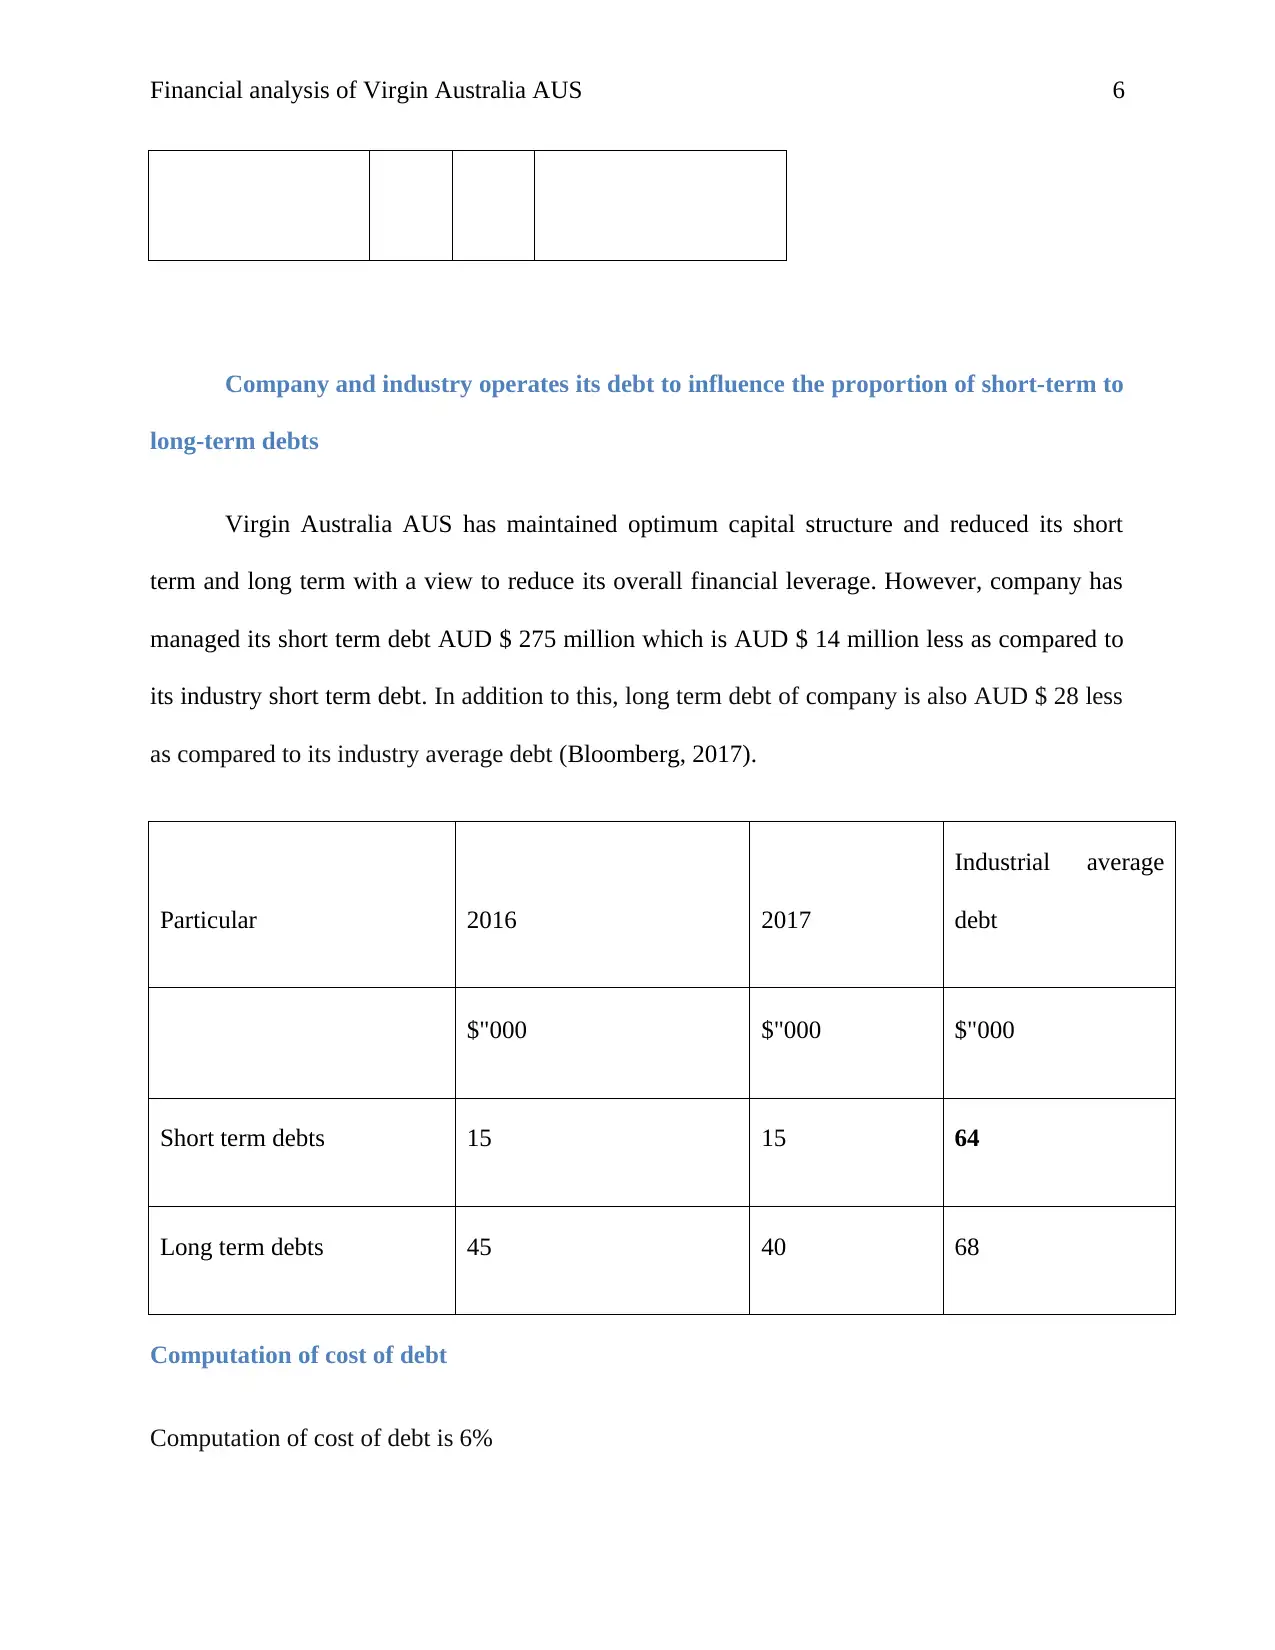
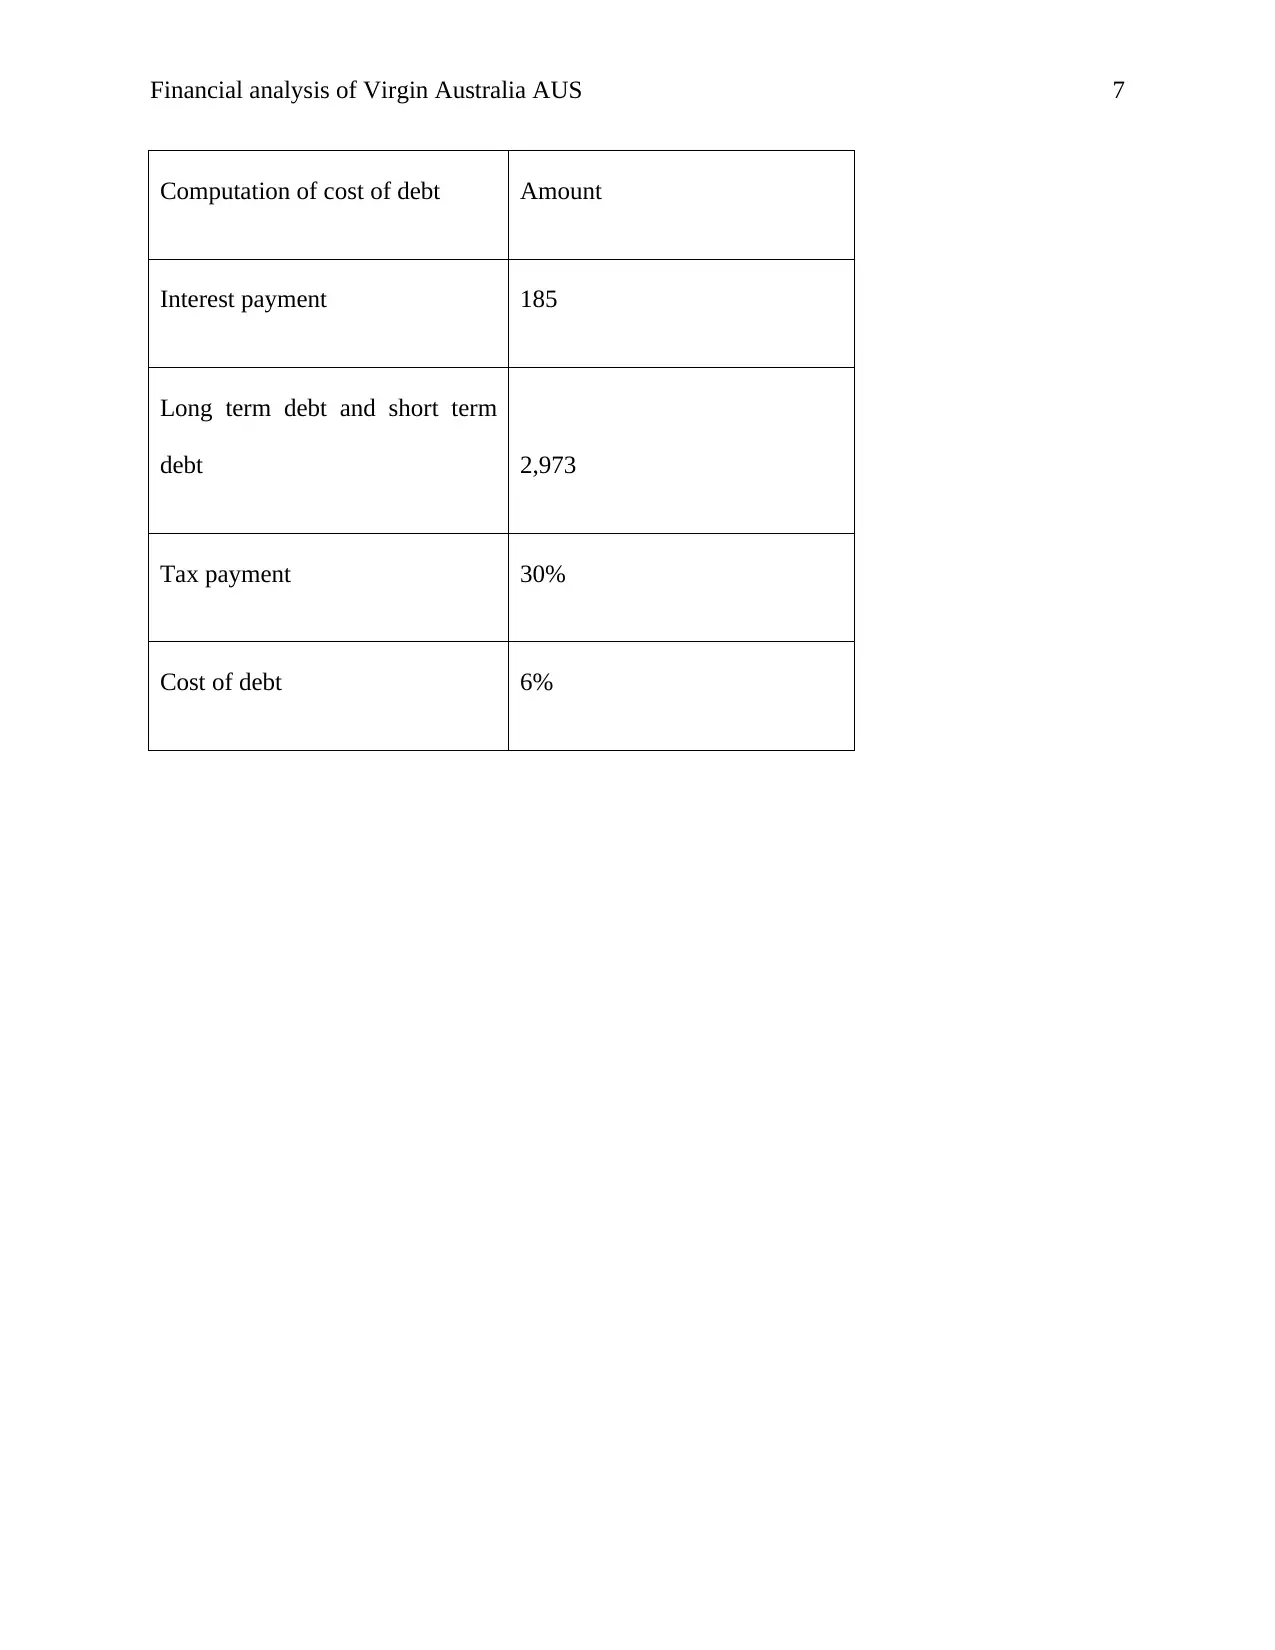
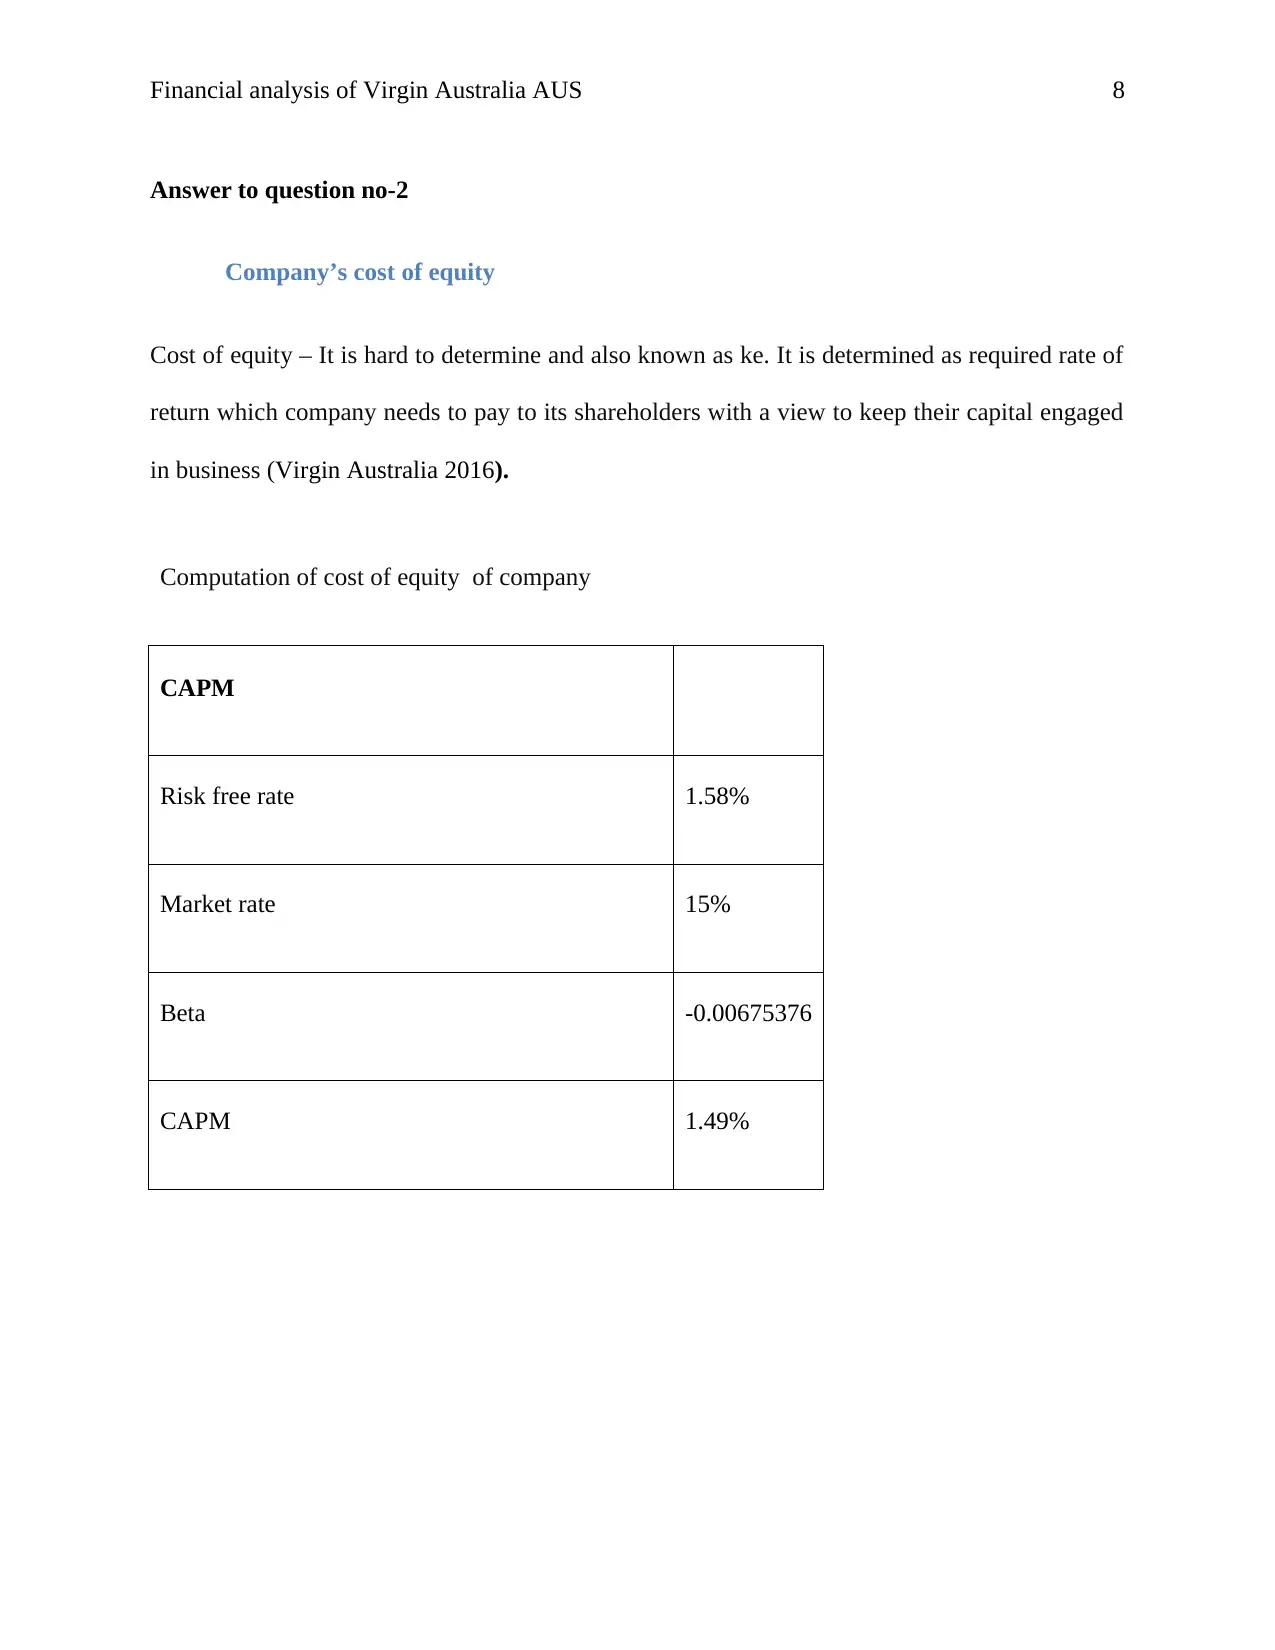
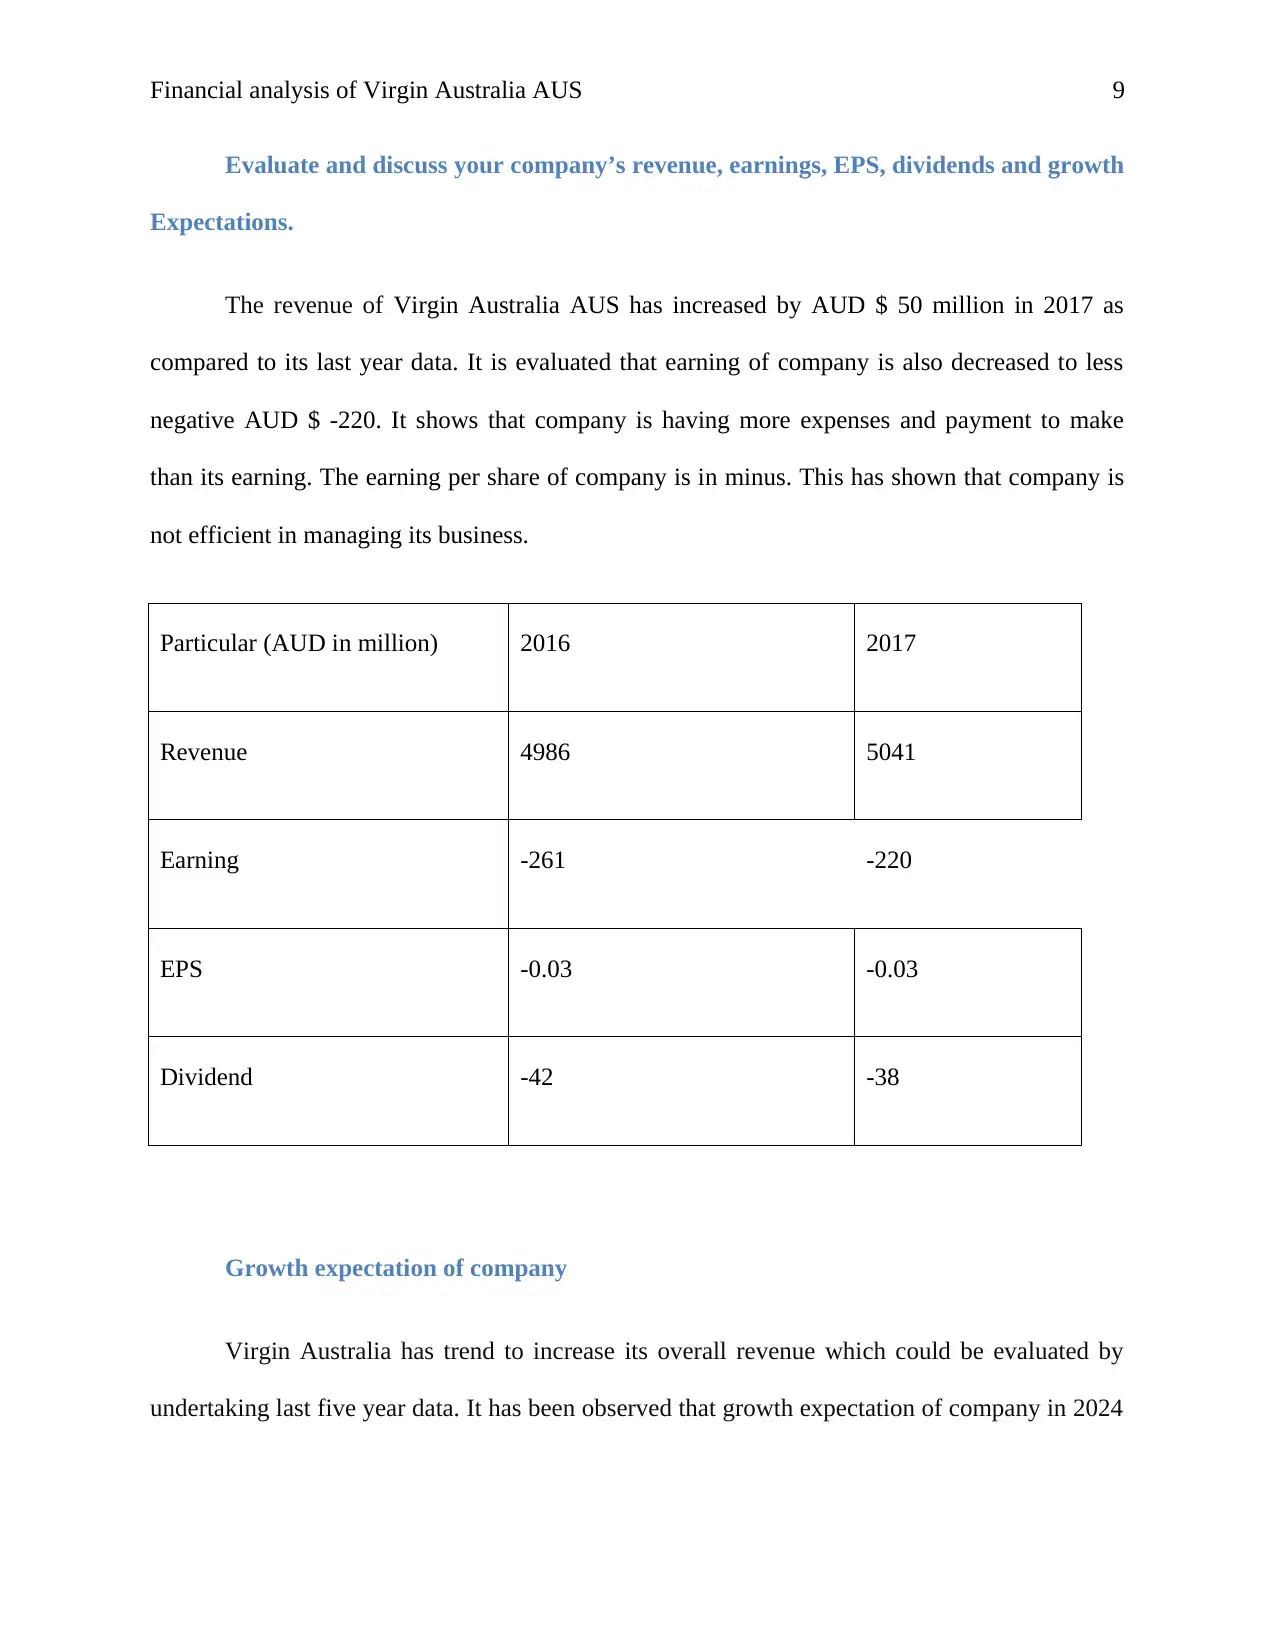
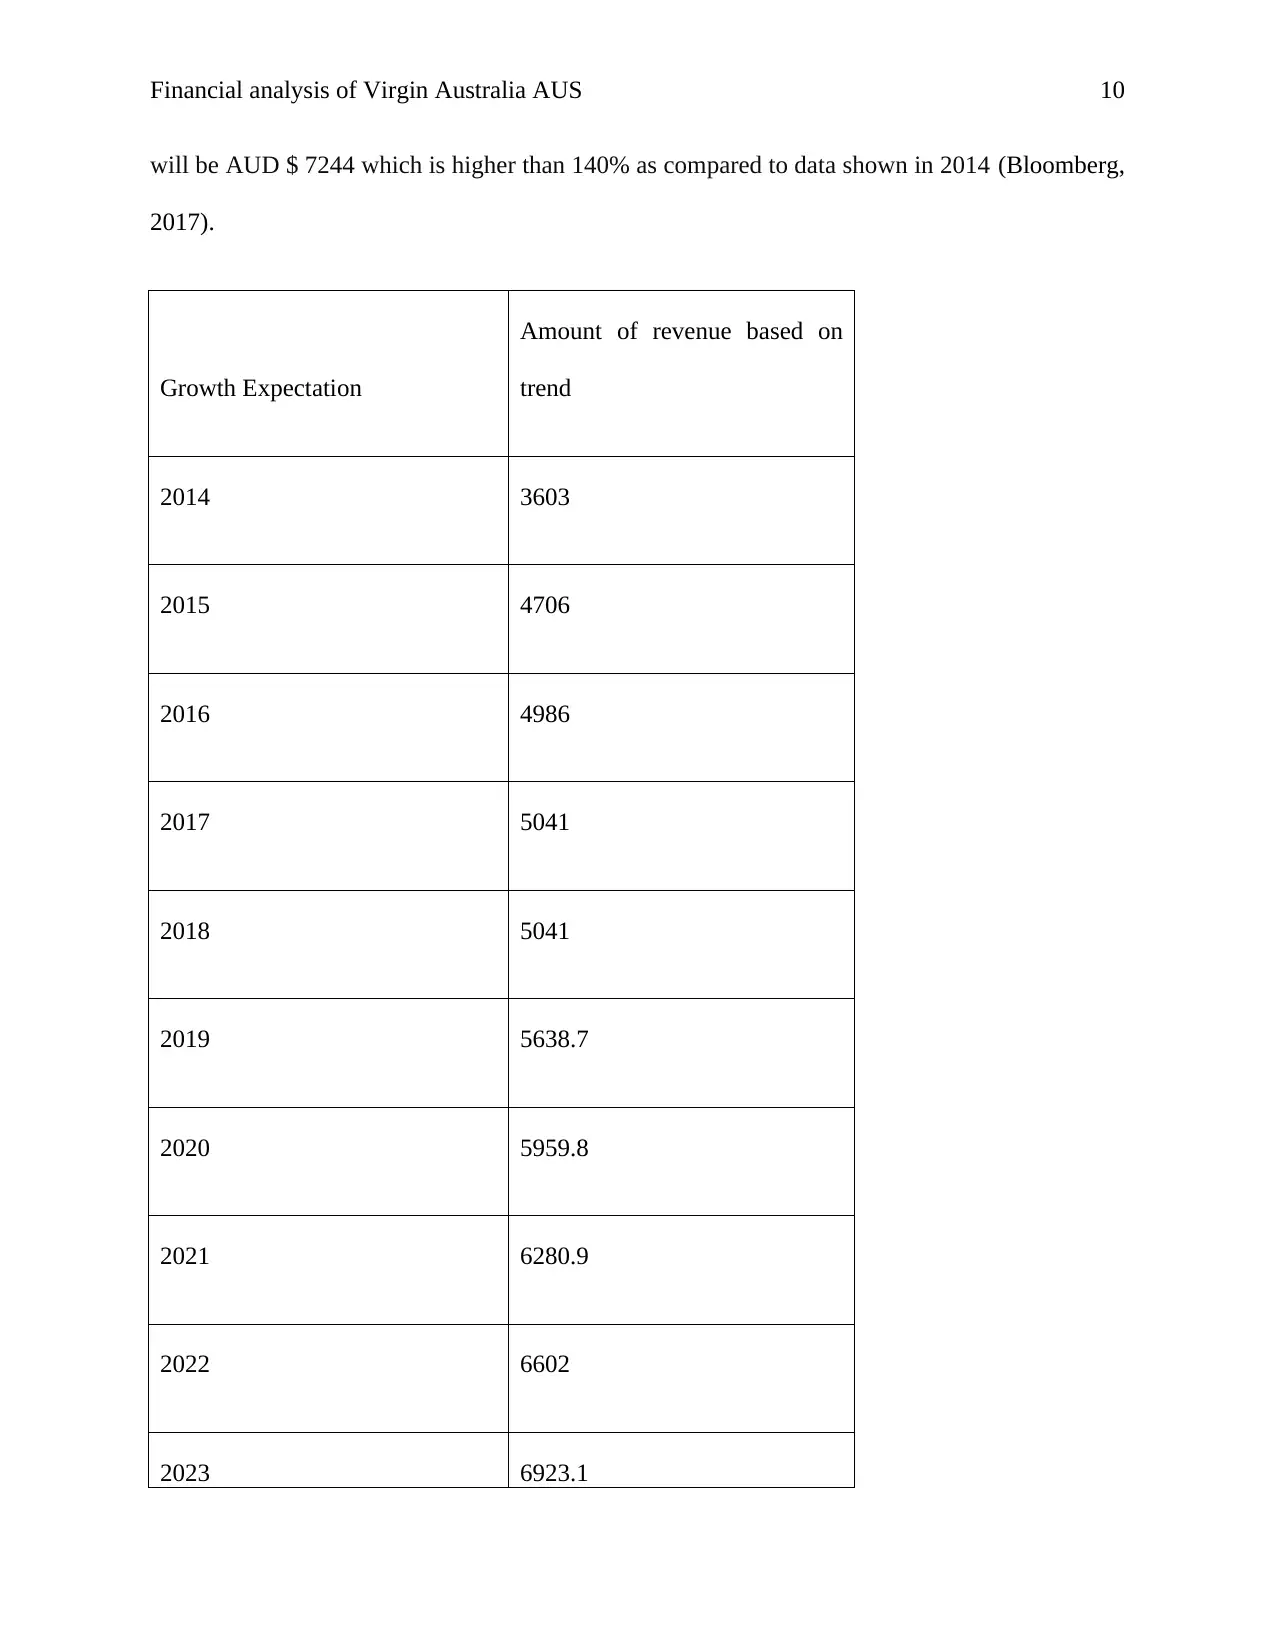
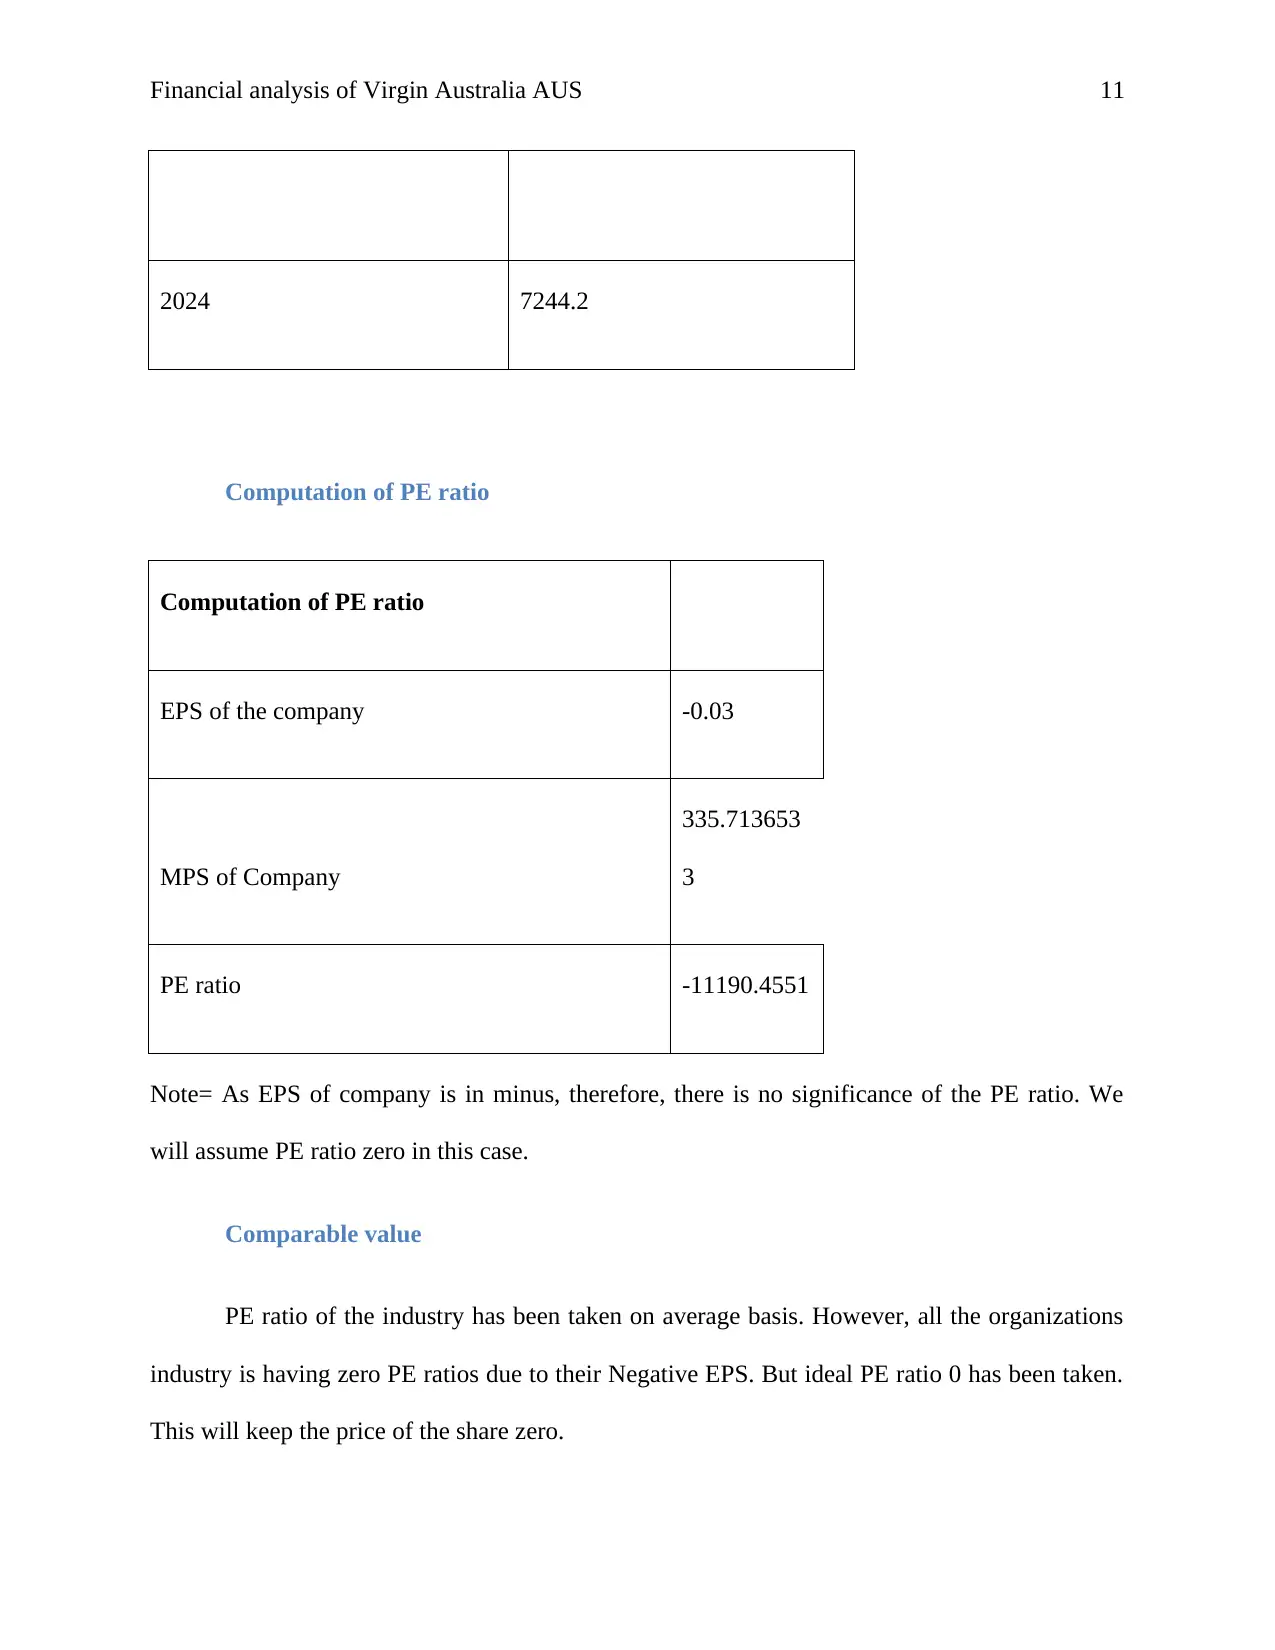
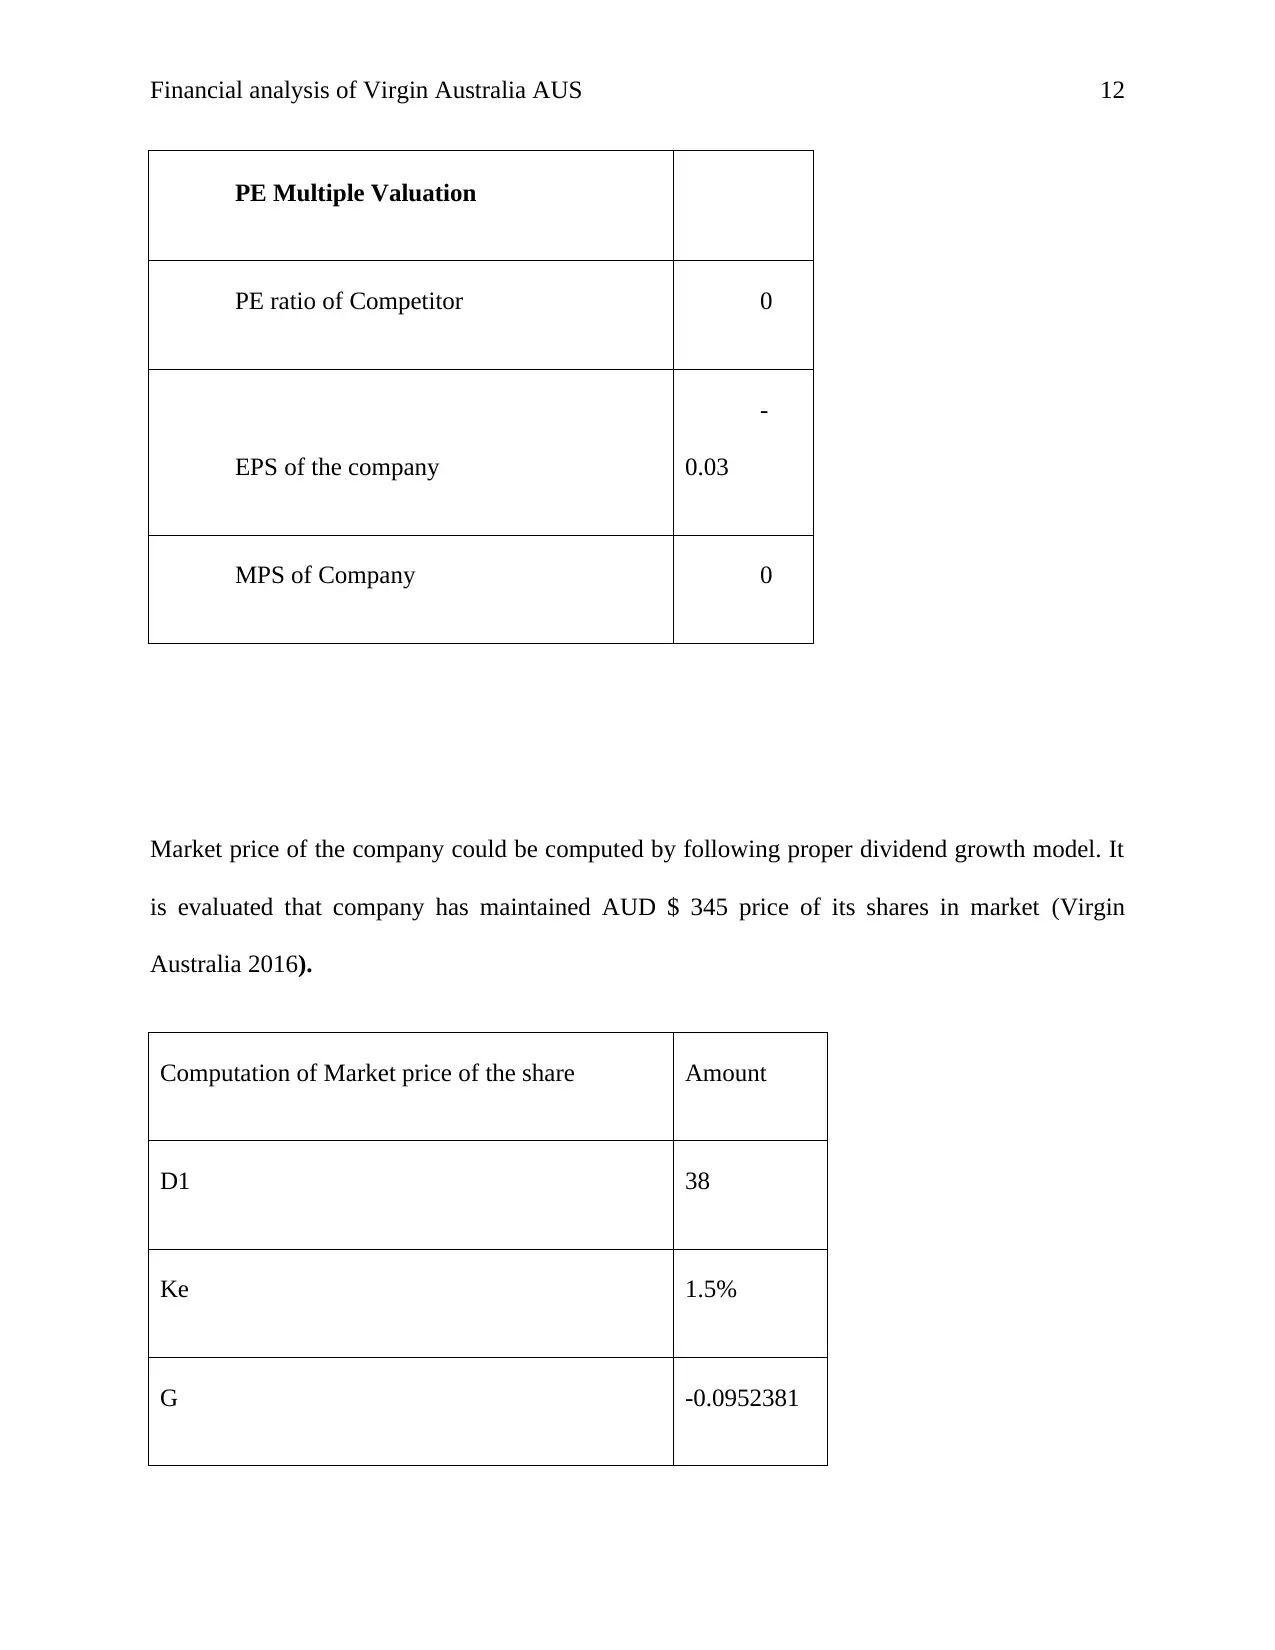
This report offers a comprehensive financial analysis of Virgin Australia, examining its capital structure, cost of debt and equity, and weighted average cost of capital (WACC). It assesses the company's short-term and long-term debts, evaluating their consistency and the influence of debt on the proportion of short-term to long-term debts. The report computes the cost of debt and equity using CAPM, discusses the company's revenue, earnings, EPS, dividends, and growth expectations. It also calculates the PE ratio and explores comparable values. Furthermore, the analysis includes the computation of WACC, an explanation of the tax rate's relation to WACC, and the rationale behind the difference between the cost of debt and equity. The report also discusses the inclusion of current liabilities in the cost of capital, the major values of the WACC calculation, and Virgin Australia's use of WACC in investment decisions. Finally, it delves into the company's capital structure, market analysis, and strategic uniqueness, offering insights into Virgin Australia's financial performance and market position.

RUNNING Head: Financial analysis of Virgin Australia AUS
1
Name of the student
Topic- Financial analysis of Virgin Australia AUS
University name
1
Name of the student
Topic- Financial analysis of Virgin Australia AUS
University name
Paraphrase This Document
Need a fresh take? Get an instant paraphrase of this document with our AI Paraphraser

Financial analysis of Virgin Australia AUS 2
Table of Contents
Introduction.......................................................................................................................2
Answer to question-1.........................................................................................................2
Short term and long term debts of company...................................................................2
Consistency of debt structure of company.....................................................................3
Company and industry operates its debt to influence the proportion of short-term to
long-term debts.......................................................................................................................... 4
Computation of cost of debt...........................................................................................4
Answer to question no-2....................................................................................................6
Company’s cost of equity...............................................................................................6
Evaluate and discuss your company’s revenue, earnings, EPS, dividends and growth
Expectations...............................................................................................................................6
Growth expectation of company....................................................................................7
Computation of PE ratio................................................................................................ 9
Comparable value.......................................................................................................... 9
Additional data and information would be preferred to value of the assets..................11
Answer to question no-3..................................................................................................12
Computation of weighted average cost of capital.........................................................12
Explanation of tax rate in relation to WACC...............................................................12

Financial analysis of Virgin Australia AUS 3
Why there is difference in cost of debt and cost of equity............................................12
Should current liabilities be included in cost of capital?..............................................13
Major value of the WACC calculation.........................................................................13
Virgin Australia Company has used WACC in investment decision............................14
Capital structure of company with the relevancy of the industry.................................14
Capital structure and what economic circumstances....................................................15
Answer to question-4.......................................................................................................16
Market analysis............................................................................................................16
Current literature search...............................................................................................16
Uniqueness of Virgin Australia....................................................................................16
Conclusion........................................................................................................................17
References....................................................................................................................... 18
Virgin Australia.................................................................................................................18
⊘ This is a preview!⊘
Do you want full access?
Subscribe today to unlock all pages.

Trusted by 1+ million students worldwide

Financial analysis of Virgin Australia AUS 4
Introduction
This report has reflected the financial analysis of Virgin Australia AUS and its capital
structure. Weighted average cost of capital and PE ratio computation assist in evaluating the
market analysis and its business operation of Virgin Australia AUS
Present details of Virgin Australia AUS
It is an Australian company which is indulged in providing airlines services and fleet services
around the globe. The parent company of Virgin Australia AUS is Virgin Australia Holding
having Brisbane Australia.
Answer to question-1
Short term and long term debts of company
Virgin Australia AUS has lower down its short term debts by 75% as compared to last
year data. It is evaluated that company has reduced its short term debts with a view to reduce its
financial leverage. It is evaluated that long term debt of company is slightly stable and Virgin
Australia has managed its long term debt with the industrial average debt. The industry debt has
been computed by evaluating all the rivals long terms debts on average basis.
Particular 2016 2017
Industrial
average debt
AUD in AUD in AUD in
Paraphrase This Document
Need a fresh take? Get an instant paraphrase of this document with our AI Paraphraser

Financial analysis of Virgin Australia AUS 5
Million Million Million
Short term debts 874 275 289
Long term debts 2099 2118 2225
Consistency of debt structure of company
The consistency of debt structure of company is optimum. Virgin Australia AUS has decreased
its total debt by approx. AUD $ 600 million as compared to its last year data. In addition to this,
equity share capital is increased by company to match its industry equity capital and reducing its
overall financial leverage. It has been observed that industry average of company is high as
compared to Virgin Australia AUS capital and total debts.
Particular 2016 2017 Industrial average debt
$"00
0 $"000
Total debts 2,973 2,393 2,514
Equity share capital 912 1568 1656
Total capital 3,885 3,961 4,170

Financial analysis of Virgin Australia AUS 6
Company and industry operates its debt to influence the proportion of short-term to
long-term debts
Virgin Australia AUS has maintained optimum capital structure and reduced its short
term and long term with a view to reduce its overall financial leverage. However, company has
managed its short term debt AUD $ 275 million which is AUD $ 14 million less as compared to
its industry short term debt. In addition to this, long term debt of company is also AUD $ 28 less
as compared to its industry average debt (Bloomberg, 2017).
Particular 2016 2017
Industrial average
debt
$"000 $"000 $"000
Short term debts 15 15 64
Long term debts 45 40 68
Computation of cost of debt
Computation of cost of debt is 6%
⊘ This is a preview!⊘
Do you want full access?
Subscribe today to unlock all pages.

Trusted by 1+ million students worldwide

Financial analysis of Virgin Australia AUS 7
Computation of cost of debt Amount
Interest payment 185
Long term debt and short term
debt 2,973
Tax payment 30%
Cost of debt 6%
Computation of cost of debt Amount
Interest payment 185
Long term debt and short term
debt 2,973
Tax payment 30%
Cost of debt 6%
Paraphrase This Document
Need a fresh take? Get an instant paraphrase of this document with our AI Paraphraser

Financial analysis of Virgin Australia AUS 8
Answer to question no-2
Company’s cost of equity
Cost of equity – It is hard to determine and also known as ke. It is determined as required rate of
return which company needs to pay to its shareholders with a view to keep their capital engaged
in business (Virgin Australia 2016).
Computation of cost of equity of company
CAPM
Risk free rate 1.58%
Market rate 15%
Beta -0.00675376
CAPM 1.49%

Financial analysis of Virgin Australia AUS 9
Evaluate and discuss your company’s revenue, earnings, EPS, dividends and growth
Expectations.
The revenue of Virgin Australia AUS has increased by AUD $ 50 million in 2017 as
compared to its last year data. It is evaluated that earning of company is also decreased to less
negative AUD $ -220. It shows that company is having more expenses and payment to make
than its earning. The earning per share of company is in minus. This has shown that company is
not efficient in managing its business.
Particular (AUD in million) 2016 2017
Revenue 4986 5041
Earning -261 -220
EPS -0.03 -0.03
Dividend -42 -38
Growth expectation of company
Virgin Australia has trend to increase its overall revenue which could be evaluated by
undertaking last five year data. It has been observed that growth expectation of company in 2024
⊘ This is a preview!⊘
Do you want full access?
Subscribe today to unlock all pages.

Trusted by 1+ million students worldwide

Financial analysis of Virgin Australia AUS 10
will be AUD $ 7244 which is higher than 140% as compared to data shown in 2014 (Bloomberg,
2017).
Growth Expectation
Amount of revenue based on
trend
2014 3603
2015 4706
2016 4986
2017 5041
2018 5041
2019 5638.7
2020 5959.8
2021 6280.9
2022 6602
2023 6923.1
will be AUD $ 7244 which is higher than 140% as compared to data shown in 2014 (Bloomberg,
2017).
Growth Expectation
Amount of revenue based on
trend
2014 3603
2015 4706
2016 4986
2017 5041
2018 5041
2019 5638.7
2020 5959.8
2021 6280.9
2022 6602
2023 6923.1
Paraphrase This Document
Need a fresh take? Get an instant paraphrase of this document with our AI Paraphraser

Financial analysis of Virgin Australia AUS 11
2024 7244.2
Computation of PE ratio
EPS of the company -0.03
MPS of Company
335.713653
3
PE ratio -11190.4551
Note= As EPS of company is in minus, therefore, there is no significance of the PE ratio. We
will assume PE ratio zero in this case.
Comparable value
PE ratio of the industry has been taken on average basis. However, all the organizations
industry is having zero PE ratios due to their Negative EPS. But ideal PE ratio 0 has been taken.
This will keep the price of the share zero.

Financial analysis of Virgin Australia AUS 12
PE Multiple Valuation
PE ratio of Competitor 0
EPS of the company
-
0.03
MPS of Company 0
Market price of the company could be computed by following proper dividend growth model. It
is evaluated that company has maintained AUD $ 345 price of its shares in market (Virgin
Australia 2016).
Computation of Market price of the share Amount
D1 38
Ke 1.5%
G -0.0952381
⊘ This is a preview!⊘
Do you want full access?
Subscribe today to unlock all pages.

Trusted by 1+ million students worldwide
1 out of 19
Related Documents

Your All-in-One AI-Powered Toolkit for Academic Success.
+13062052269
info@desklib.com
Available 24*7 on WhatsApp / Email
Unlock your academic potential
Copyright © 2020–2025 A2Z Services. All Rights Reserved. Developed and managed by ZUCOL.