Financial Analysis Report: Virgin Australia Holdings Limited
VerifiedAdded on 2021/06/16
|18
|4236
|97
Report
AI Summary
This report provides a comprehensive financial analysis of Virgin Australia Holdings Limited. It begins with an overview of the company, including its structure, governance, and ownership, highlighting major shareholders like Etihad Airways and Singapore Airlines. The analysis then delves into fundamental financial ratios, including short-term and long-term solvency ratios (current, quick, and debt-equity ratios), asset utilization ratios (inventory turnover, asset turnover), and profitability ratios (net profit margin, return on assets, and return on equity). The report also examines market value ratios, such as earnings per share and the price-to-earnings ratio, and conducts a share price analysis with graphical representations and comparisons. Significant announcements are considered, and a stock analysis is presented, along with the weighted average cost of capital (WACC), debt ratio analysis, and dividend policy. The report concludes with recommendations based on the financial data and overall performance of Virgin Australia, offering insights into the company's financial health and future prospects.

RUNNING HEAD: FINANCE
financial analysis
financial analysis
Paraphrase This Document
Need a fresh take? Get an instant paraphrase of this document with our AI Paraphraser
Finance 1
Contents
Introduction................................................................................................................................2
Description of the company.......................................................................................................2
Structure of Governance and ownership....................................................................................3
Fundamental ratios.....................................................................................................................3
Short term solvency ratios......................................................................................................3
Long term Solvency ratios......................................................................................................4
Asset utilization......................................................................................................................5
Profitability ratios...................................................................................................................8
Market value ratios.................................................................................................................9
Share price analysis..................................................................................................................10
Graphical representation.......................................................................................................10
Comparison of the share price..............................................................................................11
Significant announcements......................................................................................................12
Stock analysis...........................................................................................................................12
Weighted Average Cost of Capital..........................................................................................13
Debt ratio analysis....................................................................................................................14
Dividend policy........................................................................................................................14
Recommendation......................................................................................................................15
Conclusion................................................................................................................................15
References................................................................................................................................15
Finance 2
Introduction
Financial analysis contains the overall evaluation and measurement of company’s
performance. It includes various factors and uses several techniques to evaluate the financial
performance of a company. This report contains an overall analysis of Virgin Australia
Holdings Limited. It includes a brief overview of the company, calculation of key
performance ratios, debt ratio analysis and estimation of WACC. Furthermore, the report also
concentrates on dividend policy of the company, its beta factor and the movements in stock
prices compared with the ordinaries indices. Lastly a conclusion and recommendation is
provided suggesting the overall position of Virgin Australia.
Description of the company
Virgin Australia Holdings Limited is an Australia based holding company which operates
Virgin Australia and Tigerair Australia. The company deals with providing domestic and
international airline services in Australia. It has various segments named as Virgin Australia
Domestic, Virgin Australia International, Velocity, and Tigerair Australia. It was formerly
known as Virgin Blue Airlines and is regarded as second largest airline of Australia, after
Qantas (Bloomberg.com. 2018). Founded in 1999, the organization started its business in
2000. The airline provides its services over 29 cities in Australia and it has its main hubs in
Melbourne, Brisbane and Sydney. Virgin Australia mainly has its airports operating in cities
like Perth, Adelaide and Gold coast (Reuters. 2018).
The vision of the company is to revolutionise the air travel across all its segments. In order to
do this, Virgin Australia is focused on providing seamless experience across all domestic and
international markets. The company is listed on Australian Securities Exchange and is traded
with a symbol ASX: VAH (Virgin Australia. 2018).
⊘ This is a preview!⊘
Do you want full access?
Subscribe today to unlock all pages.
Trusted by 1+ million students worldwide
Finance 3
Structure of Governance and ownership
Main substantial shareholders
20% or more shareholdings: Etihad Airways P.J.S.C. (21.83%), Singapore Airlines
Ltd (20.09%) and Nanshan Capital Holdings Limited,Nanshan Group
Co.Ltd,Nanshan Group Capital Investment Company with a holding of 19.98%.
More than 5% shareholdings: HNA Tourism Group Co. Ltd (19.17%) and Corvina
Holdings Limited (10.42%).
Main people involved in firm governance
The Chairman: Ms Elizabeth Bryan AM
Board members: Ms Samantha Mostyn, The Hon. Mark Vaile AO, Mr Ken Dean, Mr
Trevor Bourne, Mr Mark Chellew, Mr Marvin Tan, Mr Robin Kamark, Mr Warwick
Negus, Mr Lan Xiang and Mr Zhang Kui. All these are independent and non-
executive directors.
CEO: Mr John Borghetti AO (Virgin Australia. 2018).
Neither of these members are involved in more than 20% shareholding nor is any shareholder
of more than 5% holding involved in firm governance.
Fundamental ratios
Short term solvency ratios
1. Current ratio
It is one of the liquidity ratio which measure the short term solvency of a company. It
identifies the capability of an organisation to pay its current liabilities by properly utilizing its
current assets. The ideal current ratio is 2:1 which implies that a company must have its
current assets doubled of its liabilities (Vogel, 2014).
Paraphrase This Document
Need a fresh take? Get an instant paraphrase of this document with our AI Paraphraser
Finance 4
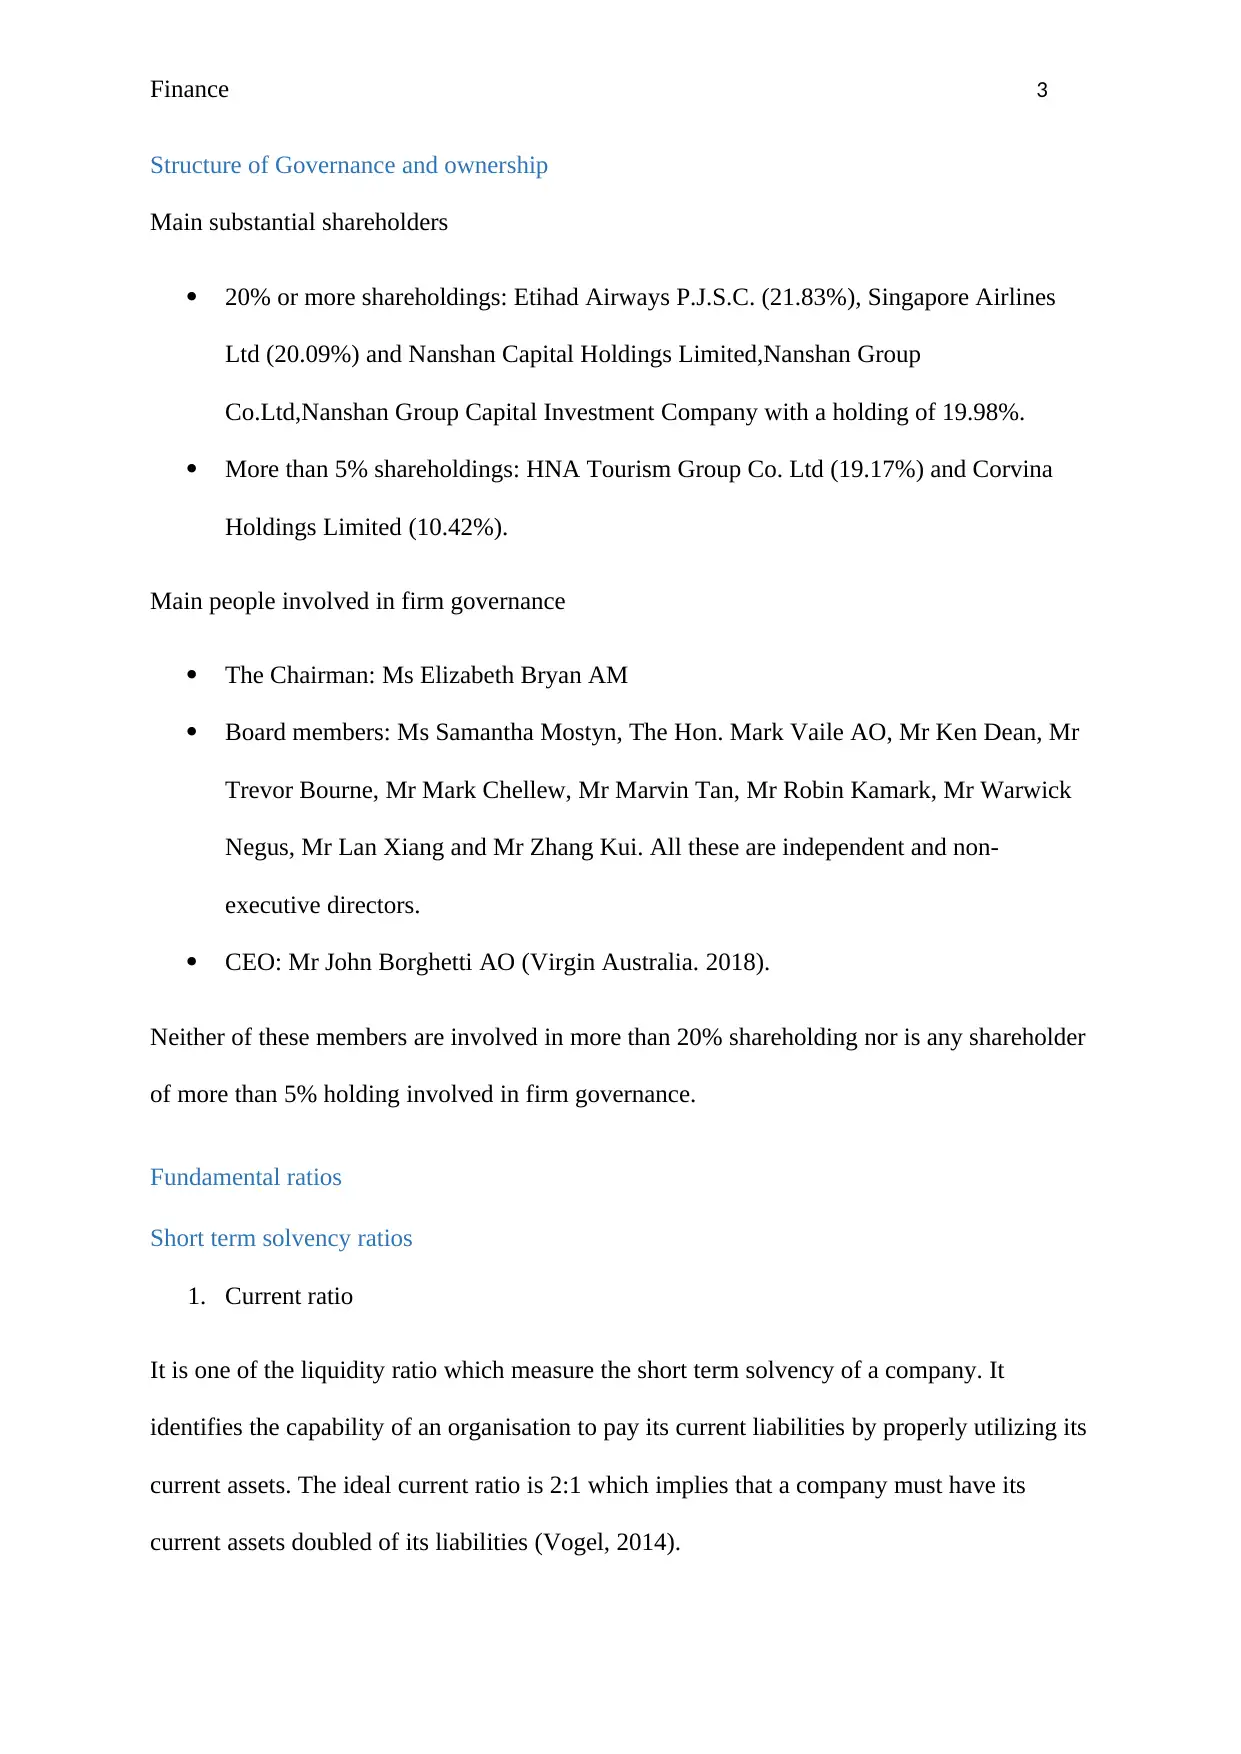
Liquidity ratio Years
2017 2016
Current ratio 0.76 0.62
Quick ratio 0.74 0.60
(Virginaustralia.com. 2017).
The above table shows the liquidity ratios of Virgin Australia for the years 2016 and 2017. It
includes current ratio which has been increased over the years. In 2016 it was 0.62 and the
same was reported at 0.76 in 2017. However, the ratio is less than the ideal one but it shows
the enhanced capability of Virgin Australia. The ratio rises due to increase in cash balance of
the company and less portion of inventory.
2. Quick ratio
It is another liquidity ratio which reflects the same thing as current ratio. The only difference
is that it takes into account the quick assets of company which are the most liquid assets that
can be easily converted into cash. The ideal ratio is 1:1.
Looking at the above table, Virgin Australia’s quick ratio has also shows the same trend as
the current ratio. In 2016, it was 0.60 which increases to 0.74 in 2017. Reason being the
increased cash balance of the company.
Long term Solvency ratios
1. Debt equity ratio
It is a financial leverage ratio which measure the long term solvency of the firm. Debt equity
ratio shows the portion of company’s assets that are financed through debt and the portion of
assets which is financed through equity. Higher the portion if debt, high will be the financial
risk (Jenter and Lewellen, 2015).
Finance 5
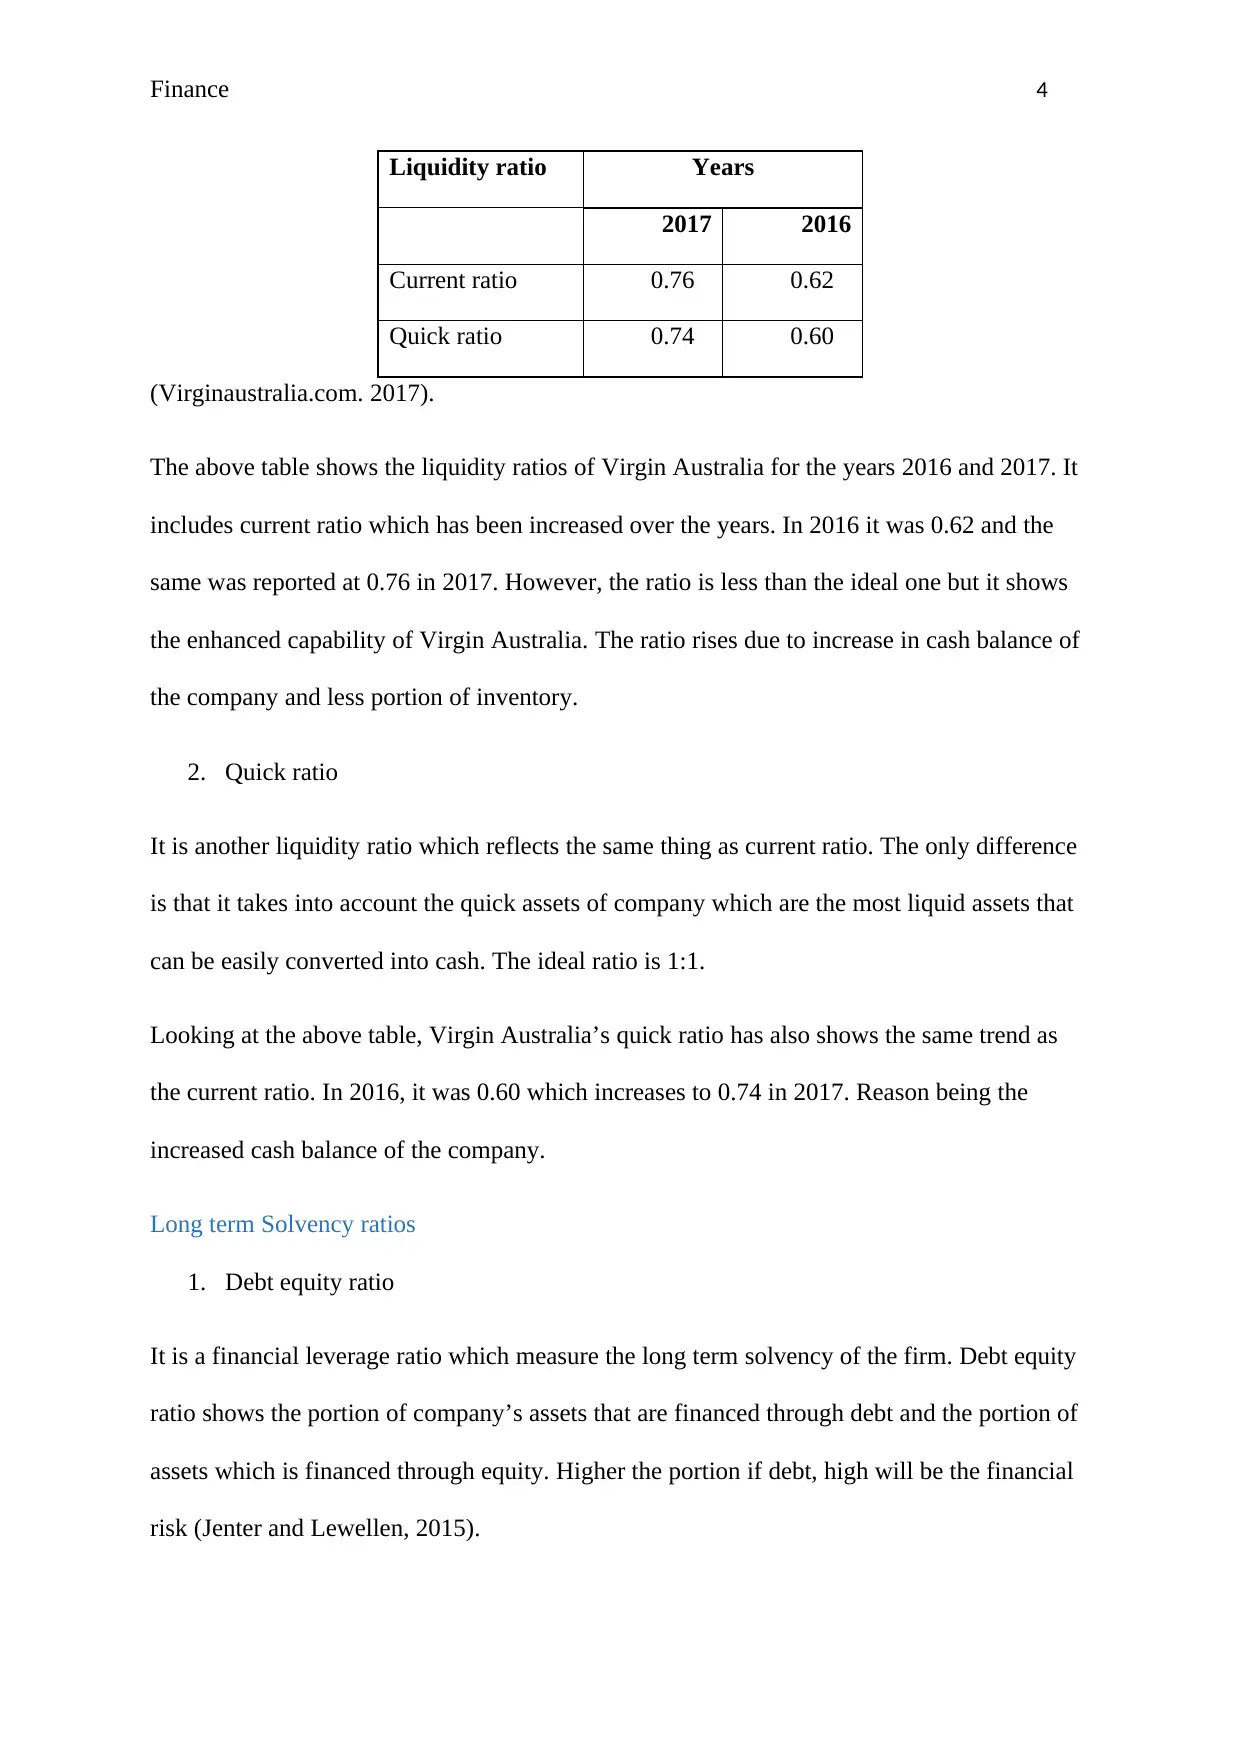
Financial leverage ratio Years
2017 2016
Debt- equity 1.55 3.34
Interest coverage ratio - 0.66 - 1.42
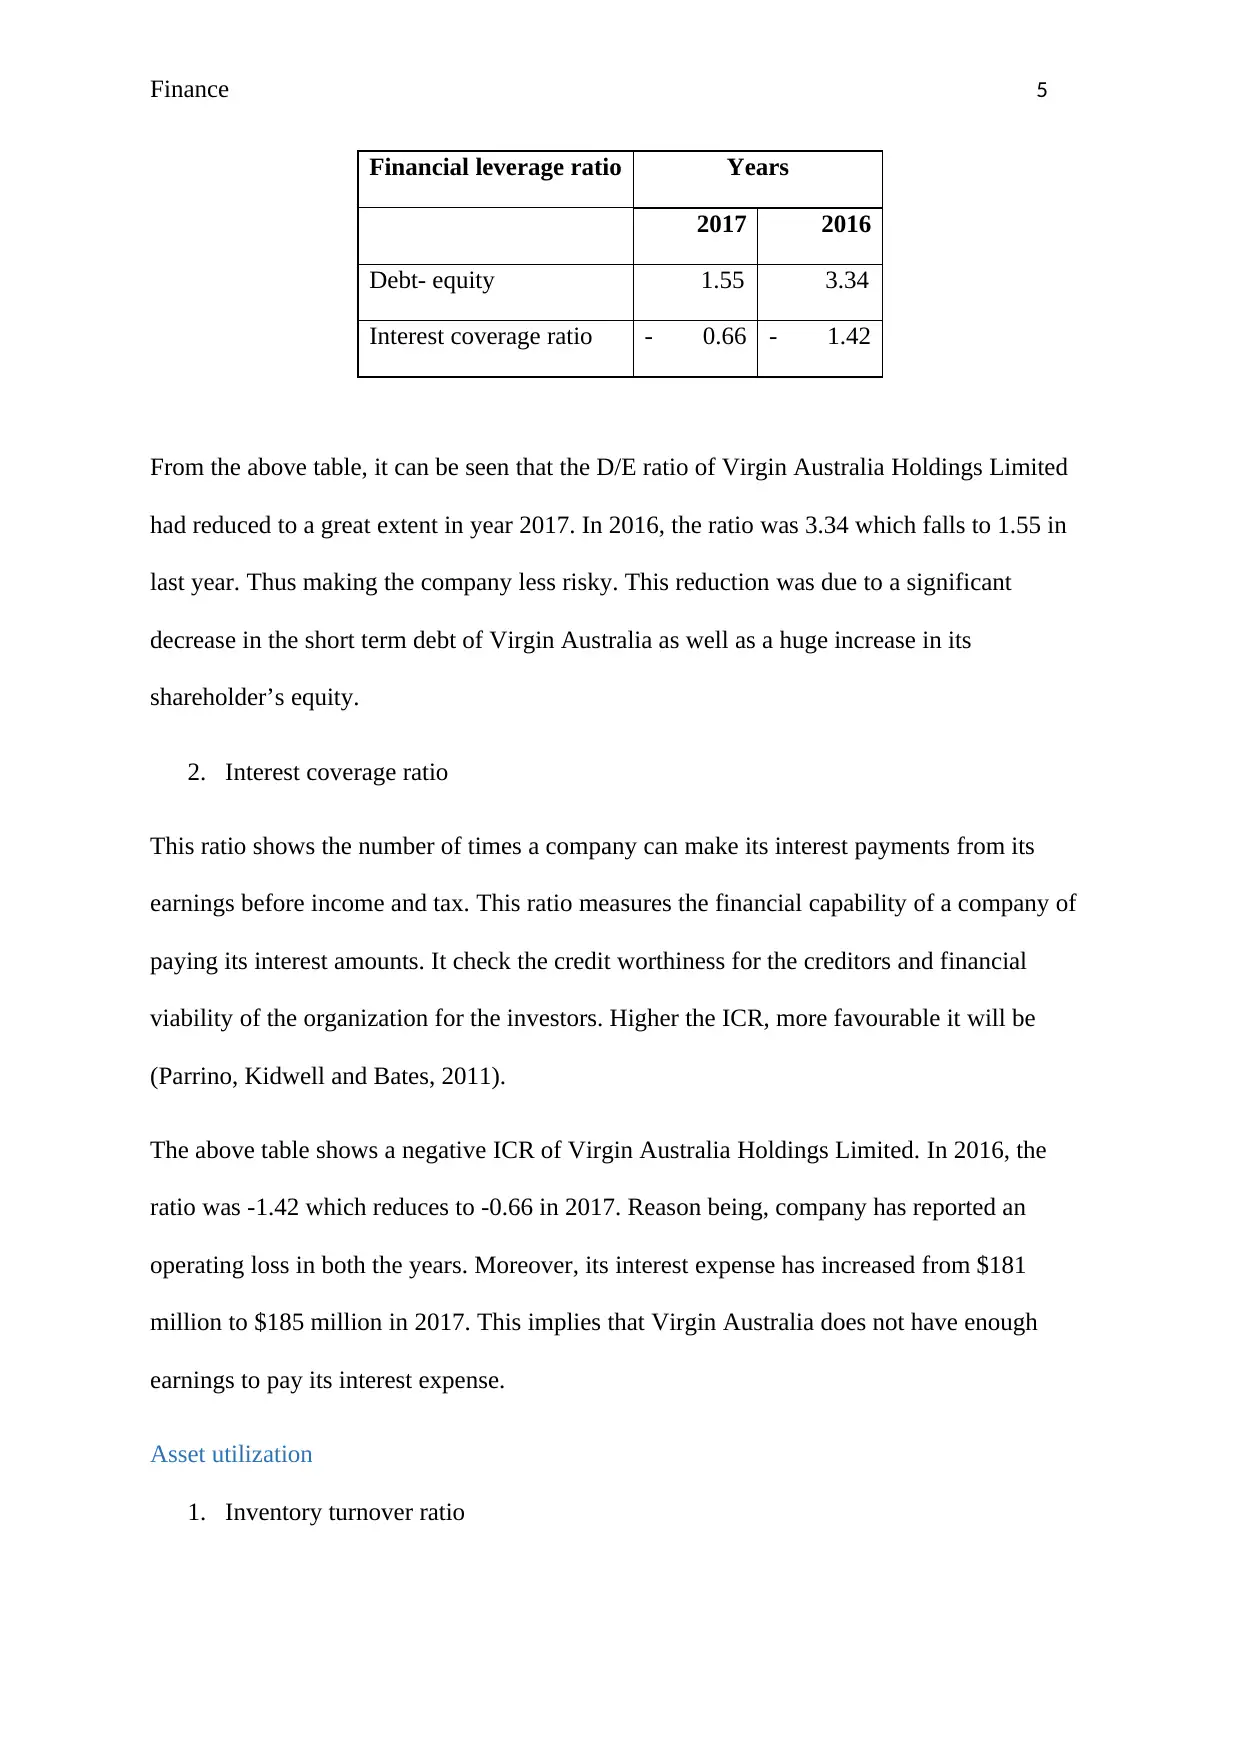
From the above table, it can be seen that the D/E ratio of Virgin Australia Holdings Limited
had reduced to a great extent in year 2017. In 2016, the ratio was 3.34 which falls to 1.55 in
last year. Thus making the company less risky. This reduction was due to a significant
decrease in the short term debt of Virgin Australia as well as a huge increase in its
shareholder’s equity.
2. Interest coverage ratio
This ratio shows the number of times a company can make its interest payments from its
earnings before income and tax. This ratio measures the financial capability of a company of
paying its interest amounts. It check the credit worthiness for the creditors and financial
viability of the organization for the investors. Higher the ICR, more favourable it will be
(Parrino, Kidwell and Bates, 2011).
The above table shows a negative ICR of Virgin Australia Holdings Limited. In 2016, the
ratio was -1.42 which reduces to -0.66 in 2017. Reason being, company has reported an
operating loss in both the years. Moreover, its interest expense has increased from $181
million to $185 million in 2017. This implies that Virgin Australia does not have enough
earnings to pay its interest expense.
Asset utilization
1. Inventory turnover ratio
Financial leverage ratio Years
2017 2016
Debt- equity 1.55 3.34
Interest coverage ratio - 0.66 - 1.42
From the above table, it can be seen that the D/E ratio of Virgin Australia Holdings Limited
had reduced to a great extent in year 2017. In 2016, the ratio was 3.34 which falls to 1.55 in
last year. Thus making the company less risky. This reduction was due to a significant
decrease in the short term debt of Virgin Australia as well as a huge increase in its
shareholder’s equity.
2. Interest coverage ratio
This ratio shows the number of times a company can make its interest payments from its
earnings before income and tax. This ratio measures the financial capability of a company of
paying its interest amounts. It check the credit worthiness for the creditors and financial
viability of the organization for the investors. Higher the ICR, more favourable it will be
(Parrino, Kidwell and Bates, 2011).
The above table shows a negative ICR of Virgin Australia Holdings Limited. In 2016, the
ratio was -1.42 which reduces to -0.66 in 2017. Reason being, company has reported an
operating loss in both the years. Moreover, its interest expense has increased from $181
million to $185 million in 2017. This implies that Virgin Australia does not have enough
earnings to pay its interest expense.
Asset utilization
1. Inventory turnover ratio
⊘ This is a preview!⊘
Do you want full access?
Subscribe today to unlock all pages.
Trusted by 1+ million students worldwide
Finance 6
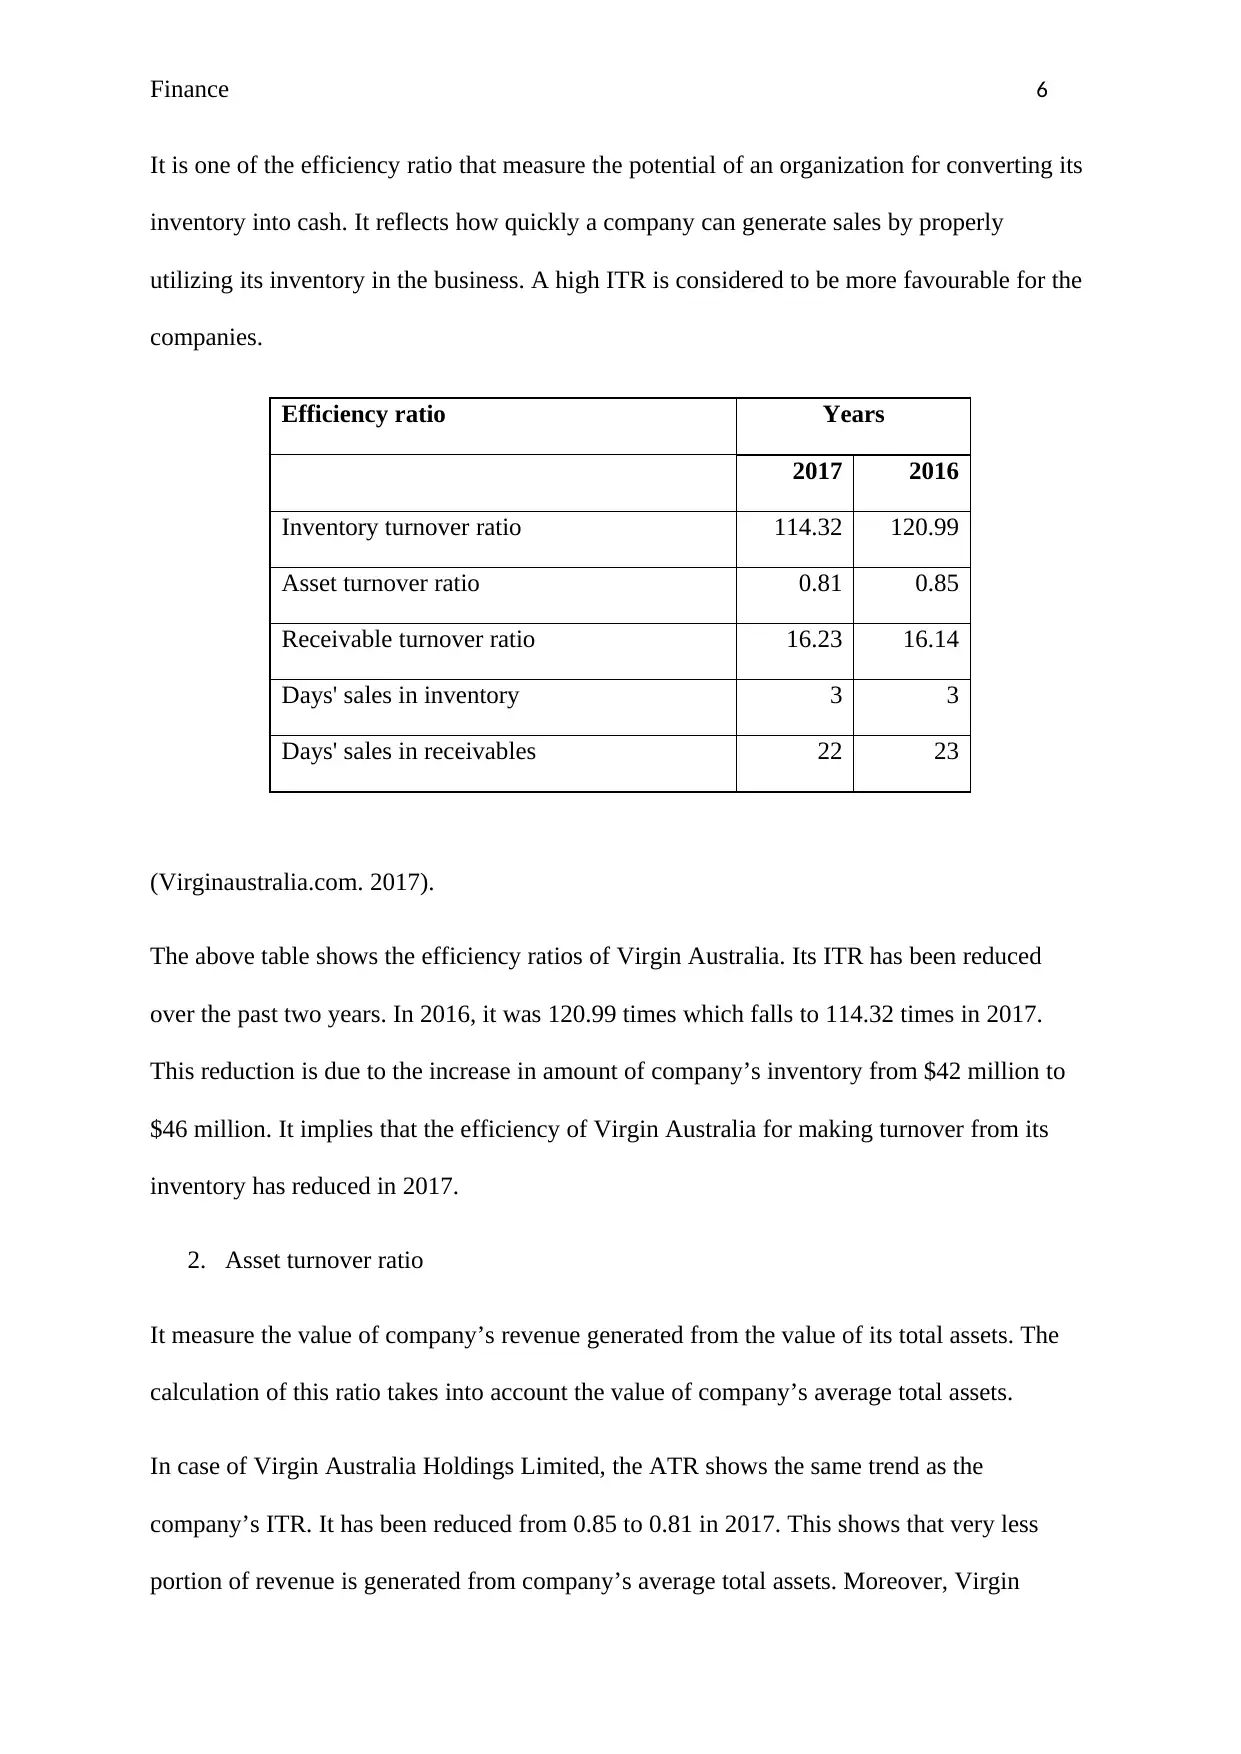
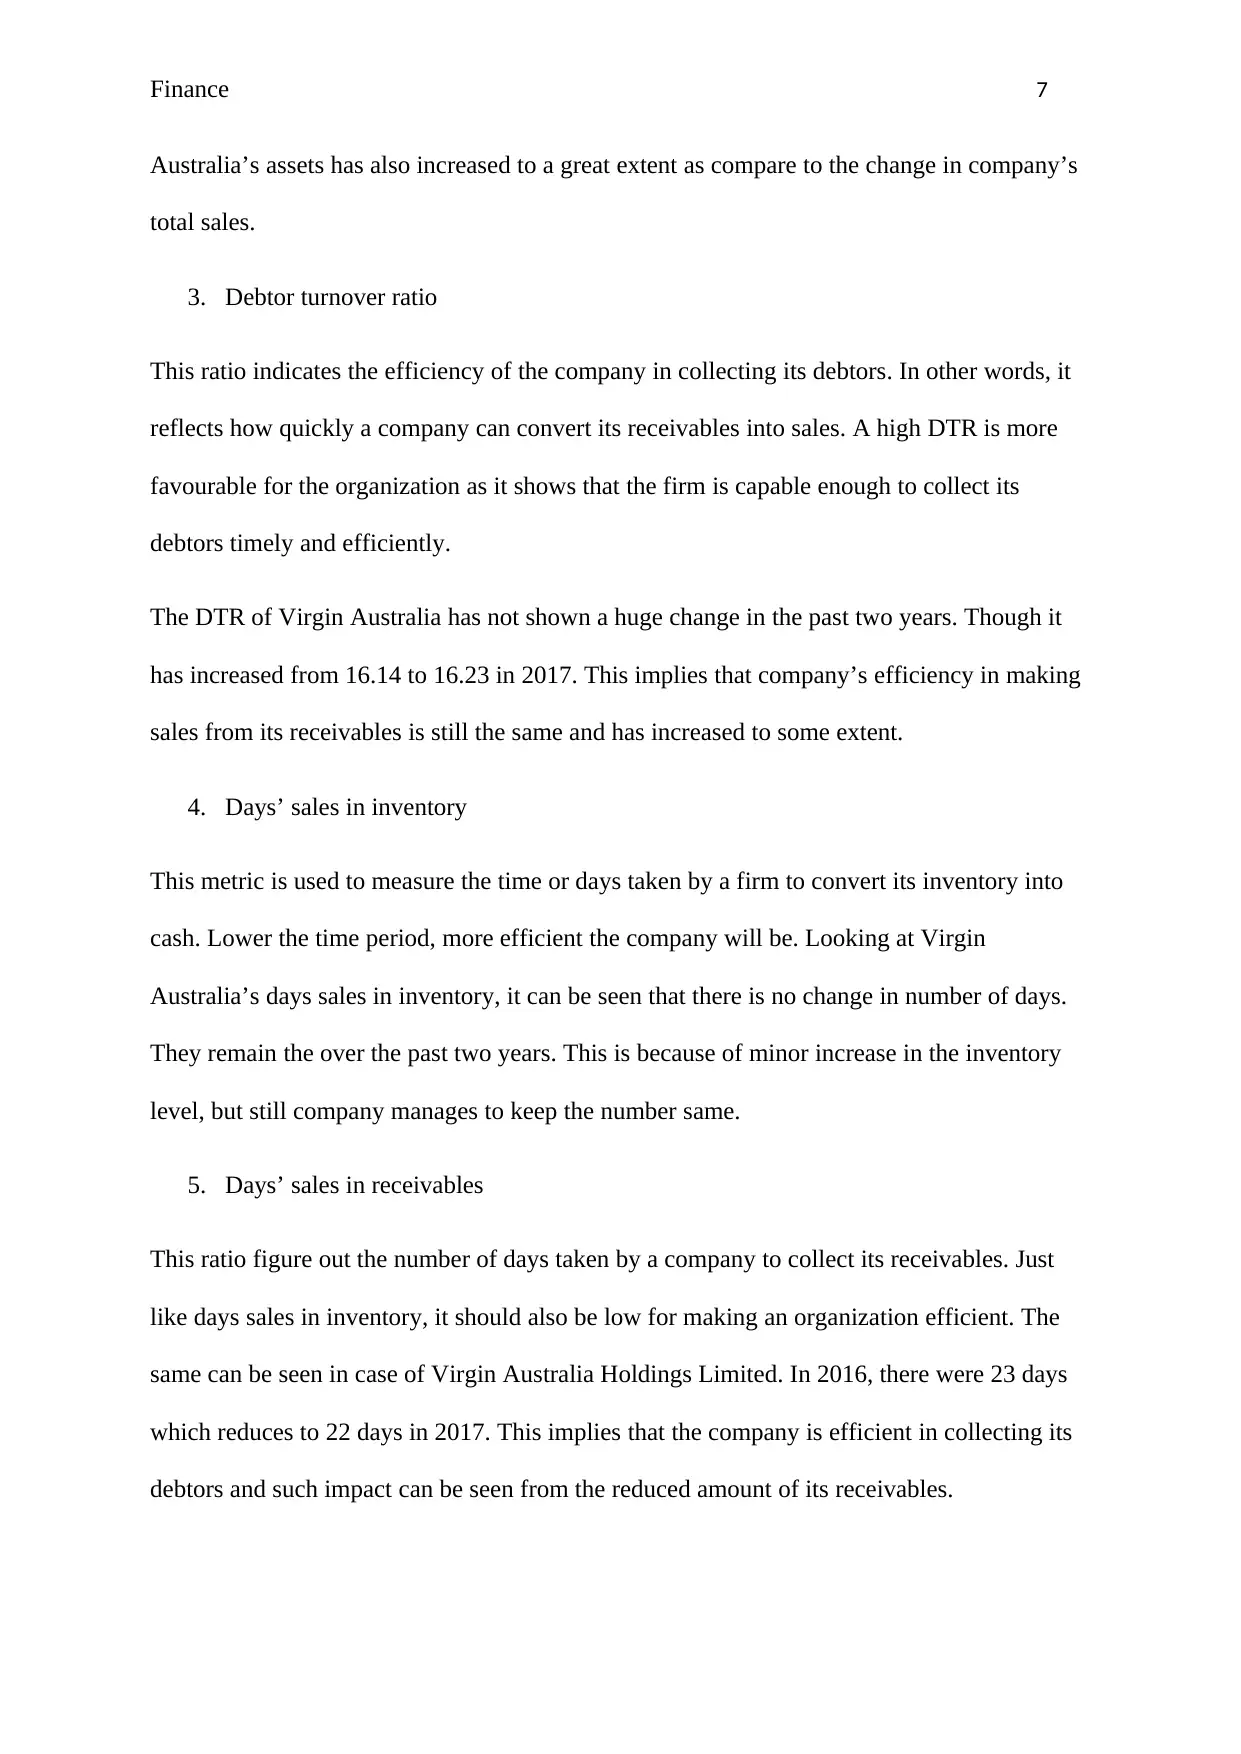
It is one of the efficiency ratio that measure the potential of an organization for converting its
inventory into cash. It reflects how quickly a company can generate sales by properly
utilizing its inventory in the business. A high ITR is considered to be more favourable for the
companies.
Efficiency ratio Years
2017 2016
Inventory turnover ratio 114.32 120.99
Asset turnover ratio 0.81 0.85
Receivable turnover ratio 16.23 16.14
Days' sales in inventory 3 3
Days' sales in receivables 22 23
(Virginaustralia.com. 2017).
The above table shows the efficiency ratios of Virgin Australia. Its ITR has been reduced
over the past two years. In 2016, it was 120.99 times which falls to 114.32 times in 2017.
This reduction is due to the increase in amount of company’s inventory from $42 million to
$46 million. It implies that the efficiency of Virgin Australia for making turnover from its
inventory has reduced in 2017.
2. Asset turnover ratio
It measure the value of company’s revenue generated from the value of its total assets. The
calculation of this ratio takes into account the value of company’s average total assets.
In case of Virgin Australia Holdings Limited, the ATR shows the same trend as the
company’s ITR. It has been reduced from 0.85 to 0.81 in 2017. This shows that very less
portion of revenue is generated from company’s average total assets. Moreover, Virgin
Paraphrase This Document
Need a fresh take? Get an instant paraphrase of this document with our AI Paraphraser
Finance 7
Australia’s assets has also increased to a great extent as compare to the change in company’s
total sales.
3. Debtor turnover ratio
This ratio indicates the efficiency of the company in collecting its debtors. In other words, it
reflects how quickly a company can convert its receivables into sales. A high DTR is more
favourable for the organization as it shows that the firm is capable enough to collect its
debtors timely and efficiently.
The DTR of Virgin Australia has not shown a huge change in the past two years. Though it
has increased from 16.14 to 16.23 in 2017. This implies that company’s efficiency in making
sales from its receivables is still the same and has increased to some extent.
4. Days’ sales in inventory
This metric is used to measure the time or days taken by a firm to convert its inventory into
cash. Lower the time period, more efficient the company will be. Looking at Virgin
Australia’s days sales in inventory, it can be seen that there is no change in number of days.
They remain the over the past two years. This is because of minor increase in the inventory
level, but still company manages to keep the number same.
5. Days’ sales in receivables
This ratio figure out the number of days taken by a company to collect its receivables. Just
like days sales in inventory, it should also be low for making an organization efficient. The
same can be seen in case of Virgin Australia Holdings Limited. In 2016, there were 23 days
which reduces to 22 days in 2017. This implies that the company is efficient in collecting its
debtors and such impact can be seen from the reduced amount of its receivables.
Finance 8
Profitability ratios
1. Net profit margin
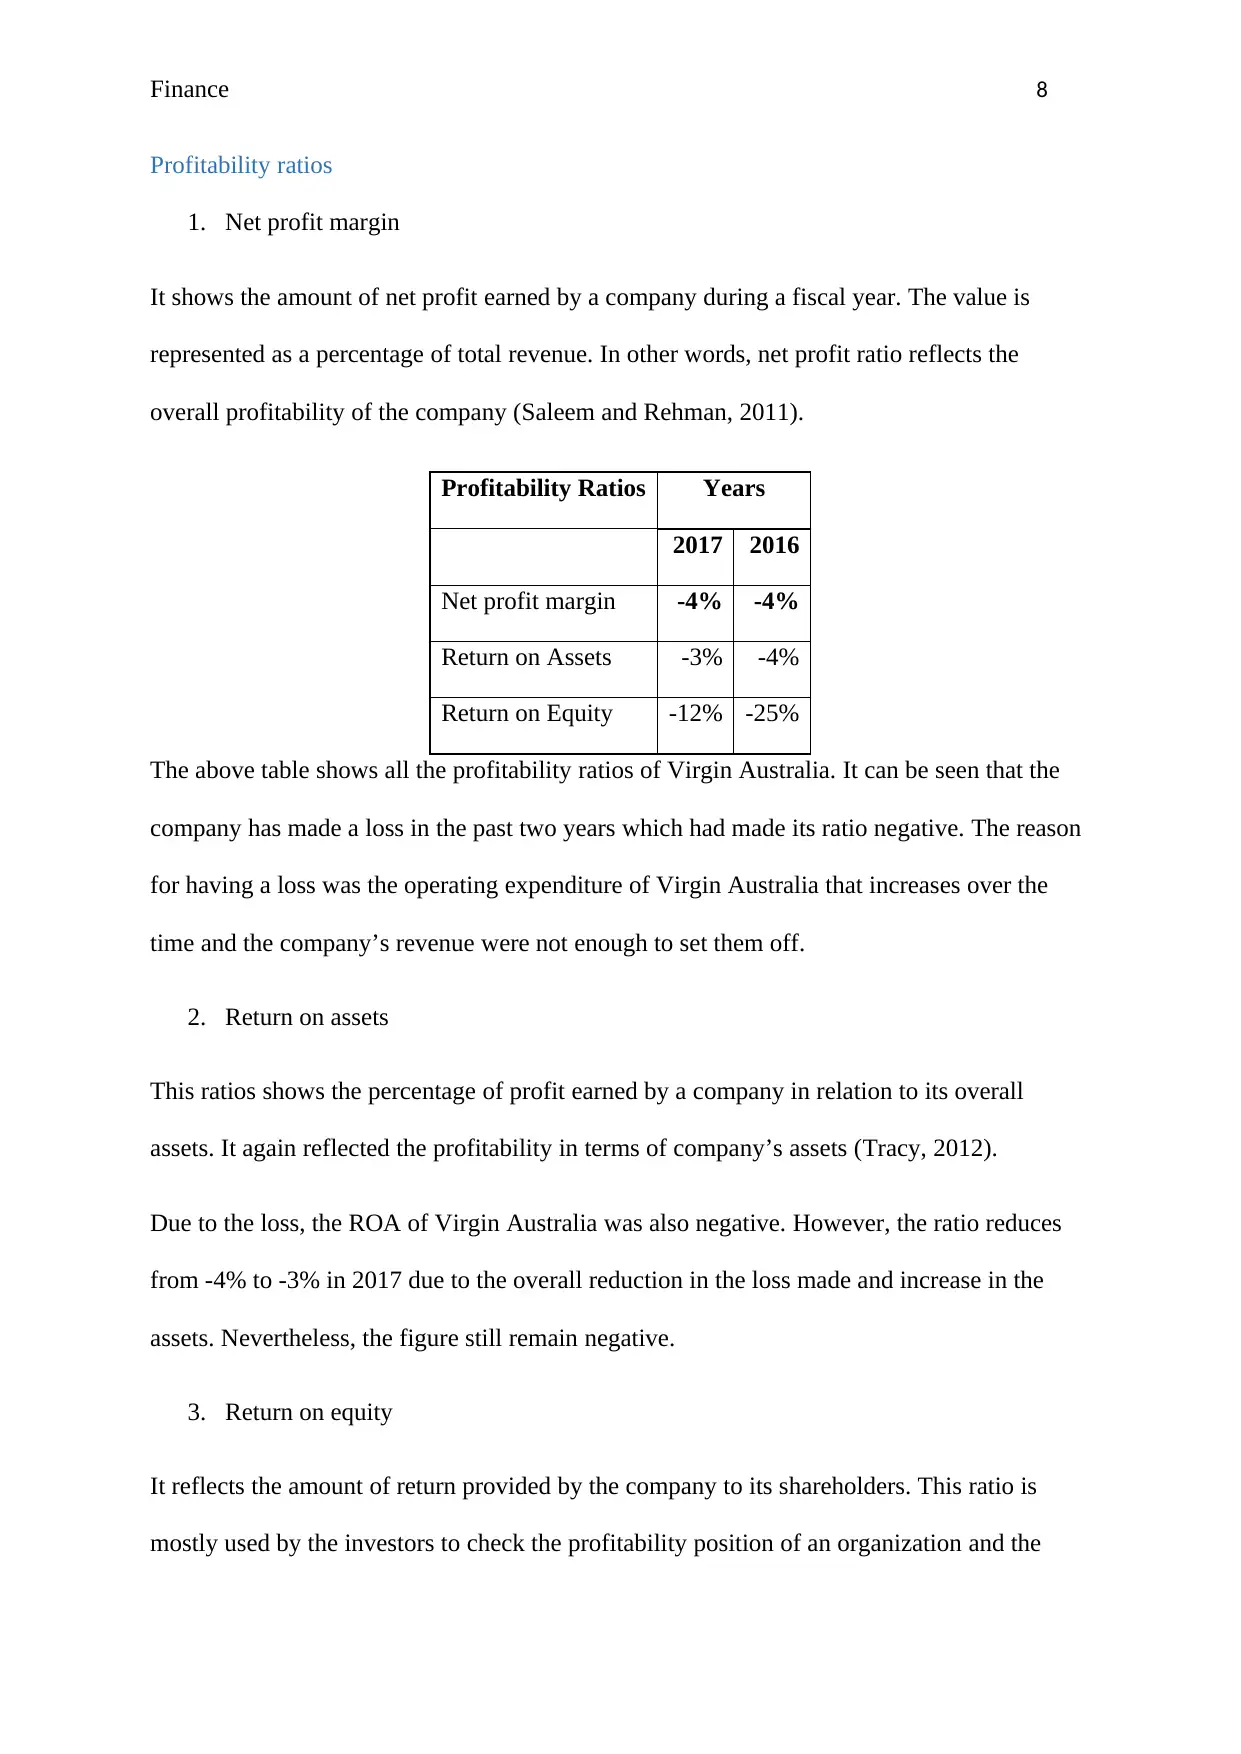
It shows the amount of net profit earned by a company during a fiscal year. The value is
represented as a percentage of total revenue. In other words, net profit ratio reflects the
overall profitability of the company (Saleem and Rehman, 2011).
Profitability Ratios Years
2017 2016
Net profit margin -4% -4%
Return on Assets -3% -4%
Return on Equity -12% -25%
The above table shows all the profitability ratios of Virgin Australia. It can be seen that the
company has made a loss in the past two years which had made its ratio negative. The reason
for having a loss was the operating expenditure of Virgin Australia that increases over the
time and the company’s revenue were not enough to set them off.
2. Return on assets
This ratios shows the percentage of profit earned by a company in relation to its overall
assets. It again reflected the profitability in terms of company’s assets (Tracy, 2012).
Due to the loss, the ROA of Virgin Australia was also negative. However, the ratio reduces
from -4% to -3% in 2017 due to the overall reduction in the loss made and increase in the
assets. Nevertheless, the figure still remain negative.
3. Return on equity
It reflects the amount of return provided by the company to its shareholders. This ratio is
mostly used by the investors to check the profitability position of an organization and the
Profitability ratios
1. Net profit margin
It shows the amount of net profit earned by a company during a fiscal year. The value is
represented as a percentage of total revenue. In other words, net profit ratio reflects the
overall profitability of the company (Saleem and Rehman, 2011).
Profitability Ratios Years
2017 2016
Net profit margin -4% -4%
Return on Assets -3% -4%
Return on Equity -12% -25%
The above table shows all the profitability ratios of Virgin Australia. It can be seen that the
company has made a loss in the past two years which had made its ratio negative. The reason
for having a loss was the operating expenditure of Virgin Australia that increases over the
time and the company’s revenue were not enough to set them off.
2. Return on assets
This ratios shows the percentage of profit earned by a company in relation to its overall
assets. It again reflected the profitability in terms of company’s assets (Tracy, 2012).
Due to the loss, the ROA of Virgin Australia was also negative. However, the ratio reduces
from -4% to -3% in 2017 due to the overall reduction in the loss made and increase in the
assets. Nevertheless, the figure still remain negative.
3. Return on equity
It reflects the amount of return provided by the company to its shareholders. This ratio is
mostly used by the investors to check the profitability position of an organization and the
⊘ This is a preview!⊘
Do you want full access?
Subscribe today to unlock all pages.
Trusted by 1+ million students worldwide
Finance 9
feasibility of their investment in that company. Generally, firms offering high returns are
more attractive than the ones which offers less return to its shareholders and investors (Bragg,
2012).
ROE of Virgin Australia was also in negative due to the loss incurred by the company.
However the ratio increases from -25% to -12% because of the sudden increase in the
shareholders’ equity.
Market value ratios
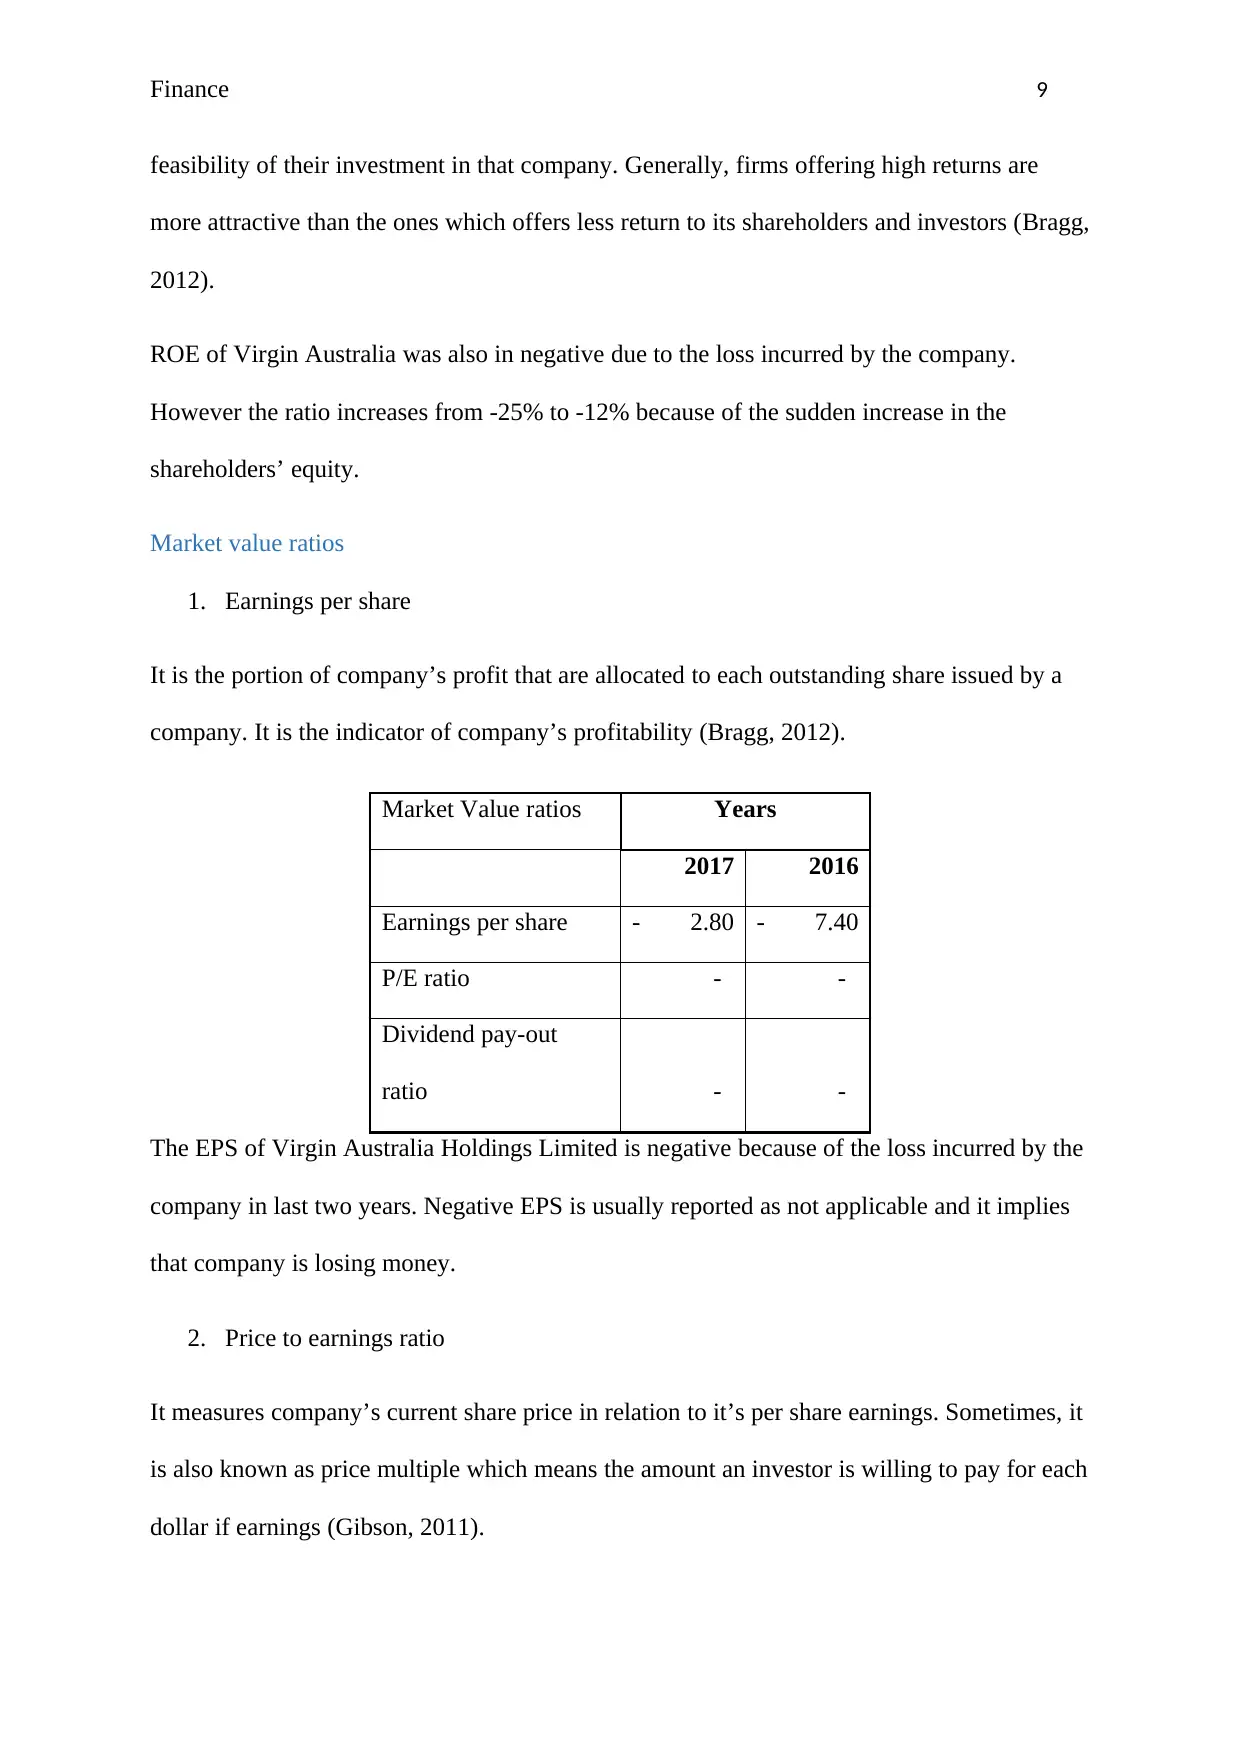
1. Earnings per share
It is the portion of company’s profit that are allocated to each outstanding share issued by a
company. It is the indicator of company’s profitability (Bragg, 2012).
Market Value ratios Years
2017 2016
Earnings per share - 2.80 - 7.40
P/E ratio - -
Dividend pay-out
ratio - -
The EPS of Virgin Australia Holdings Limited is negative because of the loss incurred by the
company in last two years. Negative EPS is usually reported as not applicable and it implies
that company is losing money.
2. Price to earnings ratio
It measures company’s current share price in relation to it’s per share earnings. Sometimes, it
is also known as price multiple which means the amount an investor is willing to pay for each
dollar if earnings (Gibson, 2011).
feasibility of their investment in that company. Generally, firms offering high returns are
more attractive than the ones which offers less return to its shareholders and investors (Bragg,
2012).
ROE of Virgin Australia was also in negative due to the loss incurred by the company.
However the ratio increases from -25% to -12% because of the sudden increase in the
shareholders’ equity.
Market value ratios
1. Earnings per share
It is the portion of company’s profit that are allocated to each outstanding share issued by a
company. It is the indicator of company’s profitability (Bragg, 2012).
Market Value ratios Years
2017 2016
Earnings per share - 2.80 - 7.40
P/E ratio - -
Dividend pay-out
ratio - -
The EPS of Virgin Australia Holdings Limited is negative because of the loss incurred by the
company in last two years. Negative EPS is usually reported as not applicable and it implies
that company is losing money.
2. Price to earnings ratio
It measures company’s current share price in relation to it’s per share earnings. Sometimes, it
is also known as price multiple which means the amount an investor is willing to pay for each
dollar if earnings (Gibson, 2011).
Paraphrase This Document
Need a fresh take? Get an instant paraphrase of this document with our AI Paraphraser
Finance 10
The P/E ratio of Virgin Australia is negative in last two years because of the negative EPS of
the company. It is reported as not applicable and it shows virgin is losing money per share of
its stock. Hence, the company is not much attractive to the investors.
3. Dividend payout ratio
It shows the amount of dividend paid by the company out of its total income. As it can be
seen from the table that the ratio is zero and also as per Virgin Australia’s annual reports, the
company has not declared any dividend from the past two years. Reason being, no profits and
weak profitability.
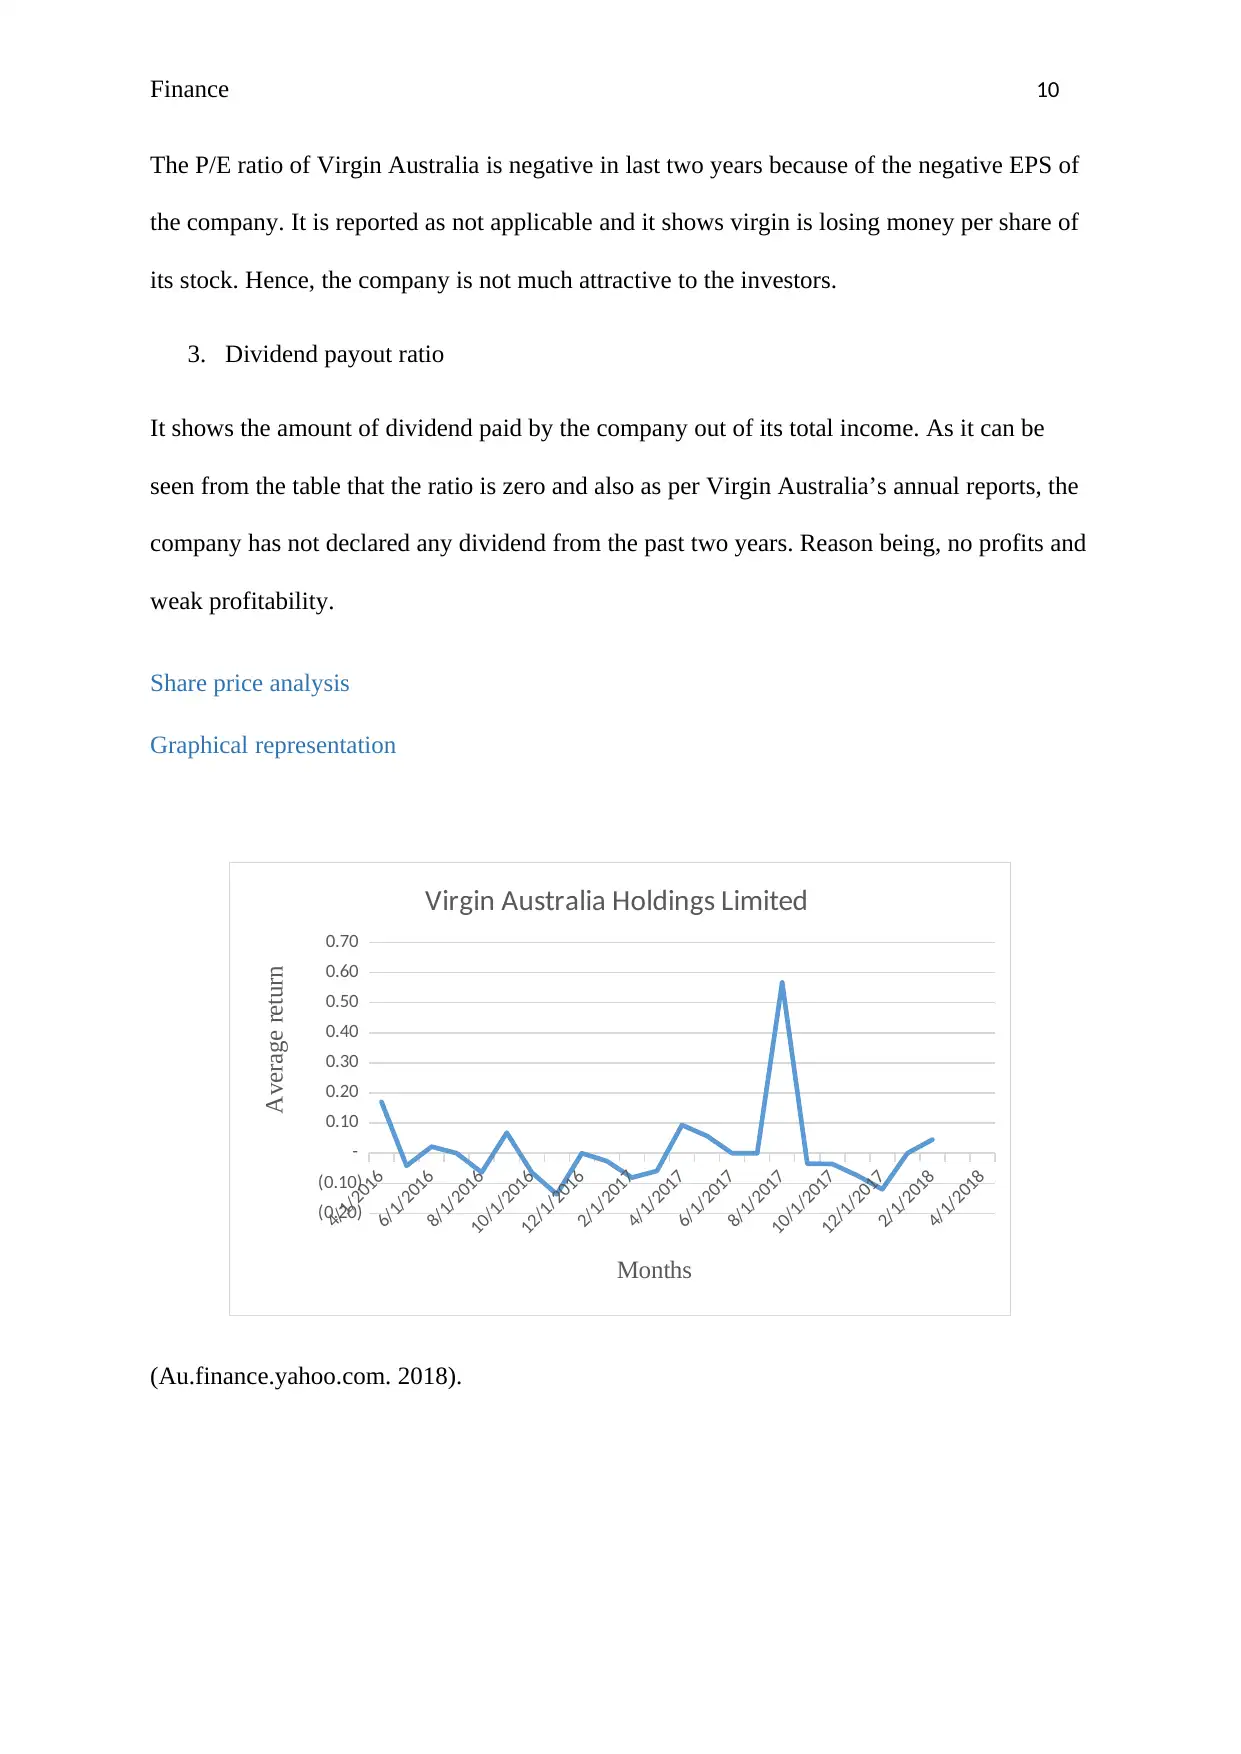
Share price analysis
Graphical representation
4/1/2016
6/1/2016
8/1/2016
10/1/2016
12/1/2016
2/1/2017
4/1/2017
6/1/2017
8/1/2017
10/1/2017
12/1/2017
2/1/2018
4/1/2018
(0.20)
(0.10)
-
0.10
0.20
0.30
0.40
0.50
0.60
0.70
Virgin Australia Holdings Limited
Months
Average return
(Au.finance.yahoo.com. 2018).
The P/E ratio of Virgin Australia is negative in last two years because of the negative EPS of
the company. It is reported as not applicable and it shows virgin is losing money per share of
its stock. Hence, the company is not much attractive to the investors.
3. Dividend payout ratio
It shows the amount of dividend paid by the company out of its total income. As it can be
seen from the table that the ratio is zero and also as per Virgin Australia’s annual reports, the
company has not declared any dividend from the past two years. Reason being, no profits and
weak profitability.
Share price analysis
Graphical representation
4/1/2016
6/1/2016
8/1/2016
10/1/2016
12/1/2016
2/1/2017
4/1/2017
6/1/2017
8/1/2017
10/1/2017
12/1/2017
2/1/2018
4/1/2018
(0.20)
(0.10)
-
0.10
0.20
0.30
0.40
0.50
0.60
0.70
Virgin Australia Holdings Limited
Months
Average return
(Au.finance.yahoo.com. 2018).
Finance 11
4/1/2016
6/1/2016
8/1/2016
10/1/2016
12/1/2016
2/1/2017
4/1/2017
6/1/2017
8/1/2017
10/1/2017
12/1/2017
2/1/2018
4/1/2018
(0.06)
(0.04)
(0.02)
-
0.02
0.04
0.06
0.08
All Ordinaries Index
Months
Average return
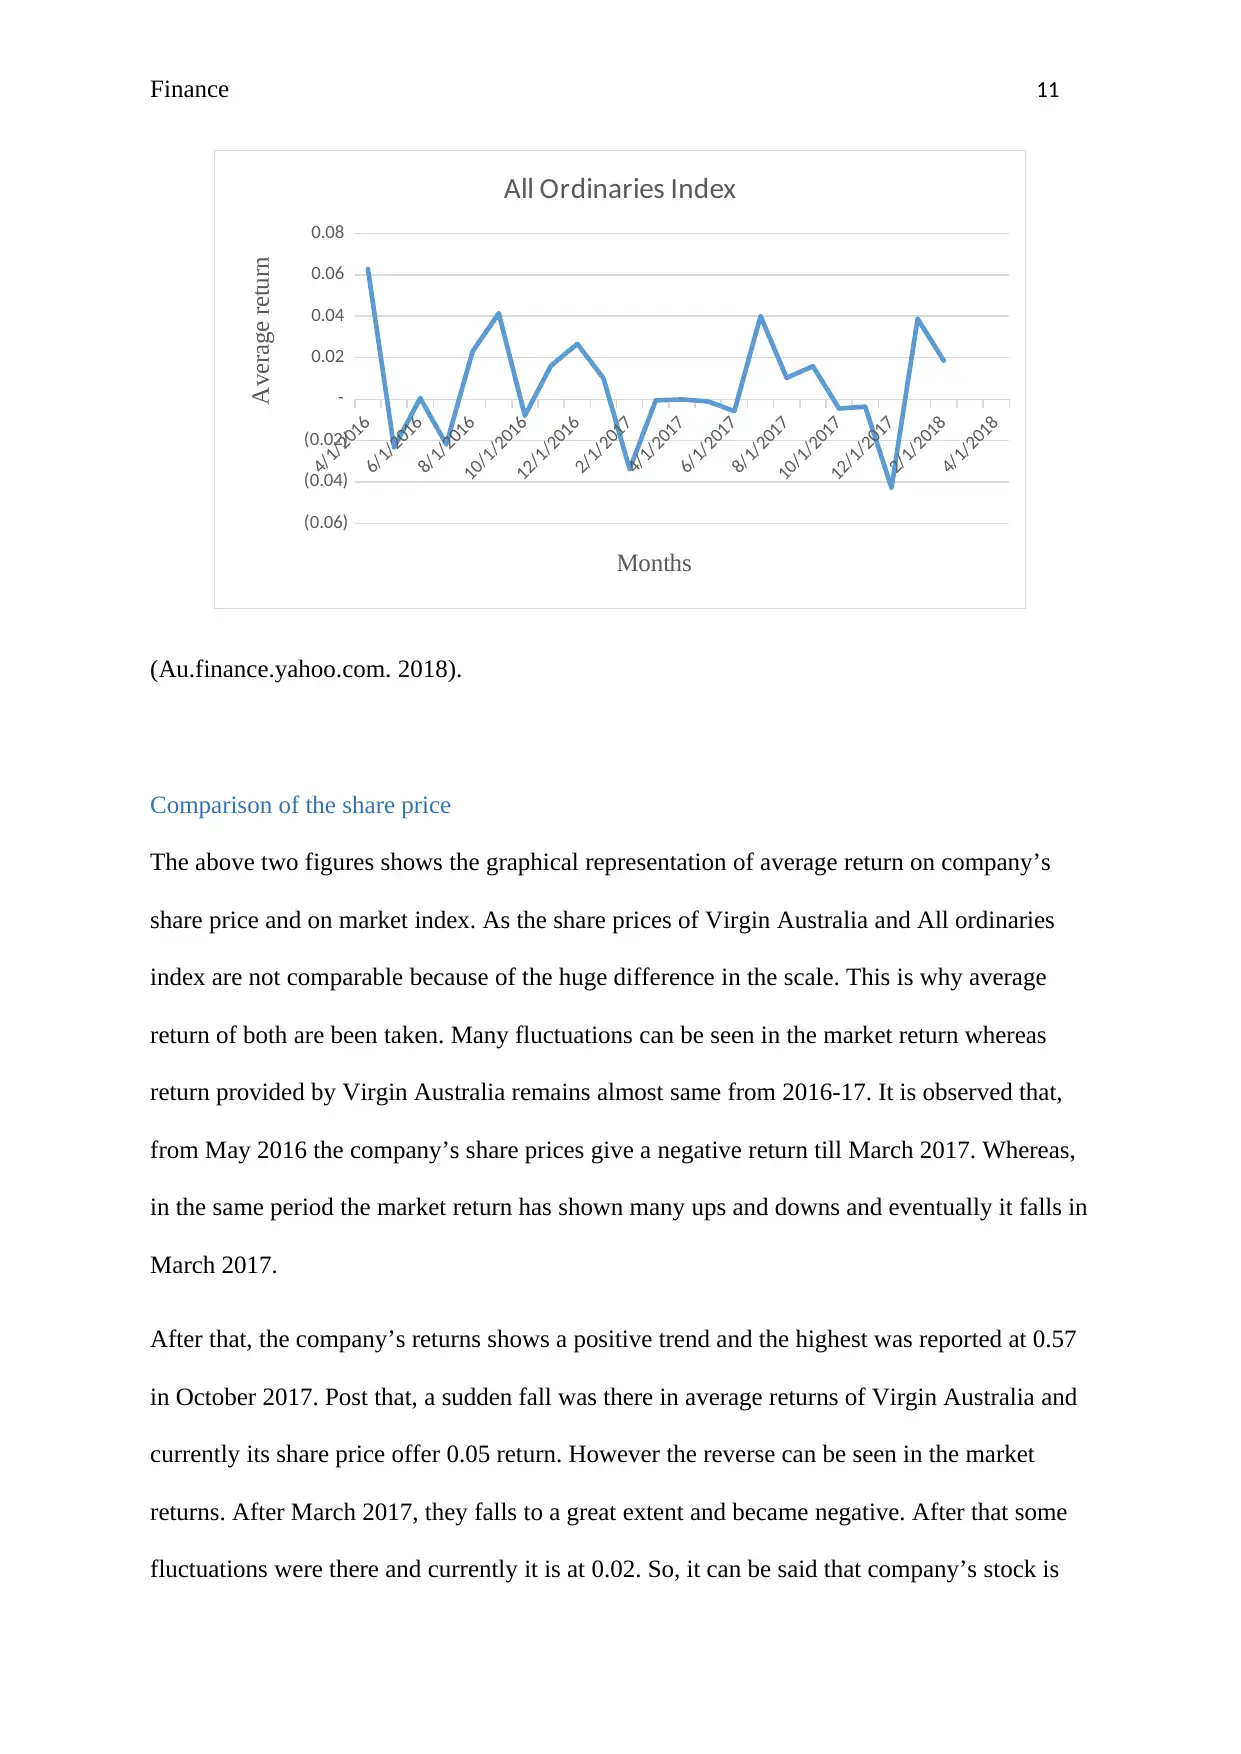
(Au.finance.yahoo.com. 2018).
Comparison of the share price
The above two figures shows the graphical representation of average return on company’s
share price and on market index. As the share prices of Virgin Australia and All ordinaries
index are not comparable because of the huge difference in the scale. This is why average
return of both are been taken. Many fluctuations can be seen in the market return whereas
return provided by Virgin Australia remains almost same from 2016-17. It is observed that,
from May 2016 the company’s share prices give a negative return till March 2017. Whereas,
in the same period the market return has shown many ups and downs and eventually it falls in
March 2017.
After that, the company’s returns shows a positive trend and the highest was reported at 0.57
in October 2017. Post that, a sudden fall was there in average returns of Virgin Australia and
currently its share price offer 0.05 return. However the reverse can be seen in the market
returns. After March 2017, they falls to a great extent and became negative. After that some
fluctuations were there and currently it is at 0.02. So, it can be said that company’s stock is
4/1/2016
6/1/2016
8/1/2016
10/1/2016
12/1/2016
2/1/2017
4/1/2017
6/1/2017
8/1/2017
10/1/2017
12/1/2017
2/1/2018
4/1/2018
(0.06)
(0.04)
(0.02)
-
0.02
0.04
0.06
0.08
All Ordinaries Index
Months
Average return
(Au.finance.yahoo.com. 2018).
Comparison of the share price
The above two figures shows the graphical representation of average return on company’s
share price and on market index. As the share prices of Virgin Australia and All ordinaries
index are not comparable because of the huge difference in the scale. This is why average
return of both are been taken. Many fluctuations can be seen in the market return whereas
return provided by Virgin Australia remains almost same from 2016-17. It is observed that,
from May 2016 the company’s share prices give a negative return till March 2017. Whereas,
in the same period the market return has shown many ups and downs and eventually it falls in
March 2017.
After that, the company’s returns shows a positive trend and the highest was reported at 0.57
in October 2017. Post that, a sudden fall was there in average returns of Virgin Australia and
currently its share price offer 0.05 return. However the reverse can be seen in the market
returns. After March 2017, they falls to a great extent and became negative. After that some
fluctuations were there and currently it is at 0.02. So, it can be said that company’s stock is
⊘ This is a preview!⊘
Do you want full access?
Subscribe today to unlock all pages.
Trusted by 1+ million students worldwide
1 out of 18
Related Documents


Your All-in-One AI-Powered Toolkit for Academic Success.
+13062052269
info@desklib.com
Available 24*7 on WhatsApp / Email
![[object Object]](/_next/static/media/star-bottom.7253800d.svg)
Unlock your academic potential
Copyright © 2020–2026 A2Z Services. All Rights Reserved. Developed and managed by ZUCOL.