Comprehensive Financial Analysis Report: Vodafone's Performance
VerifiedAdded on  2019/12/03
|8
|2345
|274
Report
AI Summary
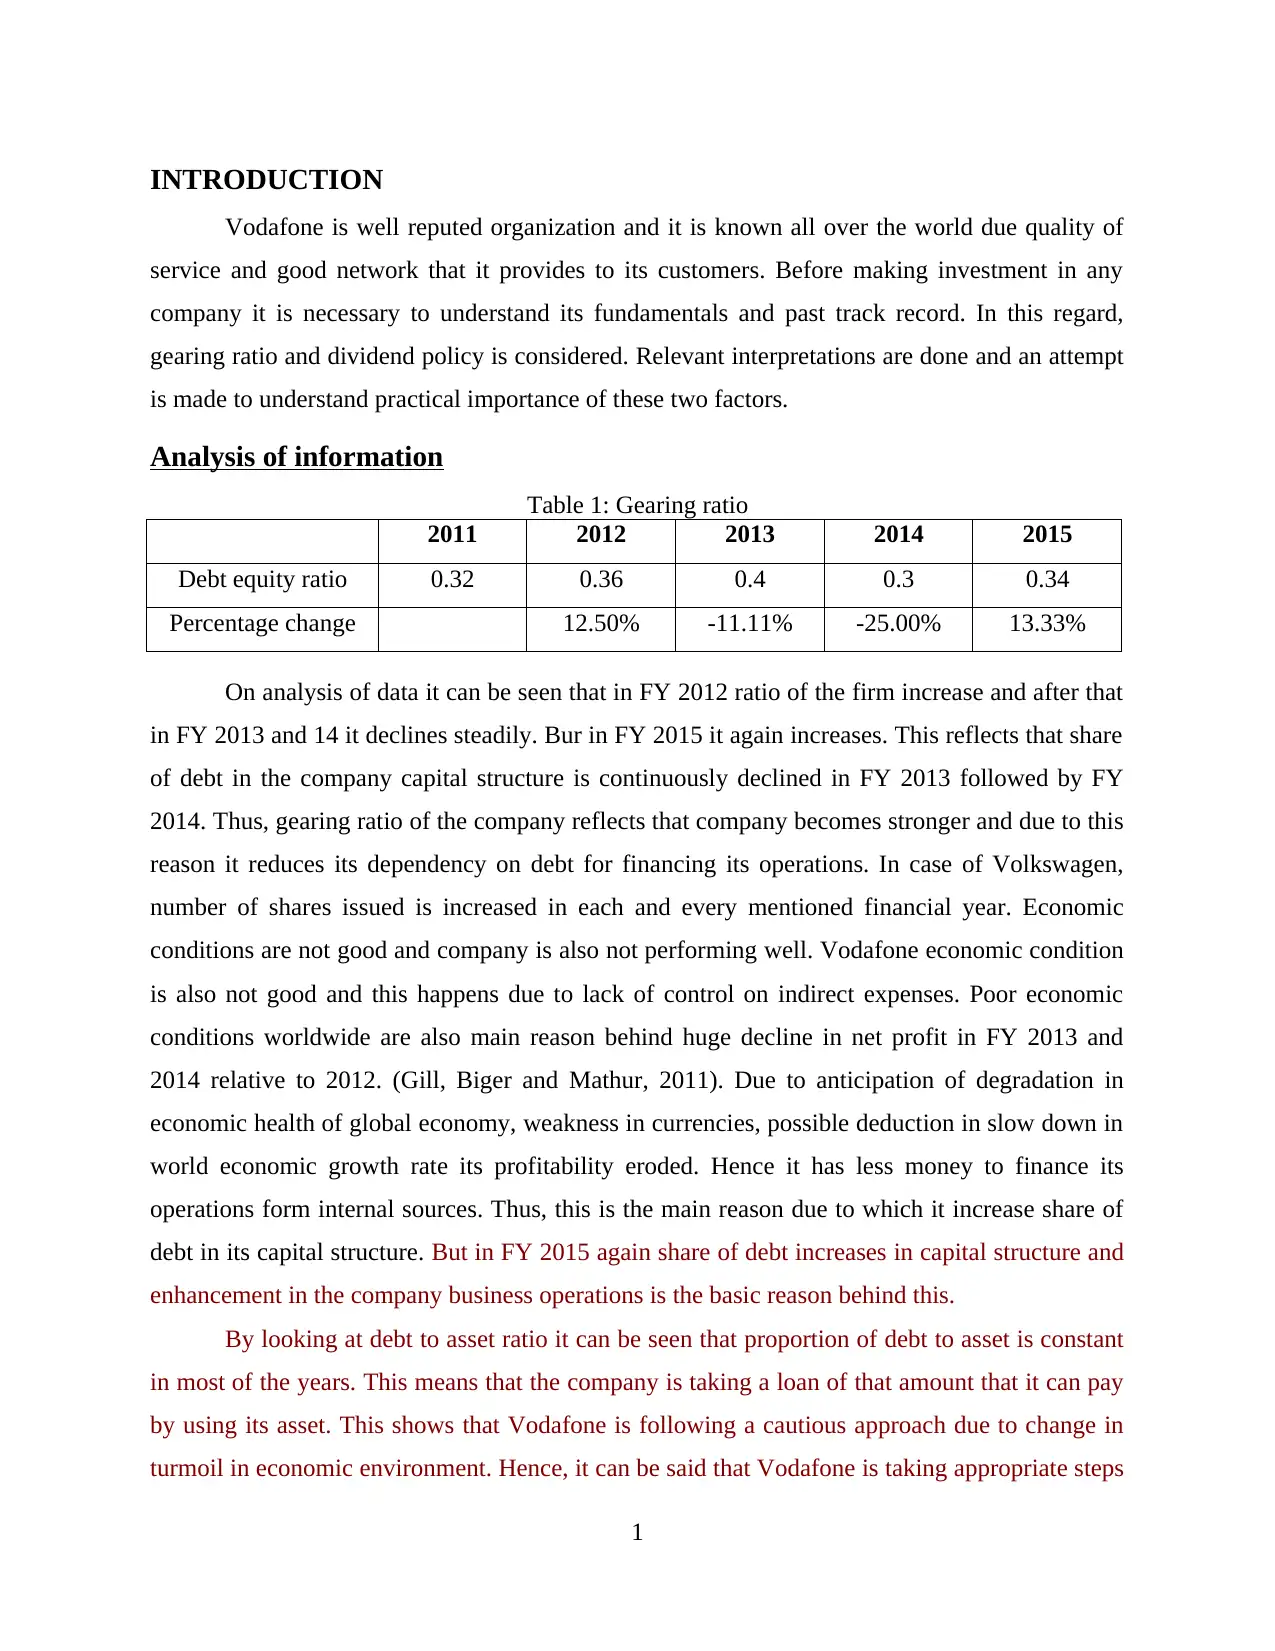
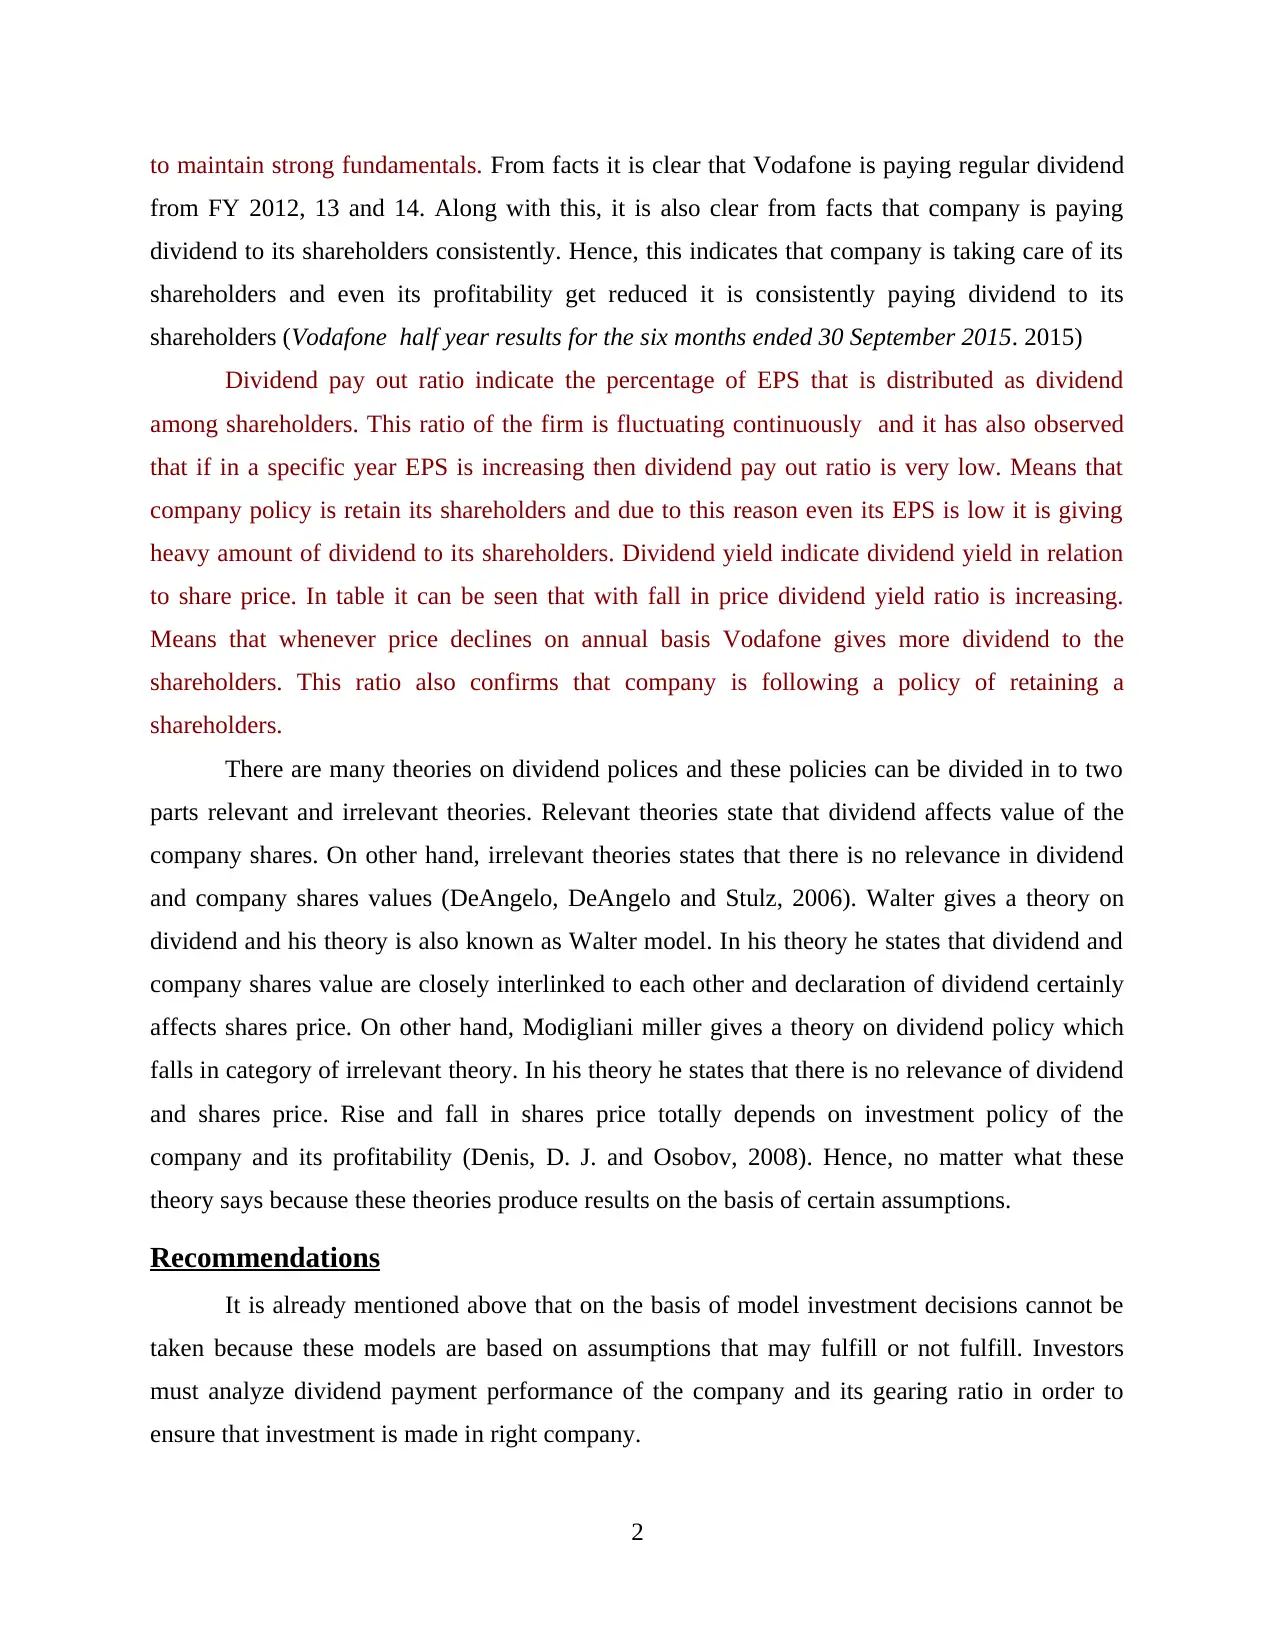
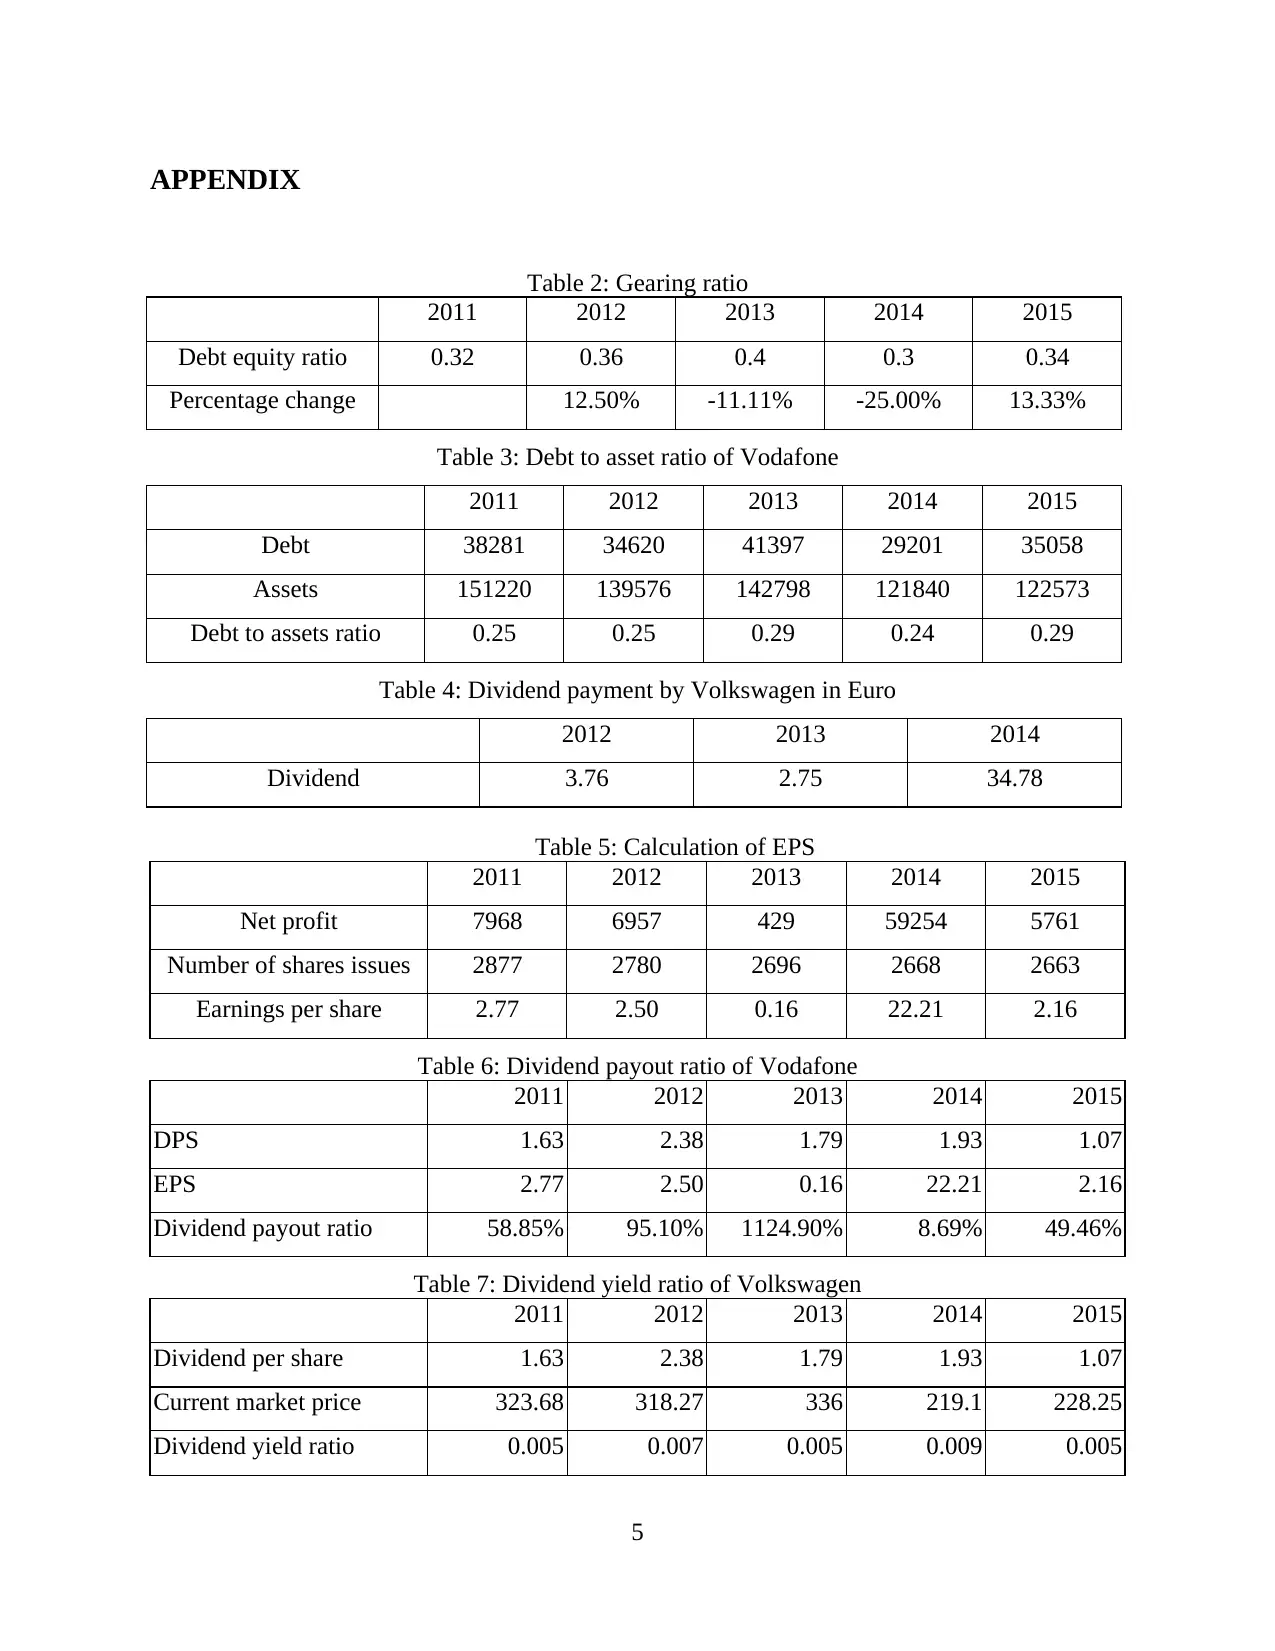
This report provides a comprehensive financial analysis of Vodafone, examining its gearing ratio, debt-to-asset ratio, and dividend policy from 2011 to 2015. The analysis includes the calculation of EPS, dividend payout ratio, and dividend yield ratio. The report also discusses the impact of economic conditions on Vodafone's performance, including the company's response to global economic downturns and changes in its capital structure. It delves into the relevance of dividend policies, discussing theories like Walter's model and Modigliani-Miller's theory. The reflective section highlights the learning experience gained through lectures and seminars, emphasizing the application of ratio analysis techniques and financial modeling. The report concludes with recommendations for investors, emphasizing the importance of considering company fundamentals and financial ratios when making investment decisions. The appendix includes tables with financial data for Vodafone and Volkswagen, supporting the analysis of key financial metrics.

FINANCIAL MANAGEMENT
Paraphrase This Document
Need a fresh take? Get an instant paraphrase of this document with our AI Paraphraser

TABLE OF CONTENTS
INTRODUCTION...........................................................................................................................1
Analysis of information...................................................................................................................1
Recommendations............................................................................................................................4
CONCLUSION................................................................................................................................4
REFERENCES................................................................................................................................5
INDEX OF TABLES
Table 1: Gearing ratio......................................................................................................................1
Table 2: Debt to asset ratio of Vodafone.........................................................................................1
Table 3: Dividend payment by Volkswagen in Euro.......................................................................3
Table 4: Calculation of EPS............................................................................................................4
Table 5: Dividend payout ratio of Vodafone...................................................................................4
Table 6: Dividend yield ratio of Volkswagen..................................................................................4

INTRODUCTION
Vodafone is well reputed organization and it is known all over the world due quality of
service and good network that it provides to its customers. Before making investment in any
company it is necessary to understand its fundamentals and past track record. In this regard,
gearing ratio and dividend policy is considered. Relevant interpretations are done and an attempt
is made to understand practical importance of these two factors.
Analysis of information
Table 1: Gearing ratio
2011 2012 2013 2014 2015
Debt equity ratio 0.32 0.36 0.4 0.3 0.34
Percentage change 12.50% -11.11% -25.00% 13.33%
On analysis of data it can be seen that in FY 2012 ratio of the firm increase and after that
in FY 2013 and 14 it declines steadily. Bur in FY 2015 it again increases. This reflects that share
of debt in the company capital structure is continuously declined in FY 2013 followed by FY
2014. Thus, gearing ratio of the company reflects that company becomes stronger and due to this
reason it reduces its dependency on debt for financing its operations. In case of Volkswagen,
number of shares issued is increased in each and every mentioned financial year. Economic
conditions are not good and company is also not performing well. Vodafone economic condition
is also not good and this happens due to lack of control on indirect expenses. Poor economic
conditions worldwide are also main reason behind huge decline in net profit in FY 2013 and
2014 relative to 2012. (Gill, Biger and Mathur, 2011). Due to anticipation of degradation in
economic health of global economy, weakness in currencies, possible deduction in slow down in
world economic growth rate its profitability eroded. Hence it has less money to finance its
operations form internal sources. Thus, this is the main reason due to which it increase share of
debt in its capital structure. But in FY 2015 again share of debt increases in capital structure and
enhancement in the company business operations is the basic reason behind this.
By looking at debt to asset ratio it can be seen that proportion of debt to asset is constant
in most of the years. This means that the company is taking a loan of that amount that it can pay
by using its asset. This shows that Vodafone is following a cautious approach due to change in
turmoil in economic environment. Hence, it can be said that Vodafone is taking appropriate steps
1
⊘ This is a preview!⊘
Do you want full access?
Subscribe today to unlock all pages.

Trusted by 1+ million students worldwide

to maintain strong fundamentals. From facts it is clear that Vodafone is paying regular dividend
from FY 2012, 13 and 14. Along with this, it is also clear from facts that company is paying
dividend to its shareholders consistently. Hence, this indicates that company is taking care of its
shareholders and even its profitability get reduced it is consistently paying dividend to its
shareholders (Vodafone half year results for the six months ended 30 September 2015. 2015)
Dividend pay out ratio indicate the percentage of EPS that is distributed as dividend
among shareholders. This ratio of the firm is fluctuating continuously and it has also observed
that if in a specific year EPS is increasing then dividend pay out ratio is very low. Means that
company policy is retain its shareholders and due to this reason even its EPS is low it is giving
heavy amount of dividend to its shareholders. Dividend yield indicate dividend yield in relation
to share price. In table it can be seen that with fall in price dividend yield ratio is increasing.
Means that whenever price declines on annual basis Vodafone gives more dividend to the
shareholders. This ratio also confirms that company is following a policy of retaining a
shareholders.
There are many theories on dividend polices and these policies can be divided in to two
parts relevant and irrelevant theories. Relevant theories state that dividend affects value of the
company shares. On other hand, irrelevant theories states that there is no relevance in dividend
and company shares values (DeAngelo, DeAngelo and Stulz, 2006). Walter gives a theory on
dividend and his theory is also known as Walter model. In his theory he states that dividend and
company shares value are closely interlinked to each other and declaration of dividend certainly
affects shares price. On other hand, Modigliani miller gives a theory on dividend policy which
falls in category of irrelevant theory. In his theory he states that there is no relevance of dividend
and shares price. Rise and fall in shares price totally depends on investment policy of the
company and its profitability (Denis, D. J. and Osobov, 2008). Hence, no matter what these
theory says because these theories produce results on the basis of certain assumptions.
Recommendations
It is already mentioned above that on the basis of model investment decisions cannot be
taken because these models are based on assumptions that may fulfill or not fulfill. Investors
must analyze dividend payment performance of the company and its gearing ratio in order to
ensure that investment is made in right company.
2
Paraphrase This Document
Need a fresh take? Get an instant paraphrase of this document with our AI Paraphraser

Reflective
From this report I learn lots of things. In this report I apply ratio analysis techniques and
also analyze tends in dividend policy of the firm. On analysis of figures I make an attempt to
identify the reasons due to which firm debt equity ratio fluctuate. Along with this I also try to
understand the reasons due to which firm debt to assets ratio keeps on changing consistently. In
this regard I go through firm annual report and analyze business environment. Reading of annual
report helps me in identifying the situations that firm face in its business and that scenario
positive and negative impact on the business. This helps me in identifying possible reasons due o
which firm debt to equity ratio and debt to asset ratio keeps on fluctuating consistently. So, it can
be said that this helps me in doing perfect analysis of the company financial statements.
My experience of lecture and seminar was good and in these sessions I learn a lot about
applications of ratio analysis techniques in the business financial statements. In seminar a case
study was taught to us in which entire firm was analyzed using several techniques. This analysis
was critical and estimations about up and down in these figures were also made in the seminar.
Through this seminar I came to know about the way in which reasons for fluctuation of specific
variable price is identified by the analysts. Previously, I found a lot of difficulty in interpreting
results of ratio analysis. But after going through lectures and seminars my broad understanding
about these techniques and interpretation of their results gets developed. Hence, it can be said
that my skills get developed in respect to company analysis on the basis of certain parameters
like debt to equity and debt to asset ratio. In seminar all things were teach by the lecturer step by
step and this helps us in improving our skills related to financial statement analysis. Moreover,
through lectures I also came to know about the ways in which excel can be utilized in a best way
to analyze company financial statements. So, it can be said that seminars help in improving my
analytic skills. Through lectures I came to know about importance of these techniques in
handling company finance operations. Through lectures I came to know that on the basis of
current facts estimation about future can be made. In this regard financial modeling techniques
are used by the finance experts. In lecture I learn that by using old ratios estimation is made
regarding probable values of the ratios for the next year. By using estimated ratio value estimated
balance sheet for the firm is prepared by the finance analyst. After that various values are used to
analyze company performance.
3

All these things certainly help me in improving my knowledge base. After going through
lectures and seminars I learn lots of things. After going through these things now I am able to
analyze any company performance on the basis of some facts. Moreover, now I am able to apply
financial modeling technique on the company performance. So, now I am not only able to
analyze any company but also can make projections about those firm ratios. Hence, it can be said
that may ability to apply practically the financial management techniques gets develop and I can
solve tricky problems related to financial management.
CONCLUSION
On the basis of above discussion it is concluded that an investor must not make
investment merely on the basis of chart patterns. They must look after company fundamentals in
order to make sure that company is financially sound. In respect to this, investors can use gearing
ratio. By using this ratio, company capital structure can be assessed and lots of information can
be gathered about its performance. Apart from this, value of this ratio also indicates company
policy to run its business. Like in above discussion it is made clear that company is following a
cautious approach on the basis of consistent decline in ratio performance. Dividend policy plays
a very important role in retaining shareholders in a company. In other words, it can also be said
that this policy helps in preventing sell off shares of the company in secondary market. Hence, it
is strongly said that dividend policy must be crafted smartly.
4
⊘ This is a preview!⊘
Do you want full access?
Subscribe today to unlock all pages.

Trusted by 1+ million students worldwide

APPENDIX
Table 2: Gearing ratio
2011 2012 2013 2014 2015
Debt equity ratio 0.32 0.36 0.4 0.3 0.34
Percentage change 12.50% -11.11% -25.00% 13.33%
Table 3: Debt to asset ratio of Vodafone
2011 2012 2013 2014 2015
Debt 38281 34620 41397 29201 35058
Assets 151220 139576 142798 121840 122573
Debt to assets ratio 0.25 0.25 0.29 0.24 0.29
Table 4: Dividend payment by Volkswagen in Euro
2012 2013 2014
Dividend 3.76 2.75 34.78
Table 5: Calculation of EPS
2011 2012 2013 2014 2015
Net profit 7968 6957 429 59254 5761
Number of shares issues 2877 2780 2696 2668 2663
Earnings per share 2.77 2.50 0.16 22.21 2.16
Table 6: Dividend payout ratio of Vodafone
2011 2012 2013 2014 2015
DPS 1.63 2.38 1.79 1.93 1.07
EPS 2.77 2.50 0.16 22.21 2.16
Dividend payout ratio 58.85% 95.10% 1124.90% 8.69% 49.46%
Table 7: Dividend yield ratio of Volkswagen
2011 2012 2013 2014 2015
Dividend per share 1.63 2.38 1.79 1.93 1.07
Current market price 323.68 318.27 336 219.1 228.25
Dividend yield ratio 0.005 0.007 0.005 0.009 0.005
5
Paraphrase This Document
Need a fresh take? Get an instant paraphrase of this document with our AI Paraphraser

6
1 out of 8
Related Documents
Your All-in-One AI-Powered Toolkit for Academic Success.
 +13062052269
info@desklib.com
Available 24*7 on WhatsApp / Email
Unlock your academic potential
Copyright © 2020–2025 A2Z Services. All Rights Reserved. Developed and managed by ZUCOL.


