Financial Management Report: Vodafone Plc vs. BT Group Plc Analysis
VerifiedAdded on 2023/01/24
|25
|4029
|59
Report
AI Summary
This report provides a comprehensive financial analysis of Vodafone Plc and BT Group Plc, two major players in the UK telecommunications sector. The analysis includes a detailed comparison of their financial performance over a five-year period, focusing on key ratios such as liquidity, profitability, efficiency, and capital structure. The report examines current and quick ratios for liquidity, net margin and ROCE for profitability, inventory, receivables, and payables turnover for efficiency, and debt/equity and interest cover ratios for capital structure. The findings indicate that BT Group Plc has demonstrated better financial performance overall, leading to a recommendation for investors to consider investing in BT Group shares. However, the analysis also acknowledges limitations, such as the reliance on historical data and potential future performance declines, and the report suggests that investors consider these aspects before making investment decisions.

Running head: FINANCIAL MANAGEMENT
Financial Management
Name of the Student:
Name of the University:
Author’s Note:
Course ID:
Financial Management
Name of the Student:
Name of the University:
Author’s Note:
Course ID:
Paraphrase This Document
Need a fresh take? Get an instant paraphrase of this document with our AI Paraphraser
1FINANCIAL MANAGEMENT
Executive Summary:
For the current report, the organisation chosen is Vodafone Plc and its major competitor, BT
Group Plc operating in the UK telecommunication and utilities sector. From the conducted
analysis, it is apparent that BT Group Plc is in a better position than Vodafone Plc in the UK
telecommunications sector owing to better financial performance in the past five years. In
addition, by considering stock market performance, the investors are recommended to invest in
the shares of BT Group for maximising their return on investment. However, the analysis is
subject to certain limitations, since it has considered historical data only for decision-making.
Therefore, research reports and price/earnings ratio have been taken into consideration, which
reveal that the performance of BT Group is expected to decline in the upcoming years, especially
in terms of earnings per share and dividend payments. Hence, the investors need to consider
these aspects as well before investing in the shares of BT Group Plc.
2FINANCIAL MANAGEMENT
Table of Contents
Introduction:....................................................................................................................................3
Comparison and analysis of the financial performance of Vodafone Plc and its competitor, BT
Group Plc:........................................................................................................................................4
Recommendations regarding buying shares in any of the two organisations:...............................15
Problems, limitations and assumptions:........................................................................................15
Conclusion:....................................................................................................................................16
References and Bibliographies:.....................................................................................................18
Appendices:...................................................................................................................................21
⊘ This is a preview!⊘
Do you want full access?
Subscribe today to unlock all pages.
Trusted by 1+ million students worldwide
3FINANCIAL MANAGEMENT
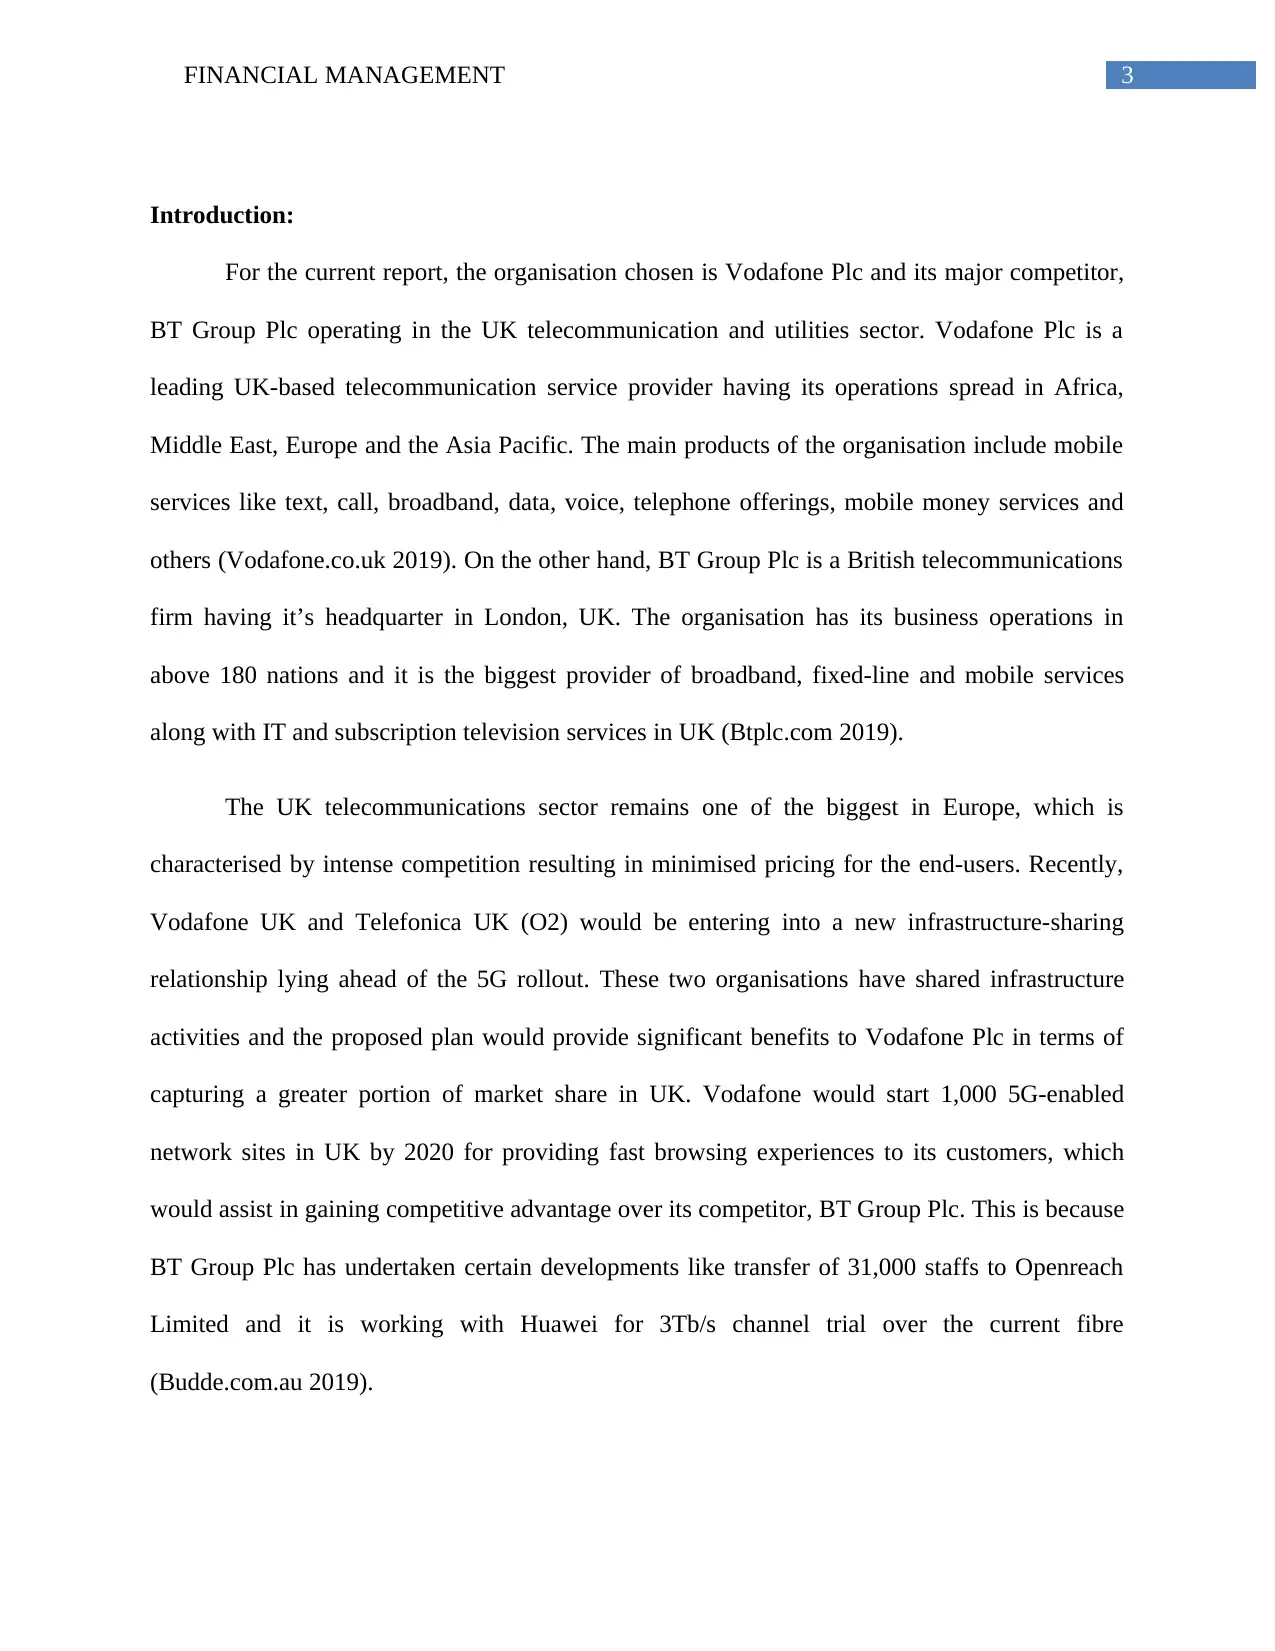
Introduction:
For the current report, the organisation chosen is Vodafone Plc and its major competitor,
BT Group Plc operating in the UK telecommunication and utilities sector. Vodafone Plc is a
leading UK-based telecommunication service provider having its operations spread in Africa,
Middle East, Europe and the Asia Pacific. The main products of the organisation include mobile
services like text, call, broadband, data, voice, telephone offerings, mobile money services and
others (Vodafone.co.uk 2019). On the other hand, BT Group Plc is a British telecommunications
firm having it’s headquarter in London, UK. The organisation has its business operations in
above 180 nations and it is the biggest provider of broadband, fixed-line and mobile services
along with IT and subscription television services in UK (Btplc.com 2019).
The UK telecommunications sector remains one of the biggest in Europe, which is
characterised by intense competition resulting in minimised pricing for the end-users. Recently,
Vodafone UK and Telefonica UK (O2) would be entering into a new infrastructure-sharing
relationship lying ahead of the 5G rollout. These two organisations have shared infrastructure
activities and the proposed plan would provide significant benefits to Vodafone Plc in terms of
capturing a greater portion of market share in UK. Vodafone would start 1,000 5G-enabled
network sites in UK by 2020 for providing fast browsing experiences to its customers, which
would assist in gaining competitive advantage over its competitor, BT Group Plc. This is because
BT Group Plc has undertaken certain developments like transfer of 31,000 staffs to Openreach
Limited and it is working with Huawei for 3Tb/s channel trial over the current fibre
(Budde.com.au 2019).
Paraphrase This Document
Need a fresh take? Get an instant paraphrase of this document with our AI Paraphraser
4FINANCIAL MANAGEMENT
Comparison and analysis of the financial performance of Vodafone Plc and its competitor,
BT Group Plc:
For conducting the financial analysis of Vodafone Plc and BT Group Plc, certain ratios
have been taken into consideration and their detailed analysis is presented as follows:
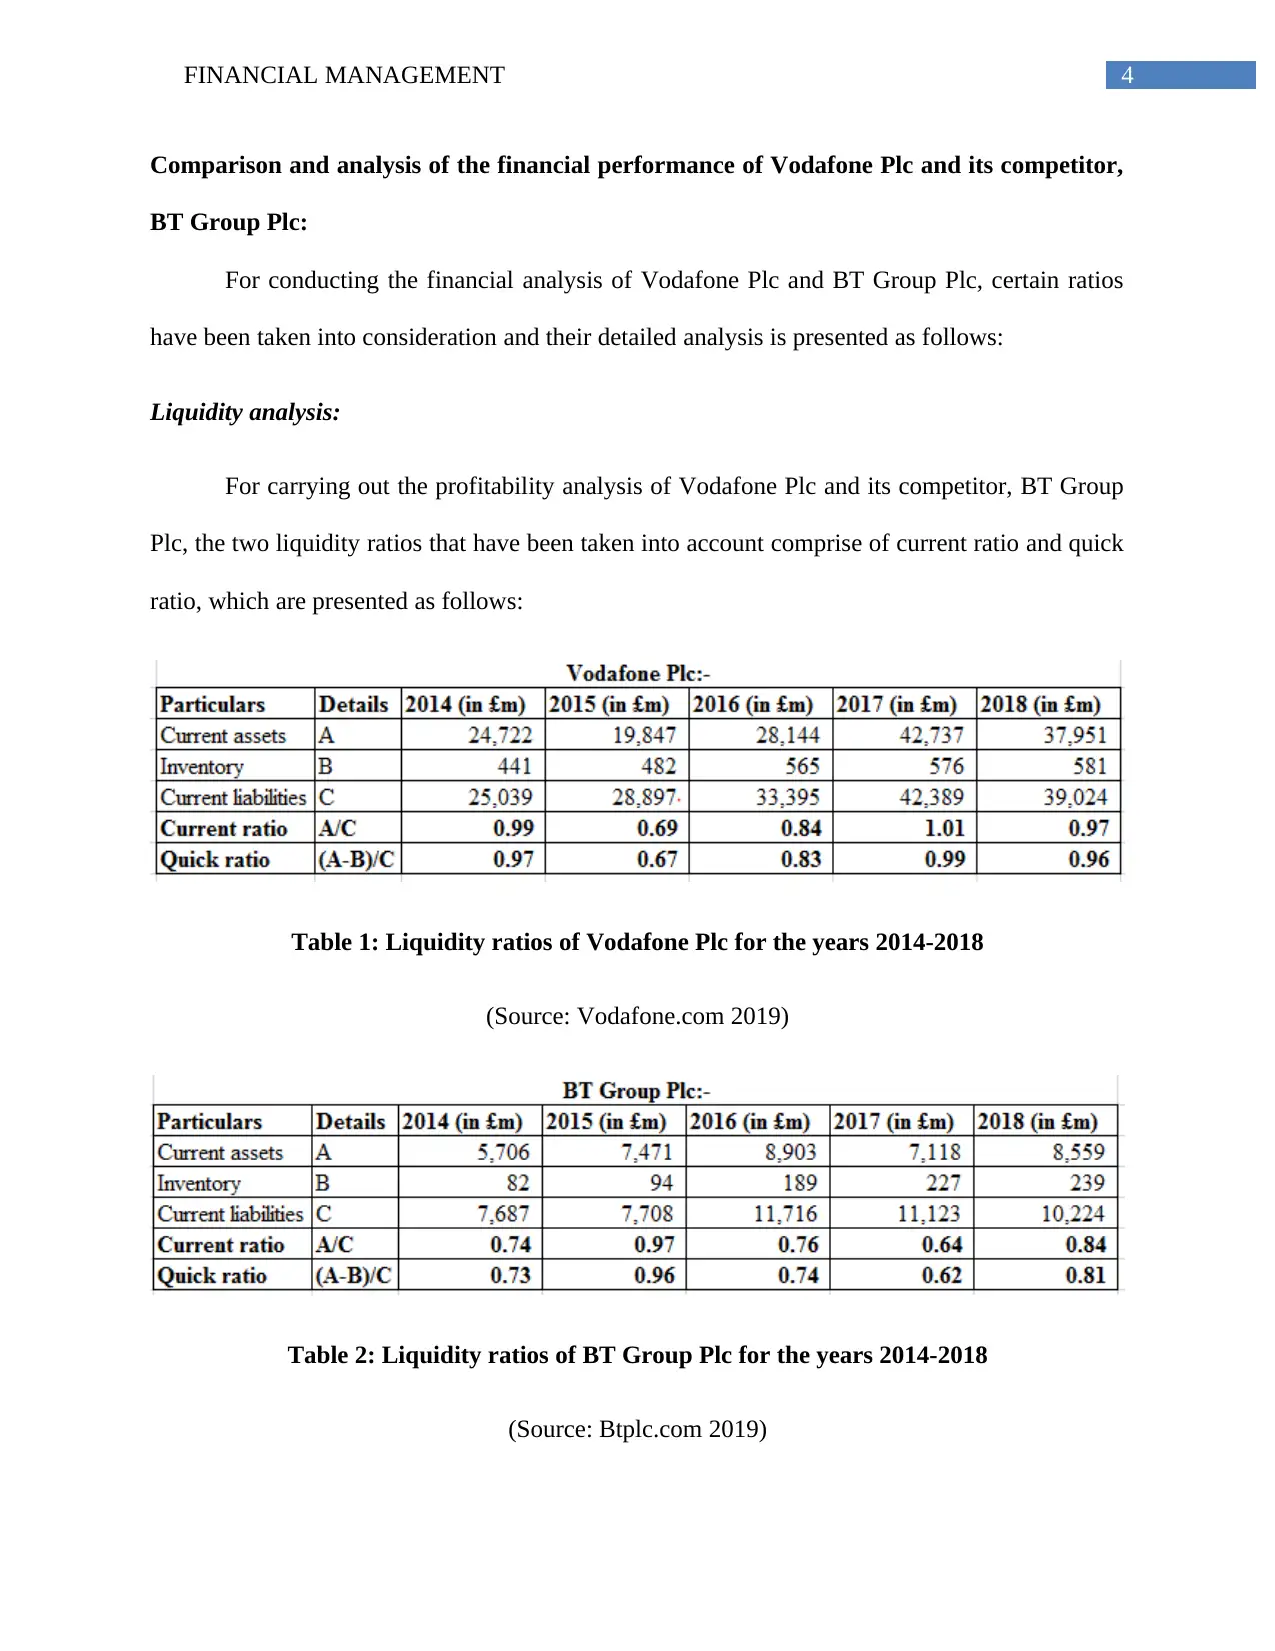
Liquidity analysis:
For carrying out the profitability analysis of Vodafone Plc and its competitor, BT Group
Plc, the two liquidity ratios that have been taken into account comprise of current ratio and quick
ratio, which are presented as follows:
Table 1: Liquidity ratios of Vodafone Plc for the years 2014-2018
(Source: Vodafone.com 2019)
Table 2: Liquidity ratios of BT Group Plc for the years 2014-2018
(Source: Btplc.com 2019)
Comparison and analysis of the financial performance of Vodafone Plc and its competitor,
BT Group Plc:
For conducting the financial analysis of Vodafone Plc and BT Group Plc, certain ratios
have been taken into consideration and their detailed analysis is presented as follows:
Liquidity analysis:
For carrying out the profitability analysis of Vodafone Plc and its competitor, BT Group
Plc, the two liquidity ratios that have been taken into account comprise of current ratio and quick
ratio, which are presented as follows:
Table 1: Liquidity ratios of Vodafone Plc for the years 2014-2018
(Source: Vodafone.com 2019)
Table 2: Liquidity ratios of BT Group Plc for the years 2014-2018
(Source: Btplc.com 2019)
5FINANCIAL MANAGEMENT
2014 2015 2016 2017 2018 2014 2015 2016 2017 2018
Vodafone Plc BT Group Plc
-
0.20
0.40
0.60
0.80
1.00
1.20
Liquidity Ratios
Current ratio
Quick ratio
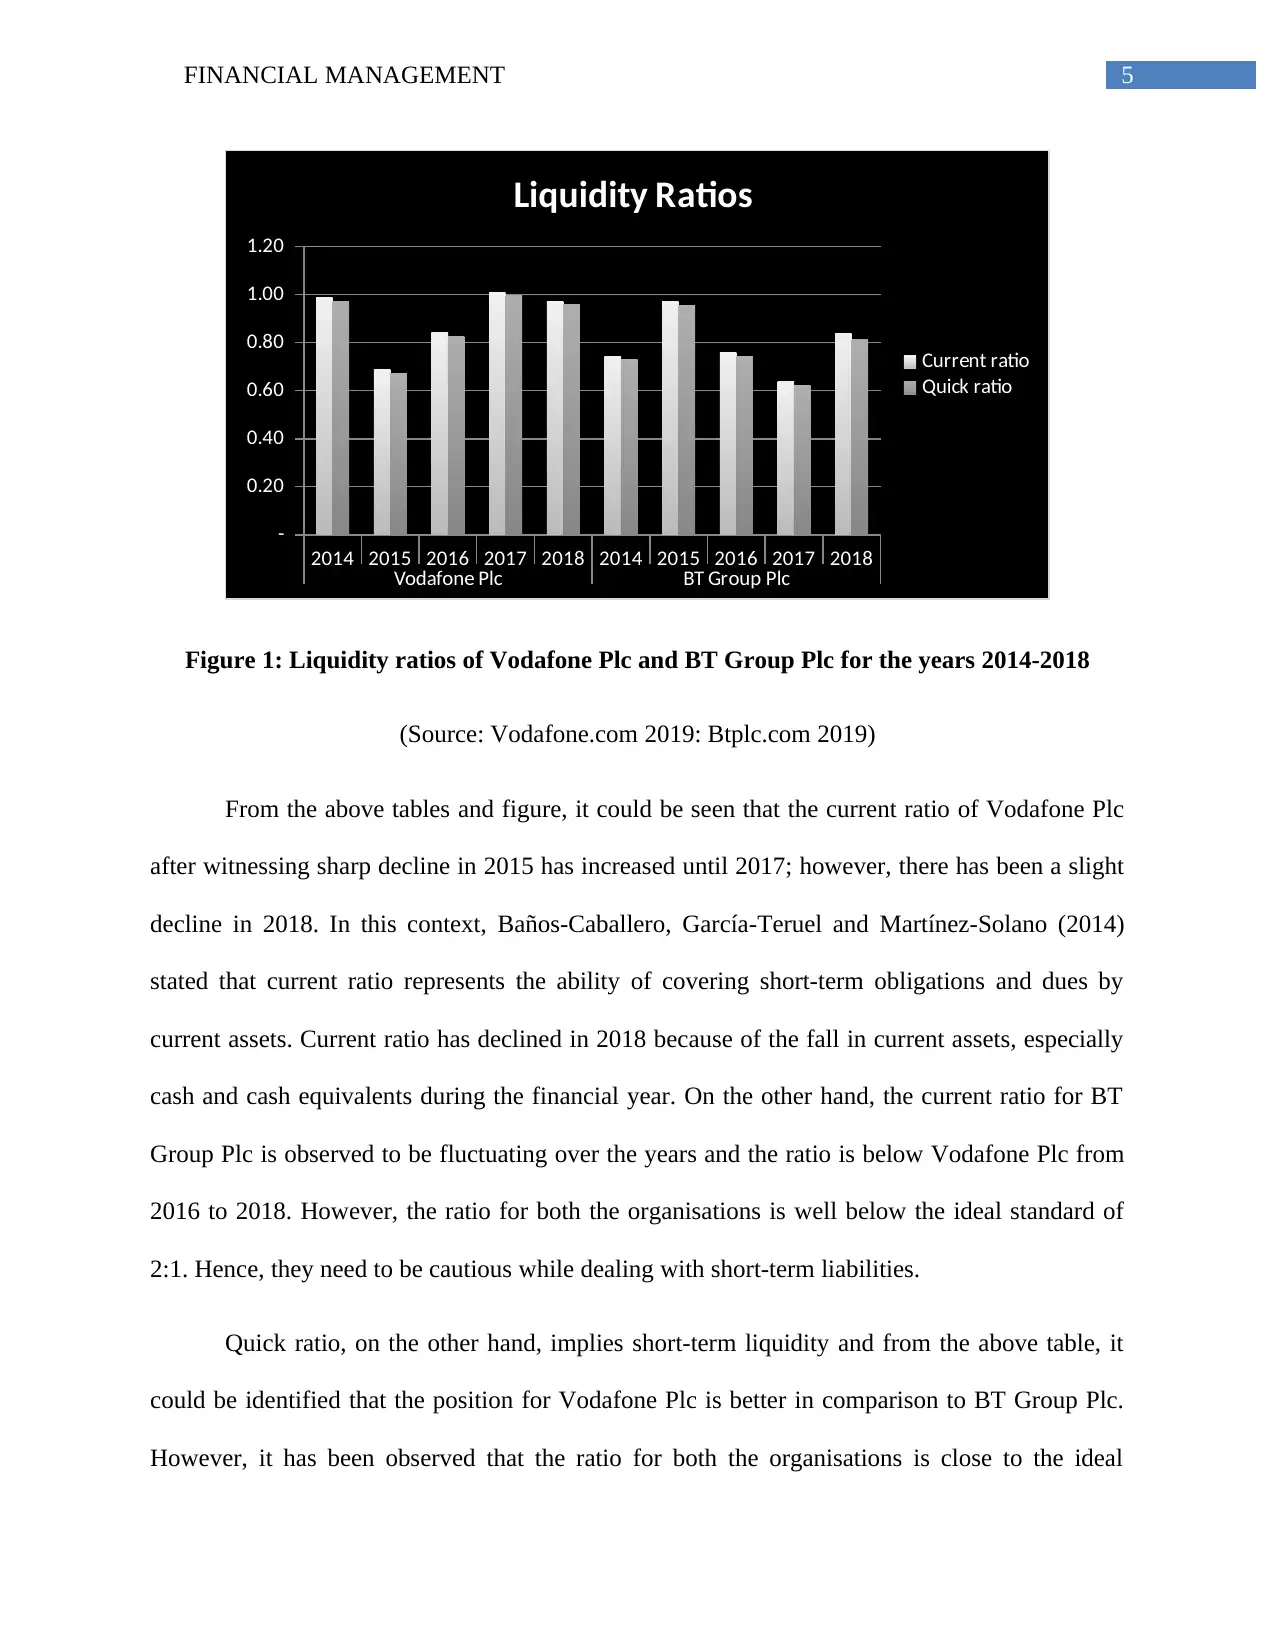
Figure 1: Liquidity ratios of Vodafone Plc and BT Group Plc for the years 2014-2018
(Source: Vodafone.com 2019: Btplc.com 2019)
From the above tables and figure, it could be seen that the current ratio of Vodafone Plc
after witnessing sharp decline in 2015 has increased until 2017; however, there has been a slight
decline in 2018. In this context, Baños-Caballero, García-Teruel and Martínez-Solano (2014)
stated that current ratio represents the ability of covering short-term obligations and dues by
current assets. Current ratio has declined in 2018 because of the fall in current assets, especially
cash and cash equivalents during the financial year. On the other hand, the current ratio for BT
Group Plc is observed to be fluctuating over the years and the ratio is below Vodafone Plc from
2016 to 2018. However, the ratio for both the organisations is well below the ideal standard of
2:1. Hence, they need to be cautious while dealing with short-term liabilities.
Quick ratio, on the other hand, implies short-term liquidity and from the above table, it
could be identified that the position for Vodafone Plc is better in comparison to BT Group Plc.
However, it has been observed that the ratio for both the organisations is close to the ideal
2014 2015 2016 2017 2018 2014 2015 2016 2017 2018
Vodafone Plc BT Group Plc
-
0.20
0.40
0.60
0.80
1.00
1.20
Liquidity Ratios
Current ratio
Quick ratio
Figure 1: Liquidity ratios of Vodafone Plc and BT Group Plc for the years 2014-2018
(Source: Vodafone.com 2019: Btplc.com 2019)
From the above tables and figure, it could be seen that the current ratio of Vodafone Plc
after witnessing sharp decline in 2015 has increased until 2017; however, there has been a slight
decline in 2018. In this context, Baños-Caballero, García-Teruel and Martínez-Solano (2014)
stated that current ratio represents the ability of covering short-term obligations and dues by
current assets. Current ratio has declined in 2018 because of the fall in current assets, especially
cash and cash equivalents during the financial year. On the other hand, the current ratio for BT
Group Plc is observed to be fluctuating over the years and the ratio is below Vodafone Plc from
2016 to 2018. However, the ratio for both the organisations is well below the ideal standard of
2:1. Hence, they need to be cautious while dealing with short-term liabilities.
Quick ratio, on the other hand, implies short-term liquidity and from the above table, it
could be identified that the position for Vodafone Plc is better in comparison to BT Group Plc.
However, it has been observed that the ratio for both the organisations is close to the ideal
⊘ This is a preview!⊘
Do you want full access?
Subscribe today to unlock all pages.
Trusted by 1+ million students worldwide
6FINANCIAL MANAGEMENT
standard of 1 (Bekaert and Hodrick 2017). The main reason behind such stable position in
liquidity of Vodafone Plc is the fall in short-term borrowings, which has assisted the organisation
in maintaining stable liquidity position in the market. Hence, in terms of liquidity, Vodafone Plc
is observed to be in a favourable position in comparison to BT Group Plc in the UK
telecommunications sector.
Profitability analysis:
In order to conduct the profitability analysis of Vodafone Plc and its competitor, BT
Group Plc, the two profitability ratios that have been taken into account comprise of net margin
and return on capital employed (ROCE), which are presented as follows:
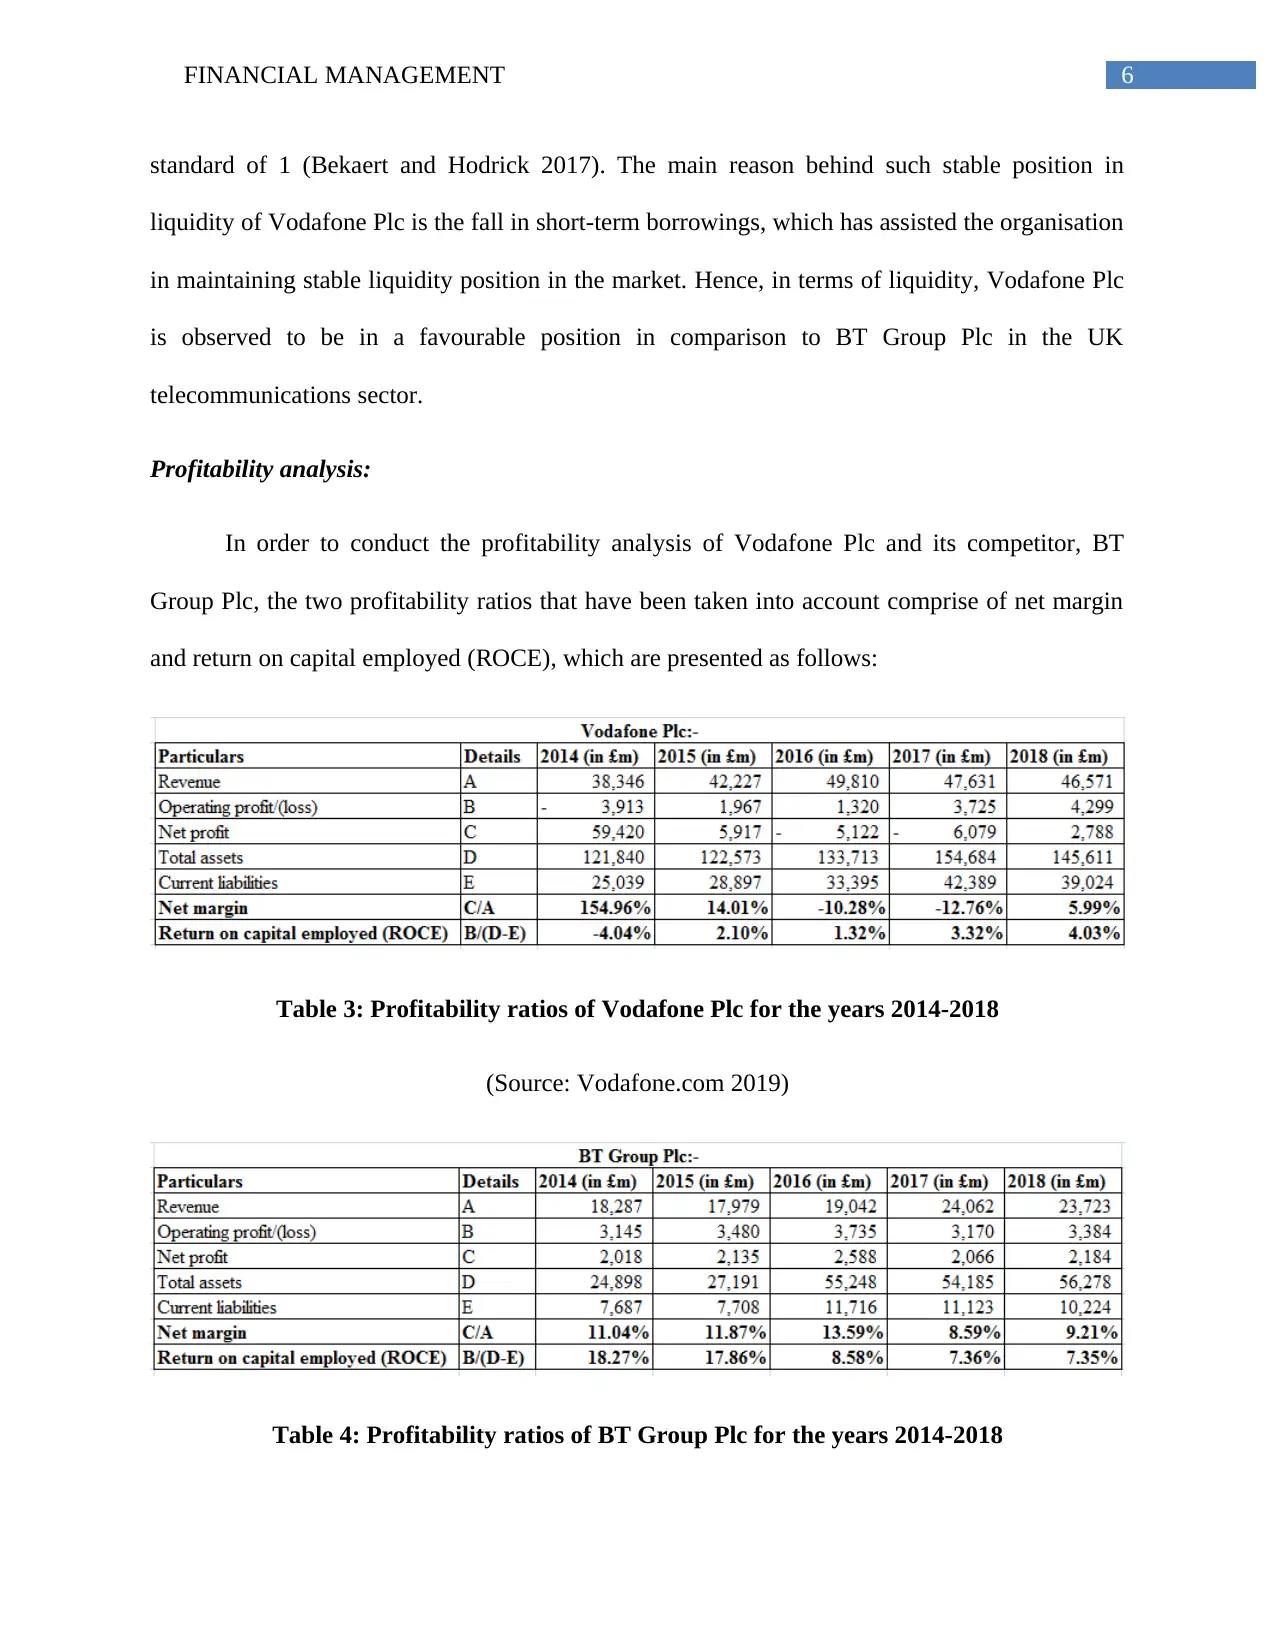
Table 3: Profitability ratios of Vodafone Plc for the years 2014-2018
(Source: Vodafone.com 2019)
Table 4: Profitability ratios of BT Group Plc for the years 2014-2018
standard of 1 (Bekaert and Hodrick 2017). The main reason behind such stable position in
liquidity of Vodafone Plc is the fall in short-term borrowings, which has assisted the organisation
in maintaining stable liquidity position in the market. Hence, in terms of liquidity, Vodafone Plc
is observed to be in a favourable position in comparison to BT Group Plc in the UK
telecommunications sector.
Profitability analysis:
In order to conduct the profitability analysis of Vodafone Plc and its competitor, BT
Group Plc, the two profitability ratios that have been taken into account comprise of net margin
and return on capital employed (ROCE), which are presented as follows:
Table 3: Profitability ratios of Vodafone Plc for the years 2014-2018
(Source: Vodafone.com 2019)
Table 4: Profitability ratios of BT Group Plc for the years 2014-2018
Paraphrase This Document
Need a fresh take? Get an instant paraphrase of this document with our AI Paraphraser
7FINANCIAL MANAGEMENT
(Source: Btplc.com 2019)
2014 2015 2016 2017 2018 2014 2015 2016 2017 2018
Vodafone Plc BT Group Plc
-50.00%
0.00%
50.00%
100.00%
150.00%
200.00%
Profitability Ratios
Net margin
Return on capital employed
(ROCE)
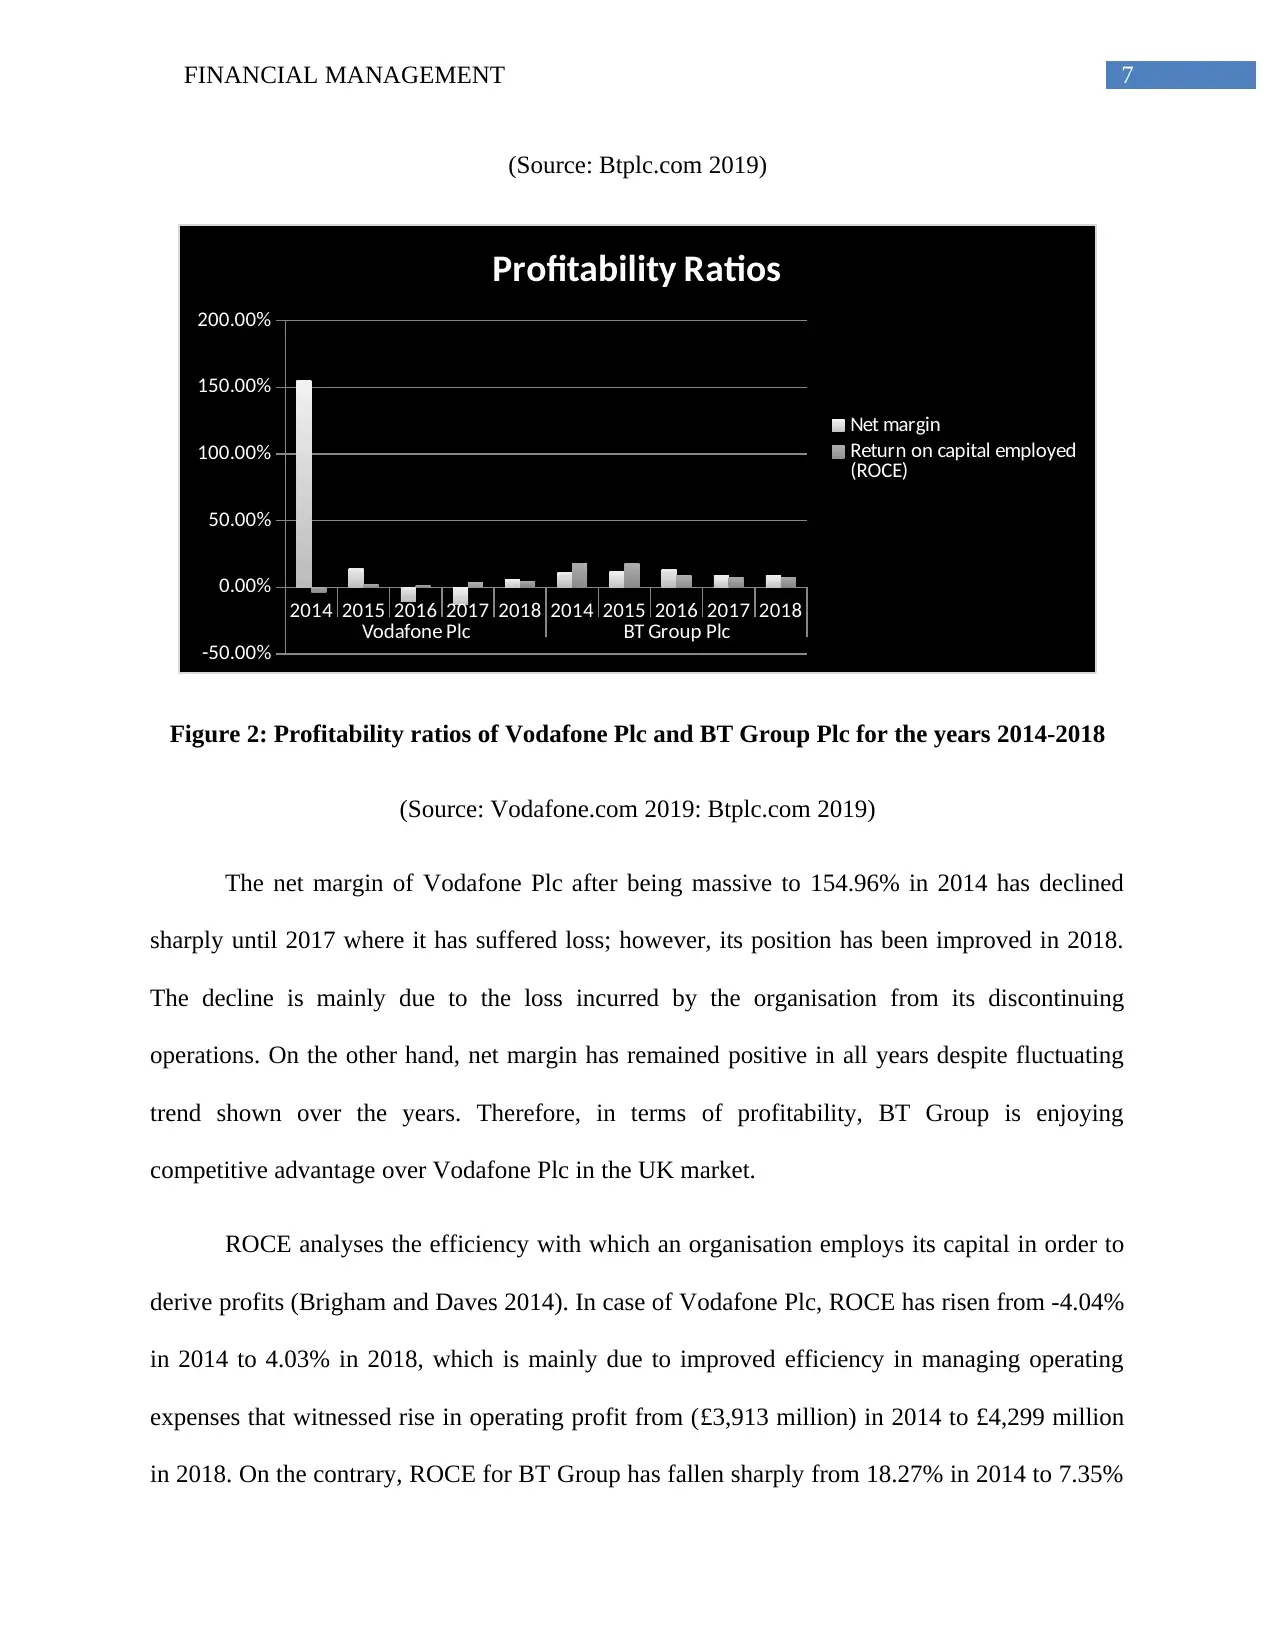
Figure 2: Profitability ratios of Vodafone Plc and BT Group Plc for the years 2014-2018
(Source: Vodafone.com 2019: Btplc.com 2019)
The net margin of Vodafone Plc after being massive to 154.96% in 2014 has declined
sharply until 2017 where it has suffered loss; however, its position has been improved in 2018.
The decline is mainly due to the loss incurred by the organisation from its discontinuing
operations. On the other hand, net margin has remained positive in all years despite fluctuating
trend shown over the years. Therefore, in terms of profitability, BT Group is enjoying
competitive advantage over Vodafone Plc in the UK market.
ROCE analyses the efficiency with which an organisation employs its capital in order to
derive profits (Brigham and Daves 2014). In case of Vodafone Plc, ROCE has risen from -4.04%
in 2014 to 4.03% in 2018, which is mainly due to improved efficiency in managing operating
expenses that witnessed rise in operating profit from (£3,913 million) in 2014 to £4,299 million
in 2018. On the contrary, ROCE for BT Group has fallen sharply from 18.27% in 2014 to 7.35%
(Source: Btplc.com 2019)
2014 2015 2016 2017 2018 2014 2015 2016 2017 2018
Vodafone Plc BT Group Plc
-50.00%
0.00%
50.00%
100.00%
150.00%
200.00%
Profitability Ratios
Net margin
Return on capital employed
(ROCE)
Figure 2: Profitability ratios of Vodafone Plc and BT Group Plc for the years 2014-2018
(Source: Vodafone.com 2019: Btplc.com 2019)
The net margin of Vodafone Plc after being massive to 154.96% in 2014 has declined
sharply until 2017 where it has suffered loss; however, its position has been improved in 2018.
The decline is mainly due to the loss incurred by the organisation from its discontinuing
operations. On the other hand, net margin has remained positive in all years despite fluctuating
trend shown over the years. Therefore, in terms of profitability, BT Group is enjoying
competitive advantage over Vodafone Plc in the UK market.
ROCE analyses the efficiency with which an organisation employs its capital in order to
derive profits (Brigham and Daves 2014). In case of Vodafone Plc, ROCE has risen from -4.04%
in 2014 to 4.03% in 2018, which is mainly due to improved efficiency in managing operating
expenses that witnessed rise in operating profit from (£3,913 million) in 2014 to £4,299 million
in 2018. On the contrary, ROCE for BT Group has fallen sharply from 18.27% in 2014 to 7.35%
8FINANCIAL MANAGEMENT
in 2018. However, the efficiency of Vodafone in using its capital is still lower compared to BT
Group Plc. Despite increased capital employed and higher revenue generated by Vodafone, its
operating income is suppressed owing to increased cost of sales and other operating expenses.
Thus, the profitability position of BT Group is found to be better than Vodafone Plc in the UK
telecommunications sector.
Efficiency analysis:
In order to conduct the efficiency analysis of Vodafone Plc and its competitor, BT Group
Plc, the three efficiency ratios that have been taken into account comprise of inventory turnover,
receivables turnover and payables turnover in terms of days, which are depicted as follows:
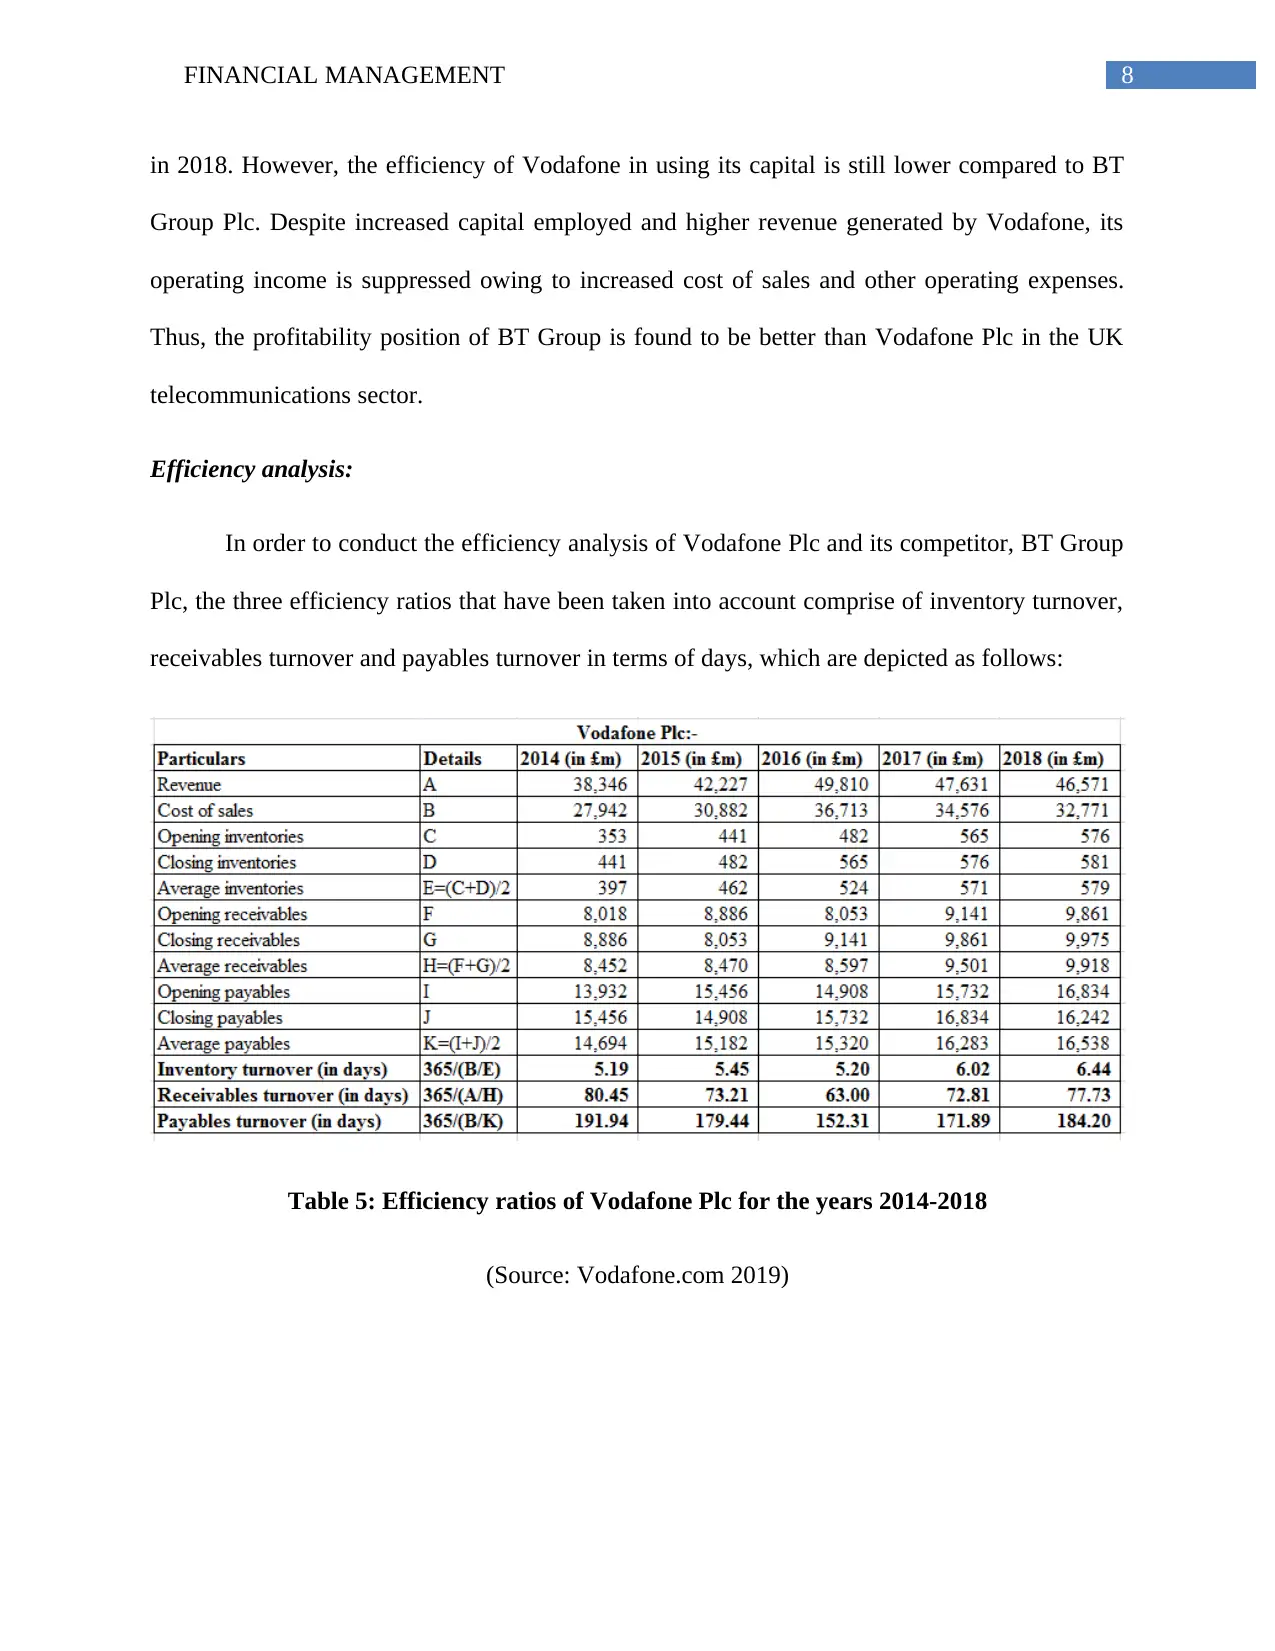
Table 5: Efficiency ratios of Vodafone Plc for the years 2014-2018
(Source: Vodafone.com 2019)
in 2018. However, the efficiency of Vodafone in using its capital is still lower compared to BT
Group Plc. Despite increased capital employed and higher revenue generated by Vodafone, its
operating income is suppressed owing to increased cost of sales and other operating expenses.
Thus, the profitability position of BT Group is found to be better than Vodafone Plc in the UK
telecommunications sector.
Efficiency analysis:
In order to conduct the efficiency analysis of Vodafone Plc and its competitor, BT Group
Plc, the three efficiency ratios that have been taken into account comprise of inventory turnover,
receivables turnover and payables turnover in terms of days, which are depicted as follows:
Table 5: Efficiency ratios of Vodafone Plc for the years 2014-2018
(Source: Vodafone.com 2019)
⊘ This is a preview!⊘
Do you want full access?
Subscribe today to unlock all pages.
Trusted by 1+ million students worldwide
9FINANCIAL MANAGEMENT
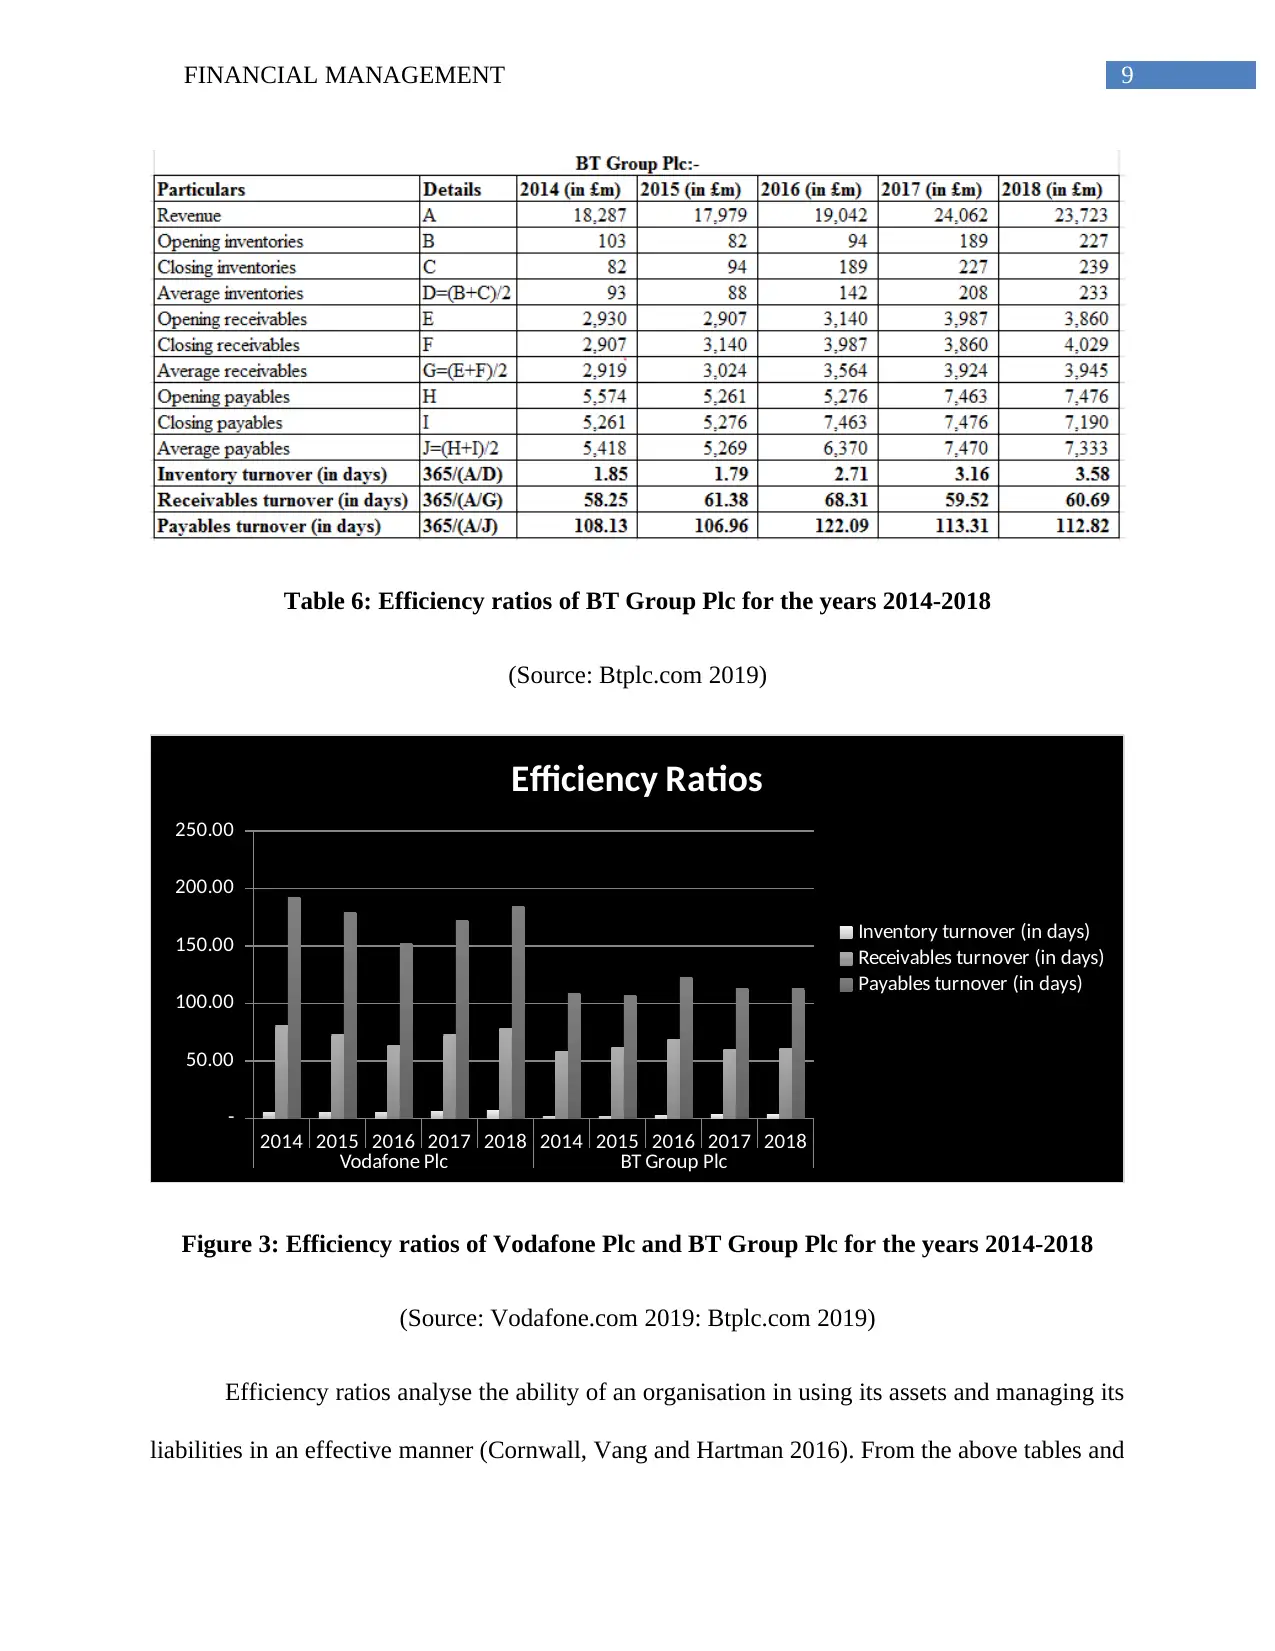
Table 6: Efficiency ratios of BT Group Plc for the years 2014-2018
(Source: Btplc.com 2019)
2014 2015 2016 2017 2018 2014 2015 2016 2017 2018
Vodafone Plc BT Group Plc
-
50.00
100.00
150.00
200.00
250.00
Efficiency Ratios
Inventory turnover (in days)
Receivables turnover (in days)
Payables turnover (in days)
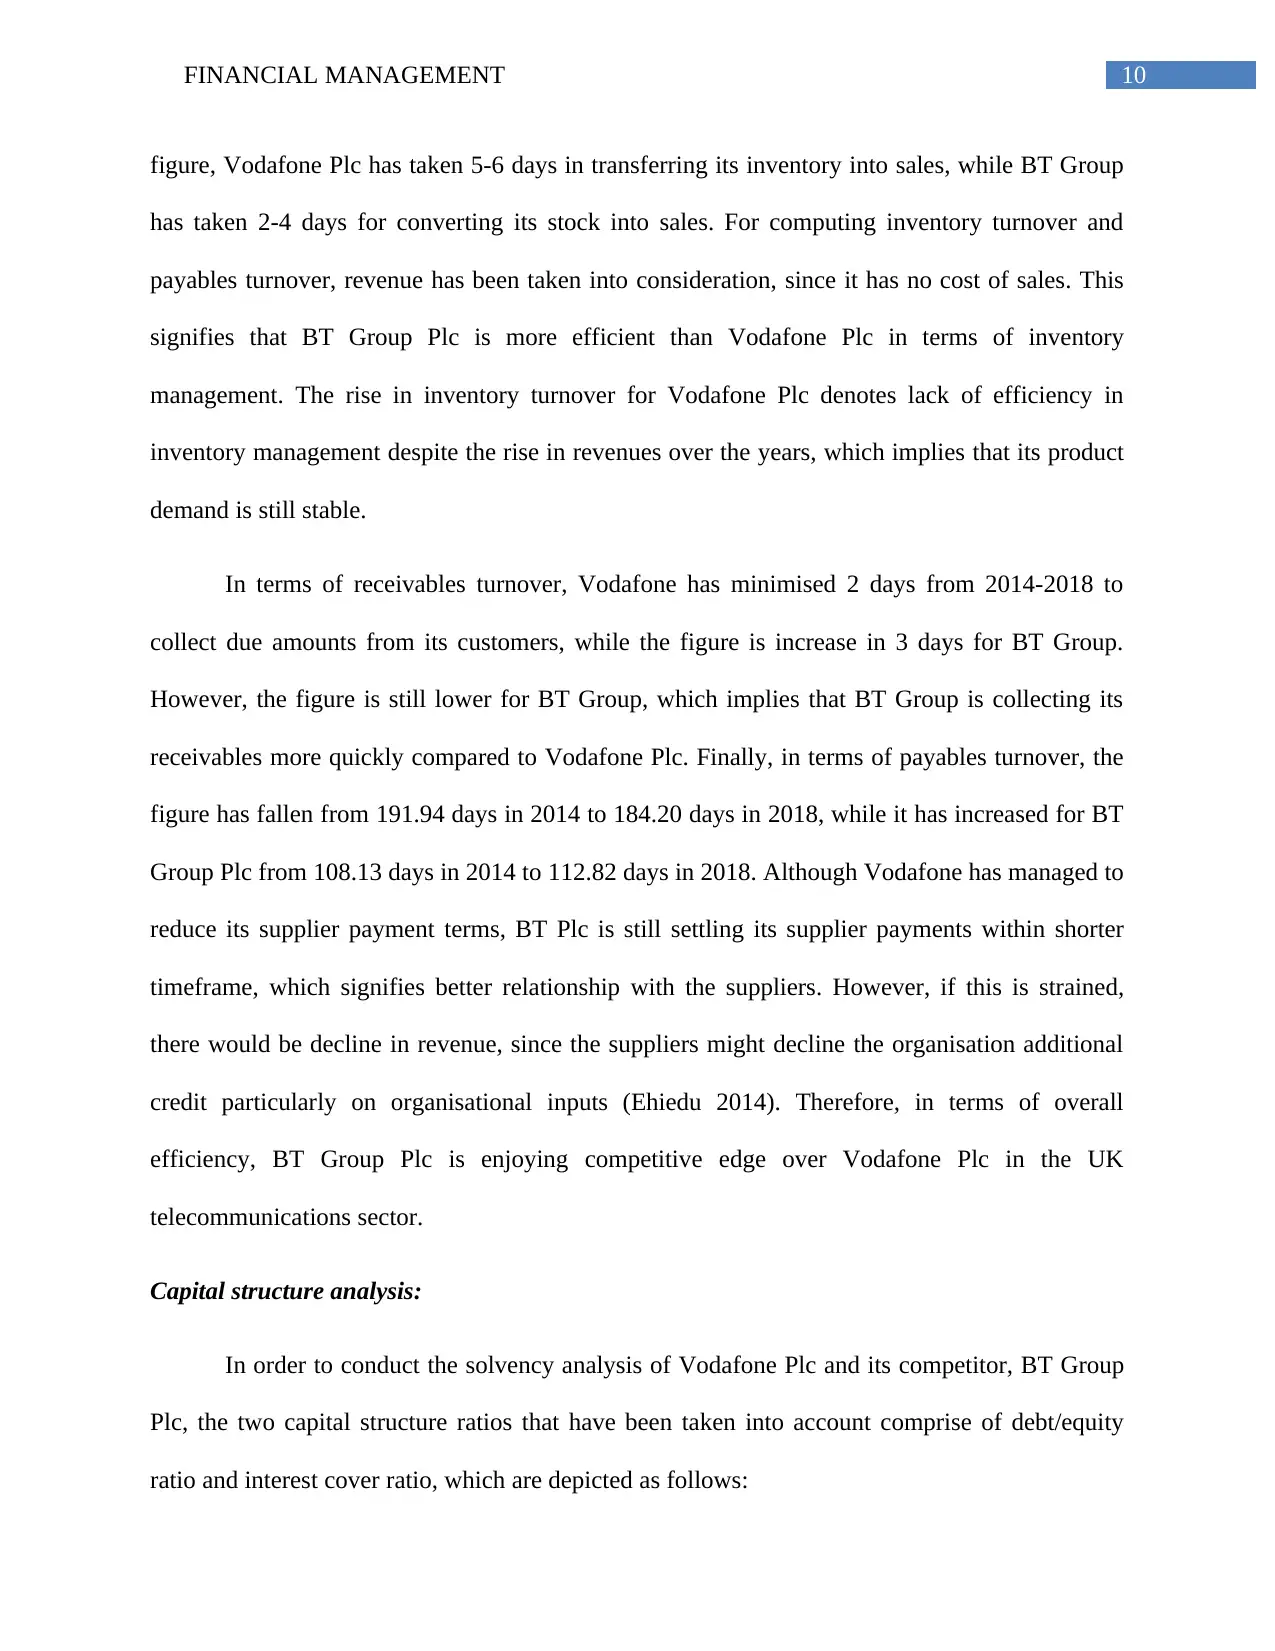
Figure 3: Efficiency ratios of Vodafone Plc and BT Group Plc for the years 2014-2018
(Source: Vodafone.com 2019: Btplc.com 2019)
Efficiency ratios analyse the ability of an organisation in using its assets and managing its
liabilities in an effective manner (Cornwall, Vang and Hartman 2016). From the above tables and
Table 6: Efficiency ratios of BT Group Plc for the years 2014-2018
(Source: Btplc.com 2019)
2014 2015 2016 2017 2018 2014 2015 2016 2017 2018
Vodafone Plc BT Group Plc
-
50.00
100.00
150.00
200.00
250.00
Efficiency Ratios
Inventory turnover (in days)
Receivables turnover (in days)
Payables turnover (in days)
Figure 3: Efficiency ratios of Vodafone Plc and BT Group Plc for the years 2014-2018
(Source: Vodafone.com 2019: Btplc.com 2019)
Efficiency ratios analyse the ability of an organisation in using its assets and managing its
liabilities in an effective manner (Cornwall, Vang and Hartman 2016). From the above tables and
Paraphrase This Document
Need a fresh take? Get an instant paraphrase of this document with our AI Paraphraser
10FINANCIAL MANAGEMENT
figure, Vodafone Plc has taken 5-6 days in transferring its inventory into sales, while BT Group
has taken 2-4 days for converting its stock into sales. For computing inventory turnover and
payables turnover, revenue has been taken into consideration, since it has no cost of sales. This
signifies that BT Group Plc is more efficient than Vodafone Plc in terms of inventory
management. The rise in inventory turnover for Vodafone Plc denotes lack of efficiency in
inventory management despite the rise in revenues over the years, which implies that its product
demand is still stable.
In terms of receivables turnover, Vodafone has minimised 2 days from 2014-2018 to
collect due amounts from its customers, while the figure is increase in 3 days for BT Group.
However, the figure is still lower for BT Group, which implies that BT Group is collecting its
receivables more quickly compared to Vodafone Plc. Finally, in terms of payables turnover, the
figure has fallen from 191.94 days in 2014 to 184.20 days in 2018, while it has increased for BT
Group Plc from 108.13 days in 2014 to 112.82 days in 2018. Although Vodafone has managed to
reduce its supplier payment terms, BT Plc is still settling its supplier payments within shorter
timeframe, which signifies better relationship with the suppliers. However, if this is strained,
there would be decline in revenue, since the suppliers might decline the organisation additional
credit particularly on organisational inputs (Ehiedu 2014). Therefore, in terms of overall
efficiency, BT Group Plc is enjoying competitive edge over Vodafone Plc in the UK
telecommunications sector.
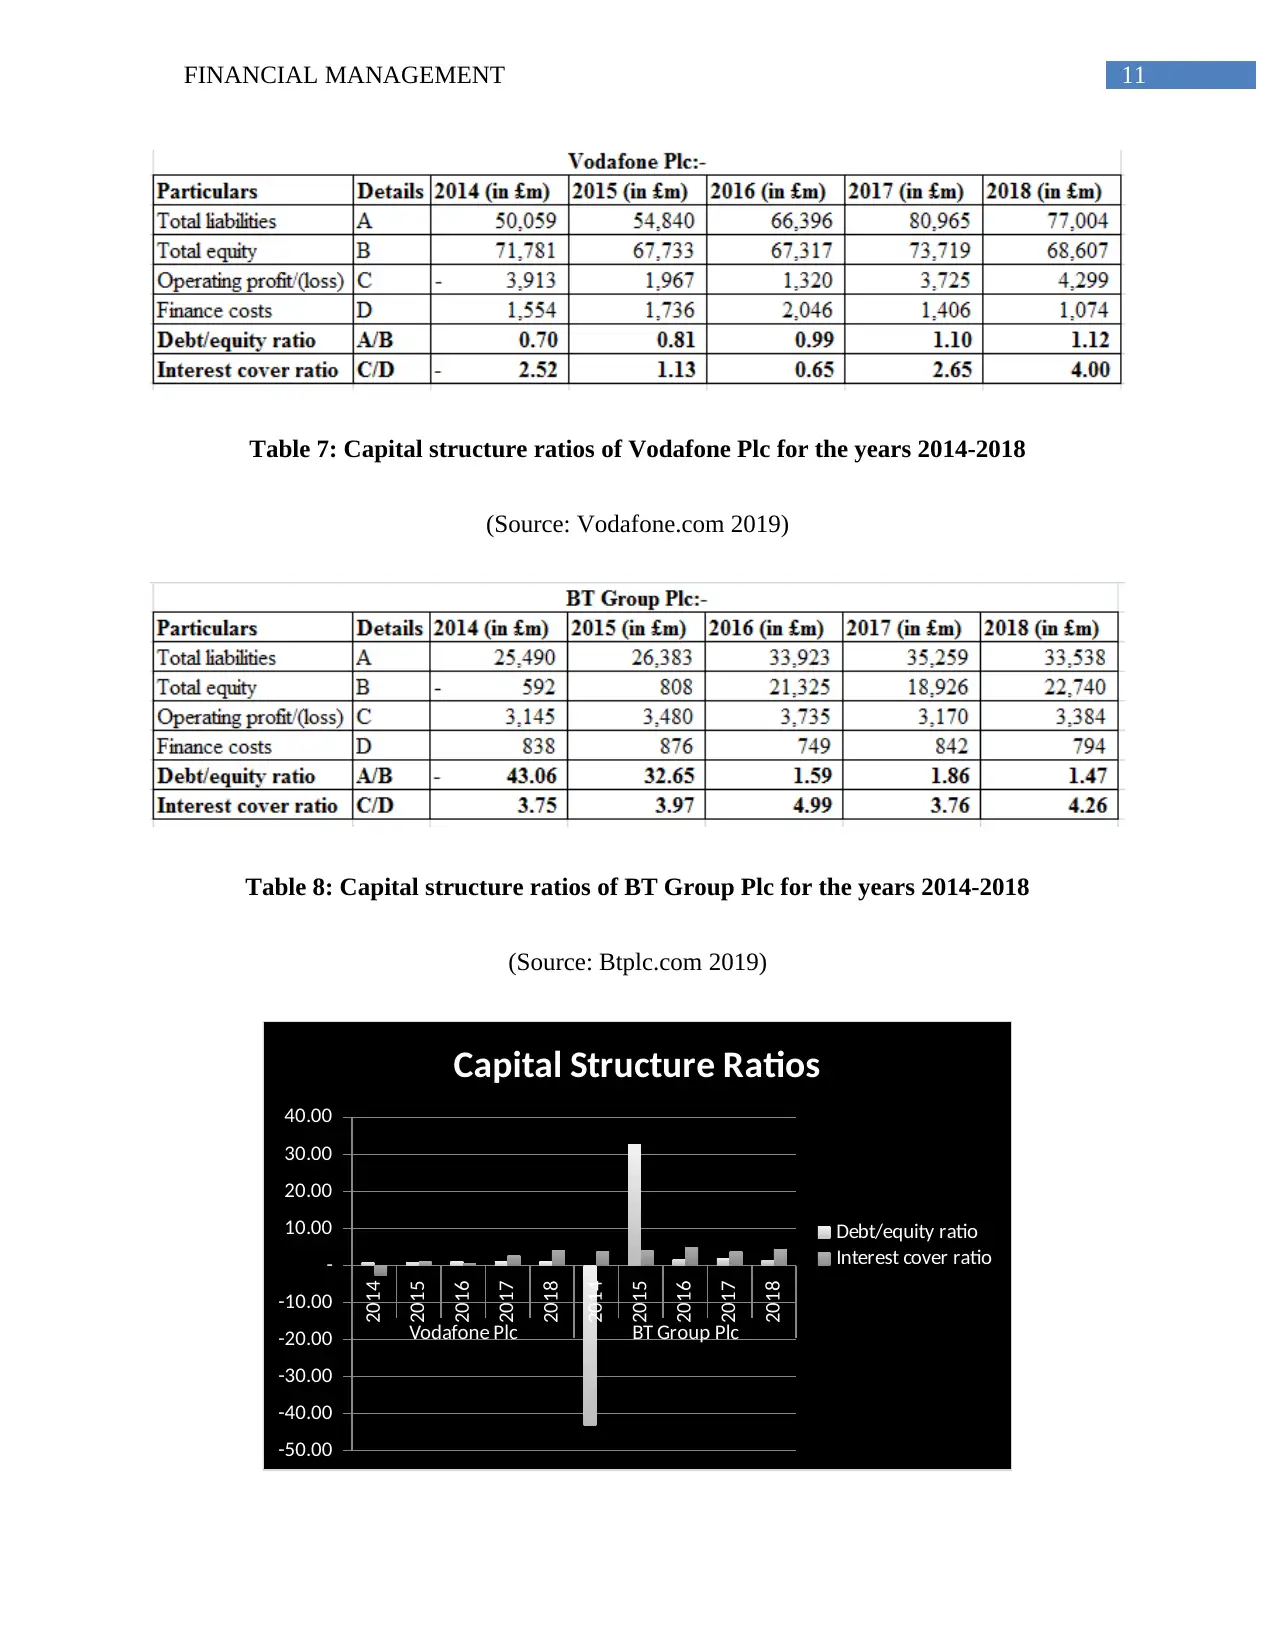
Capital structure analysis:
In order to conduct the solvency analysis of Vodafone Plc and its competitor, BT Group
Plc, the two capital structure ratios that have been taken into account comprise of debt/equity
ratio and interest cover ratio, which are depicted as follows:
figure, Vodafone Plc has taken 5-6 days in transferring its inventory into sales, while BT Group
has taken 2-4 days for converting its stock into sales. For computing inventory turnover and
payables turnover, revenue has been taken into consideration, since it has no cost of sales. This
signifies that BT Group Plc is more efficient than Vodafone Plc in terms of inventory
management. The rise in inventory turnover for Vodafone Plc denotes lack of efficiency in
inventory management despite the rise in revenues over the years, which implies that its product
demand is still stable.
In terms of receivables turnover, Vodafone has minimised 2 days from 2014-2018 to
collect due amounts from its customers, while the figure is increase in 3 days for BT Group.
However, the figure is still lower for BT Group, which implies that BT Group is collecting its
receivables more quickly compared to Vodafone Plc. Finally, in terms of payables turnover, the
figure has fallen from 191.94 days in 2014 to 184.20 days in 2018, while it has increased for BT
Group Plc from 108.13 days in 2014 to 112.82 days in 2018. Although Vodafone has managed to
reduce its supplier payment terms, BT Plc is still settling its supplier payments within shorter
timeframe, which signifies better relationship with the suppliers. However, if this is strained,
there would be decline in revenue, since the suppliers might decline the organisation additional
credit particularly on organisational inputs (Ehiedu 2014). Therefore, in terms of overall
efficiency, BT Group Plc is enjoying competitive edge over Vodafone Plc in the UK
telecommunications sector.
Capital structure analysis:
In order to conduct the solvency analysis of Vodafone Plc and its competitor, BT Group
Plc, the two capital structure ratios that have been taken into account comprise of debt/equity
ratio and interest cover ratio, which are depicted as follows:
11FINANCIAL MANAGEMENT
Table 7: Capital structure ratios of Vodafone Plc for the years 2014-2018
(Source: Vodafone.com 2019)
Table 8: Capital structure ratios of BT Group Plc for the years 2014-2018
(Source: Btplc.com 2019)
2014
2015
2016
2017
2018
2014
2015
2016
2017
2018
Vodafone Plc BT Group Plc
-50.00
-40.00
-30.00
-20.00
-10.00
-
10.00
20.00
30.00
40.00
Capital Structure Ratios
Debt/equity ratio
Interest cover ratio
⊘ This is a preview!⊘
Do you want full access?
Subscribe today to unlock all pages.
Trusted by 1+ million students worldwide
1 out of 25
Related Documents


Your All-in-One AI-Powered Toolkit for Academic Success.
+13062052269
info@desklib.com
Available 24*7 on WhatsApp / Email
![[object Object]](/_next/static/media/star-bottom.7253800d.svg)
Unlock your academic potential
Copyright © 2020–2026 A2Z Services. All Rights Reserved. Developed and managed by ZUCOL.