Detailed Financial Ratio Analysis and Valuation: Wal-Mart vs. Costco

Verified

Added on  2022/09/27

|22
|3753
|22
Report
AI Summary
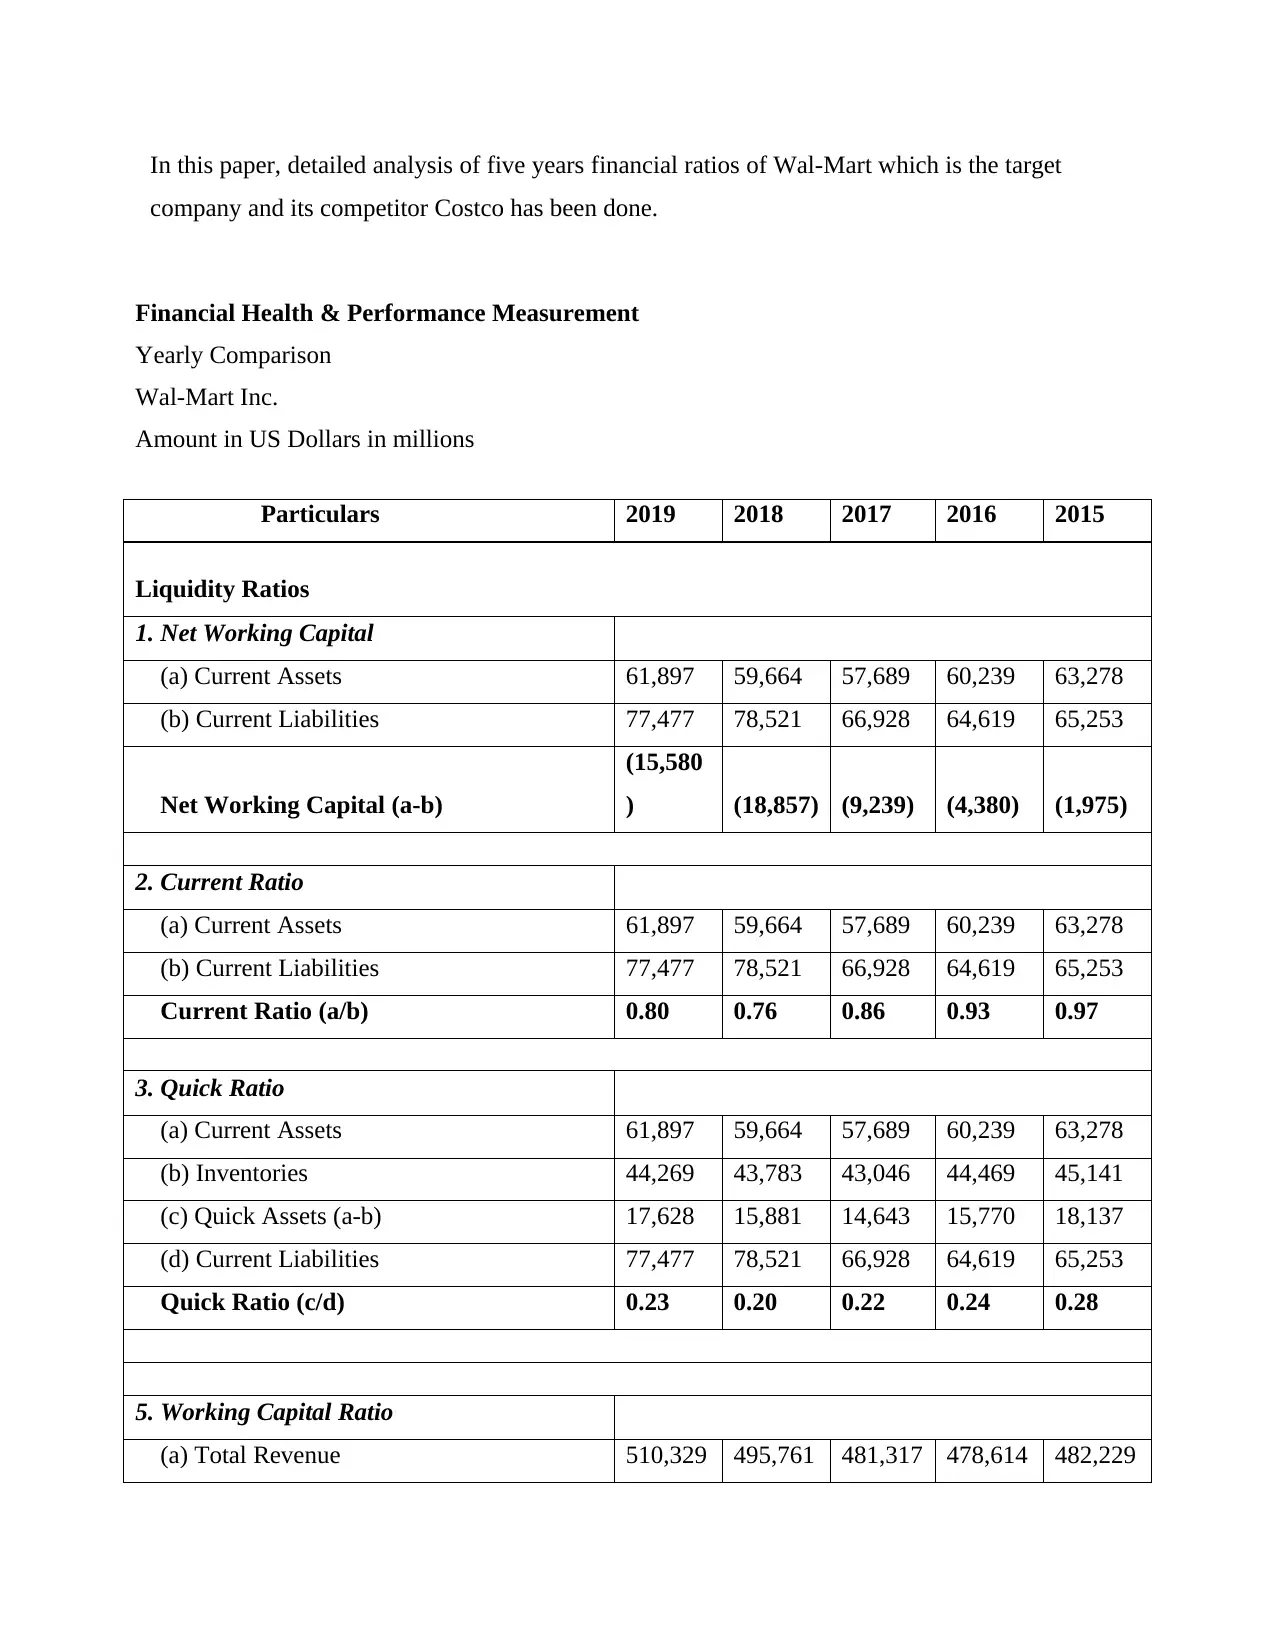
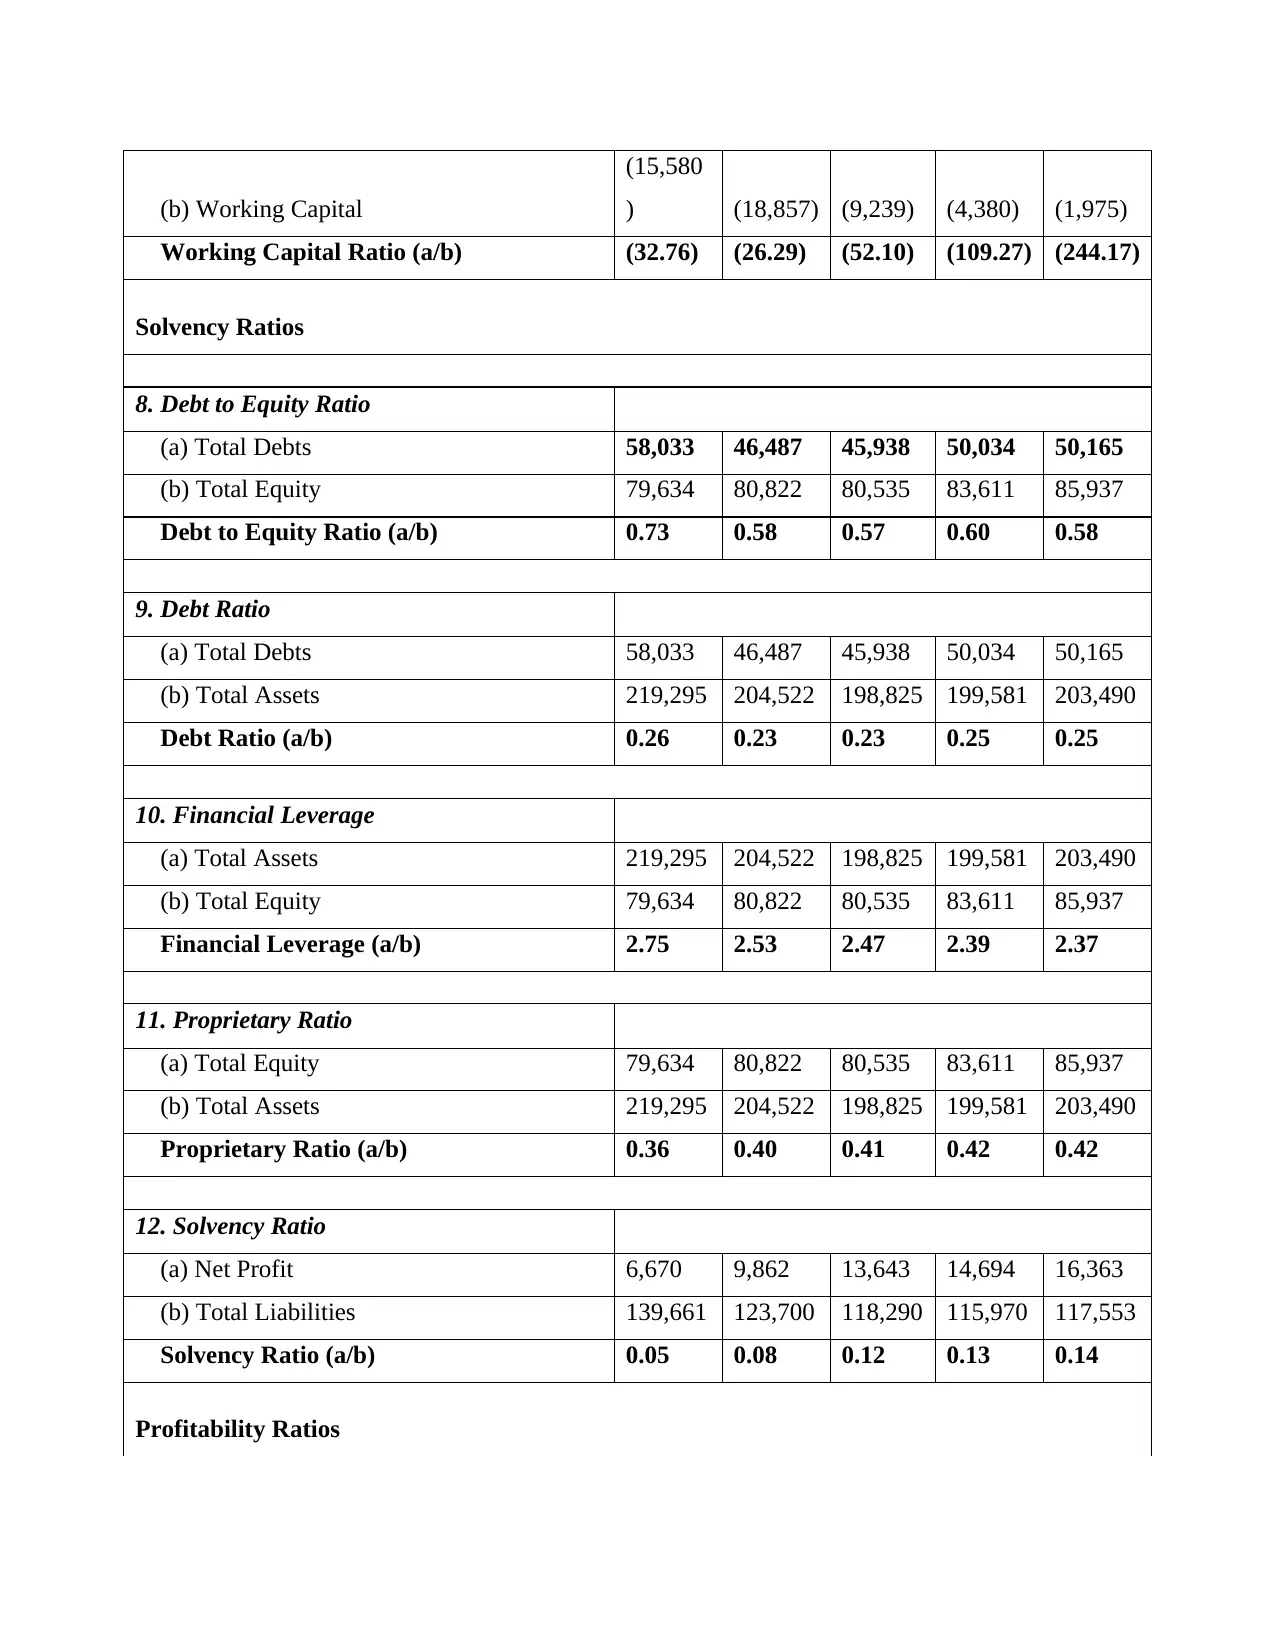
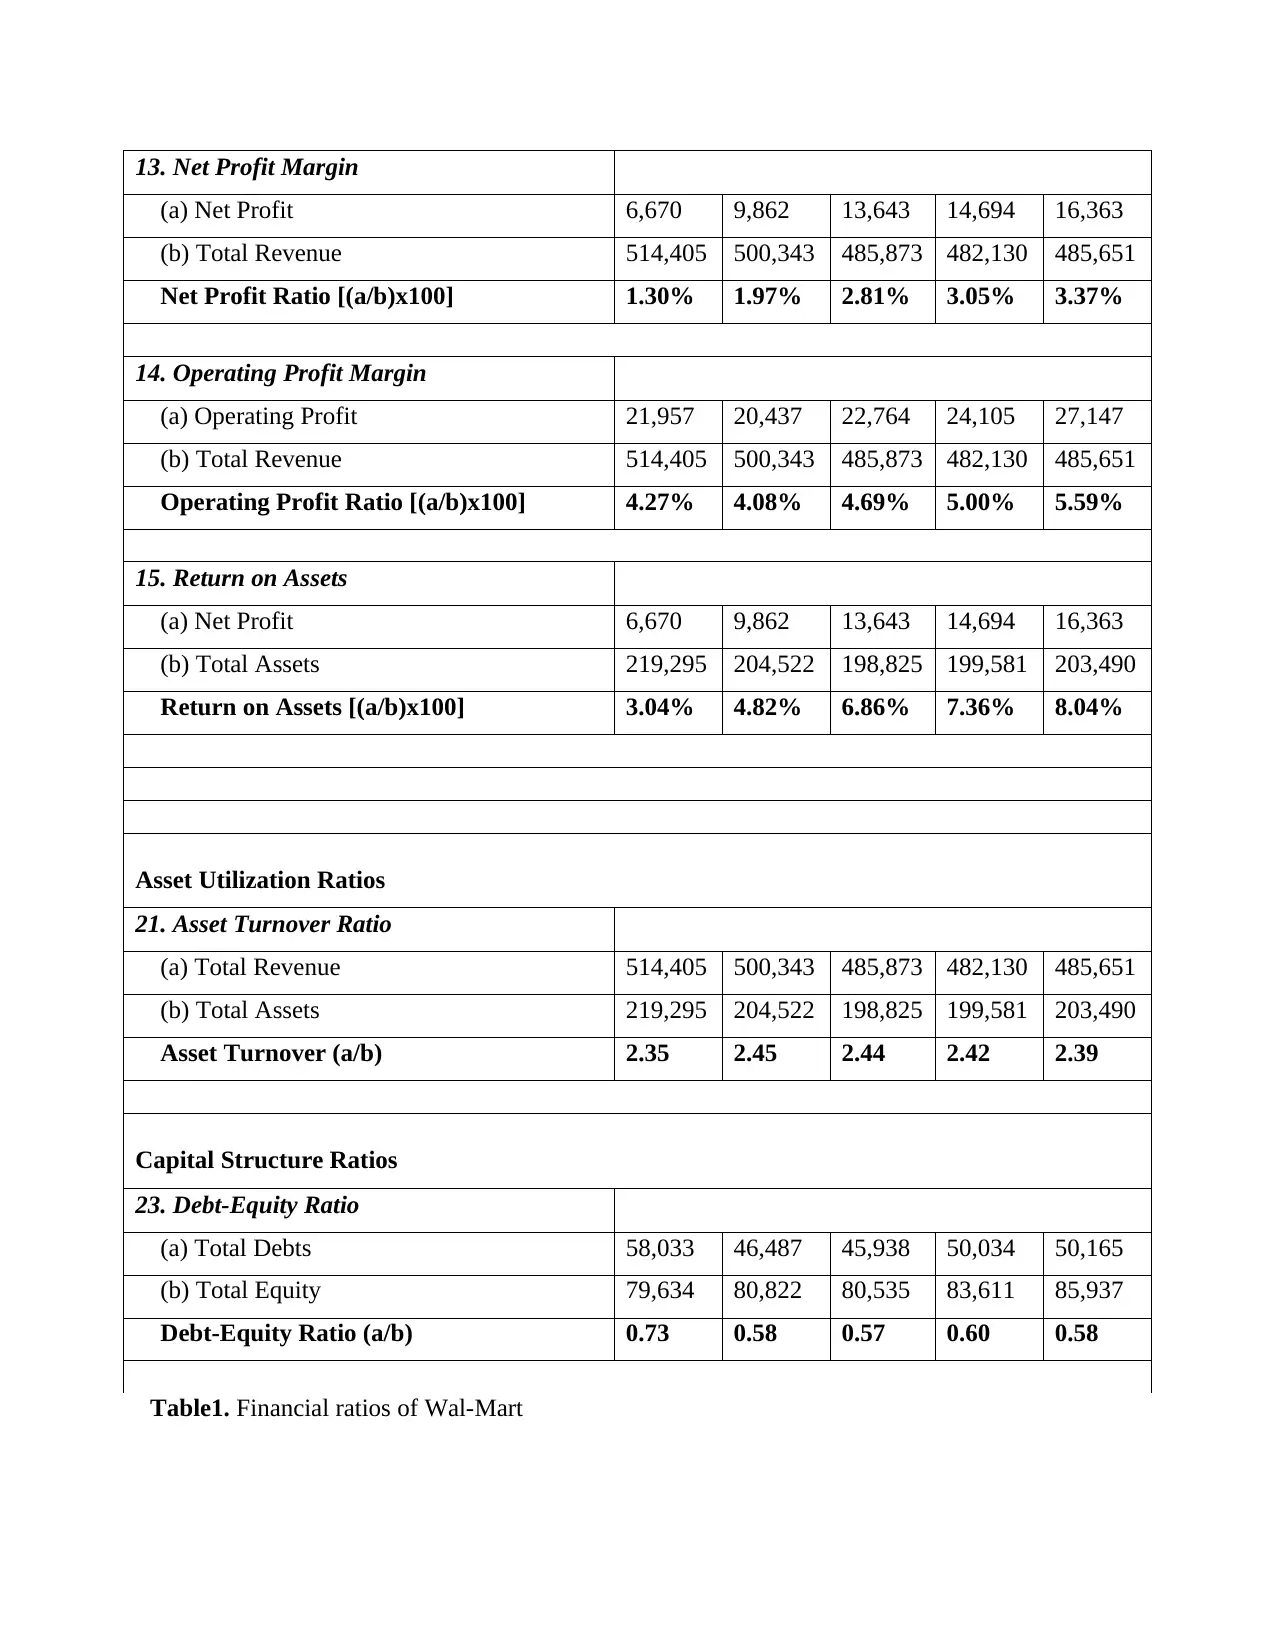
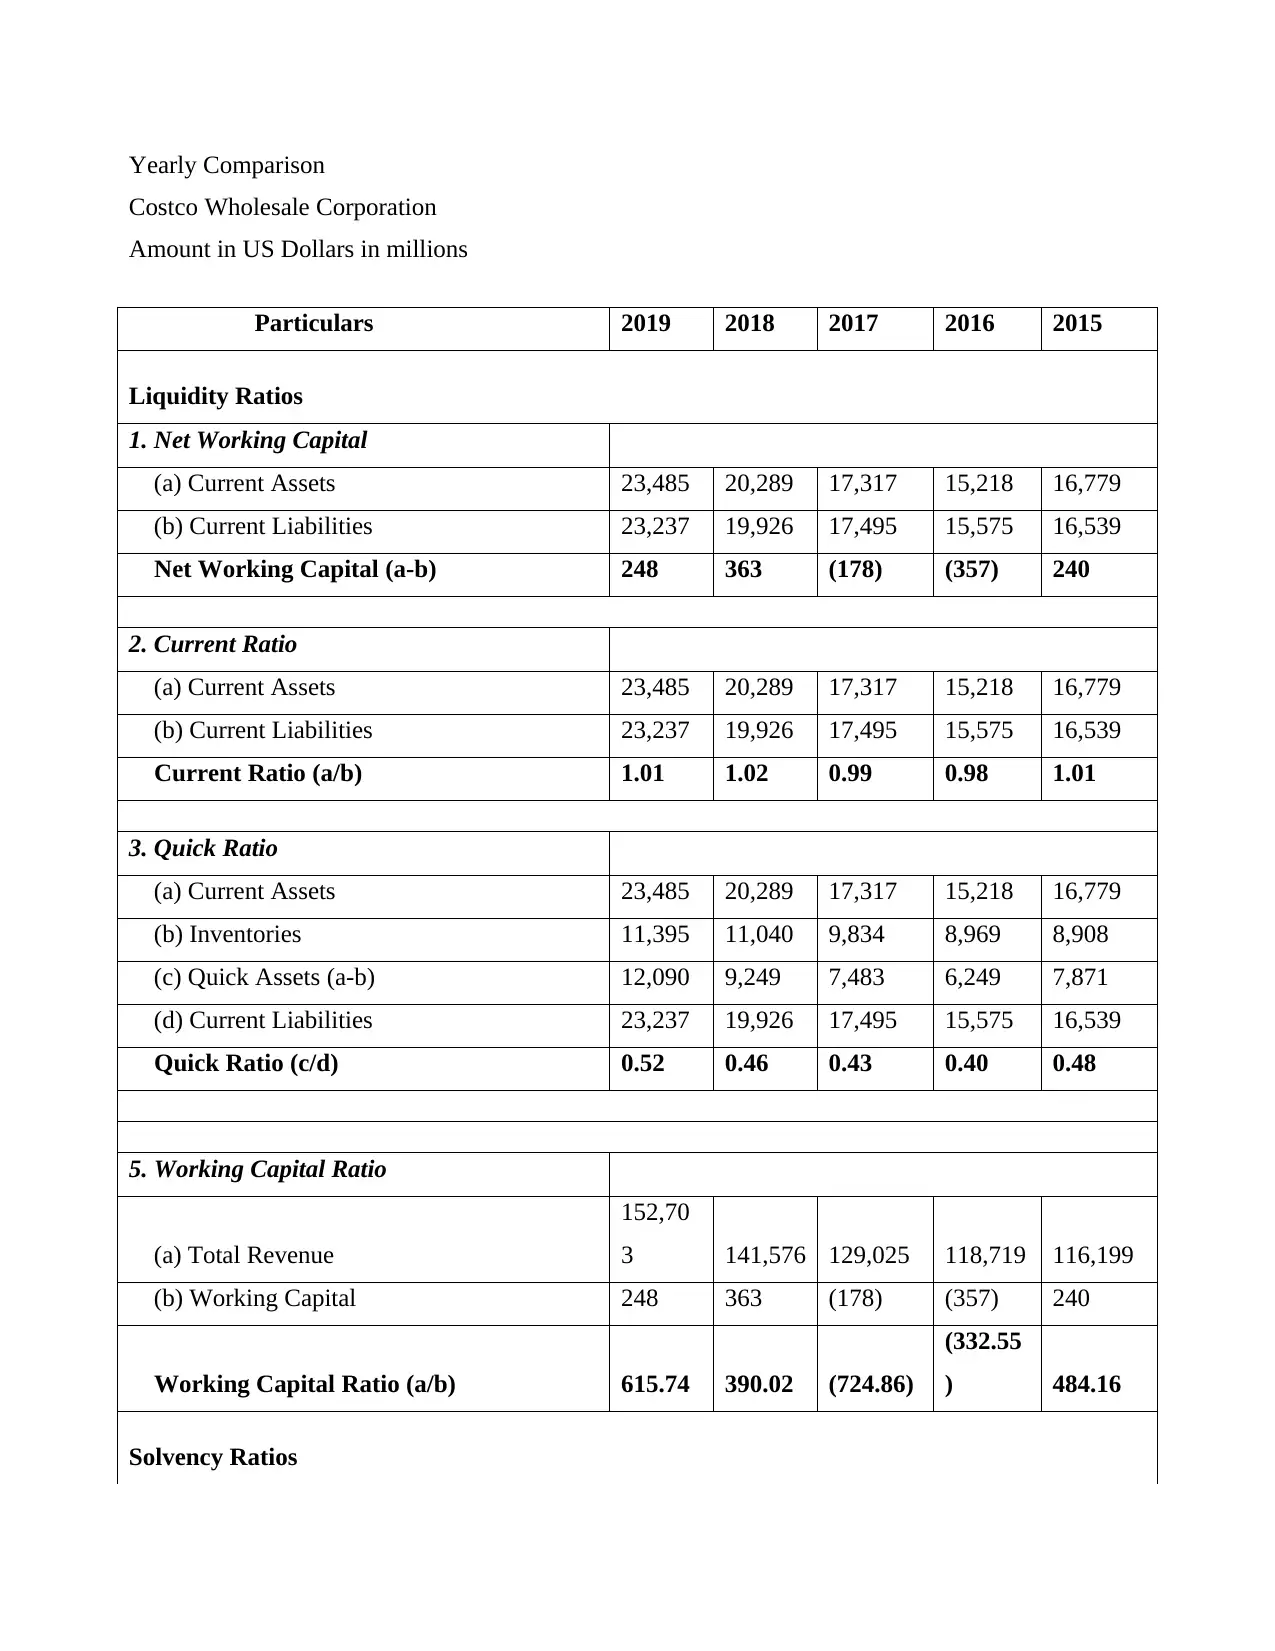
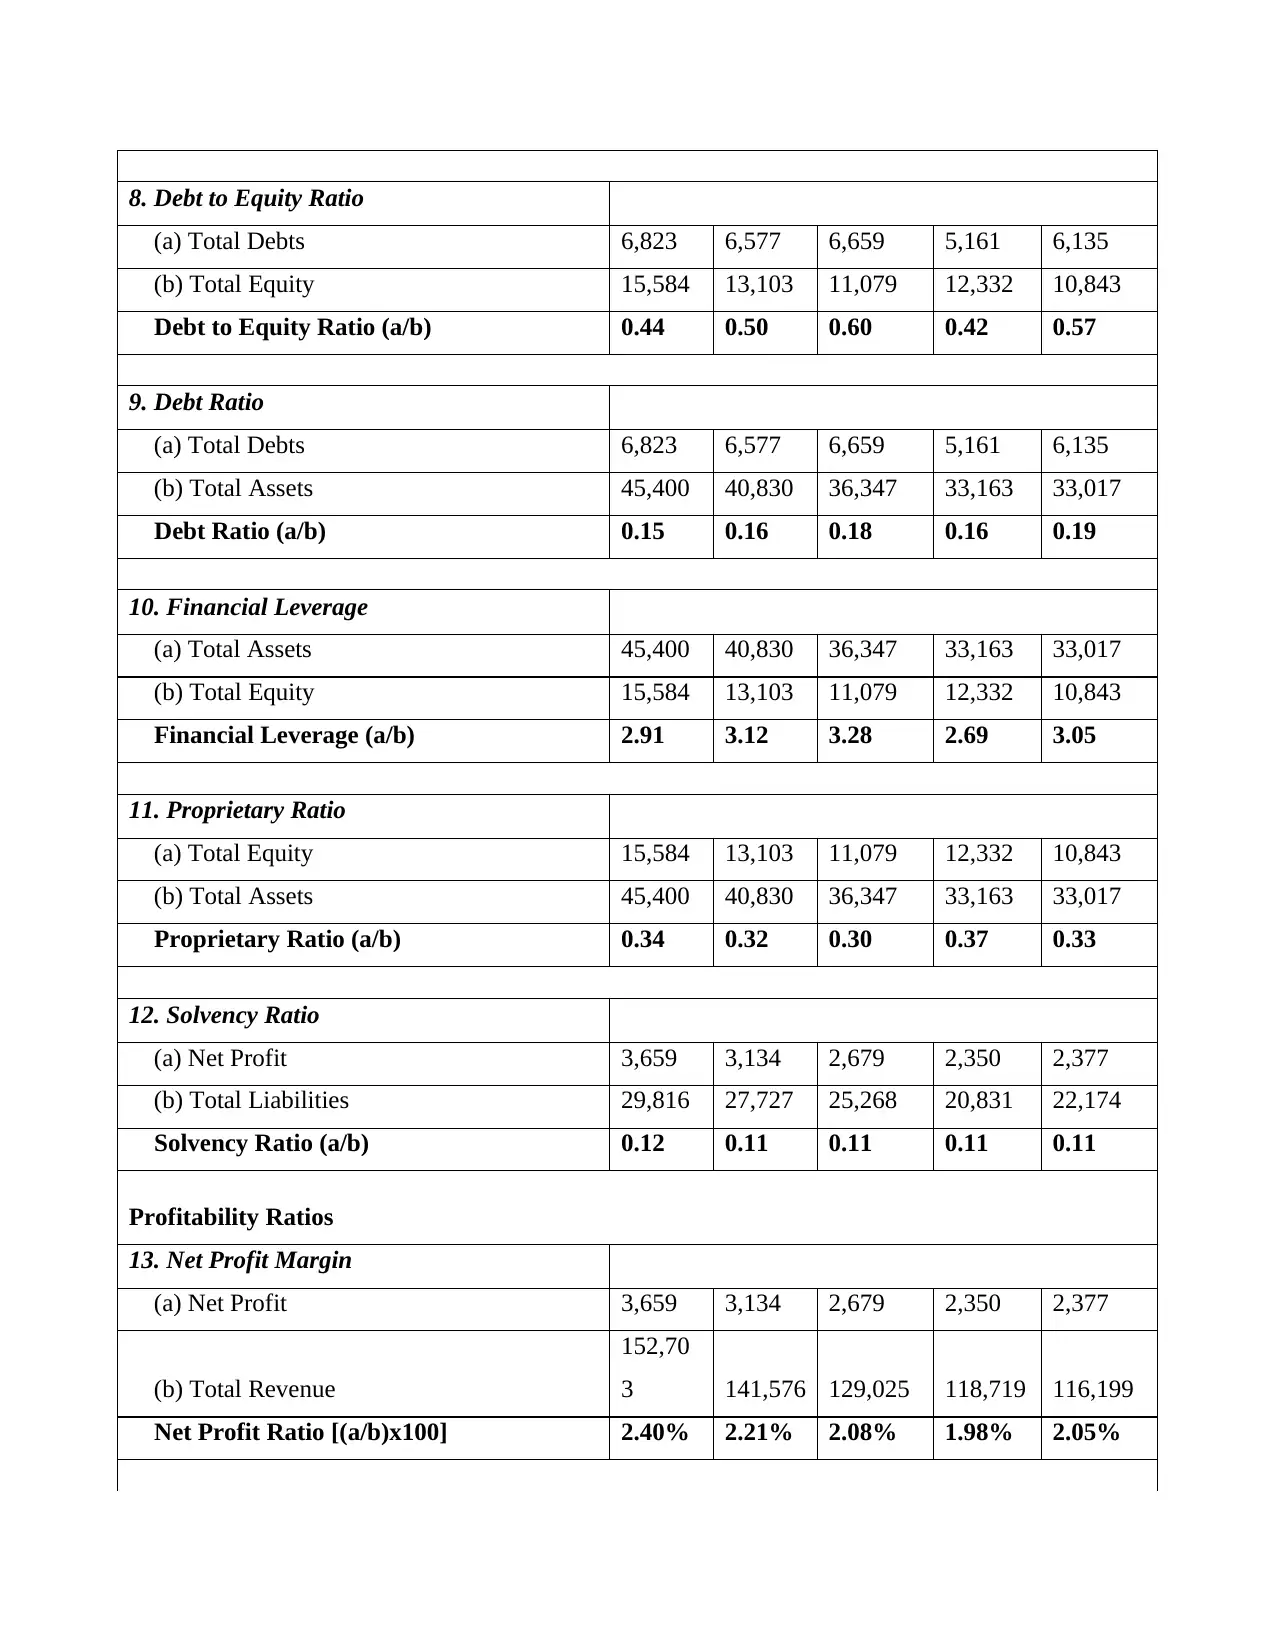
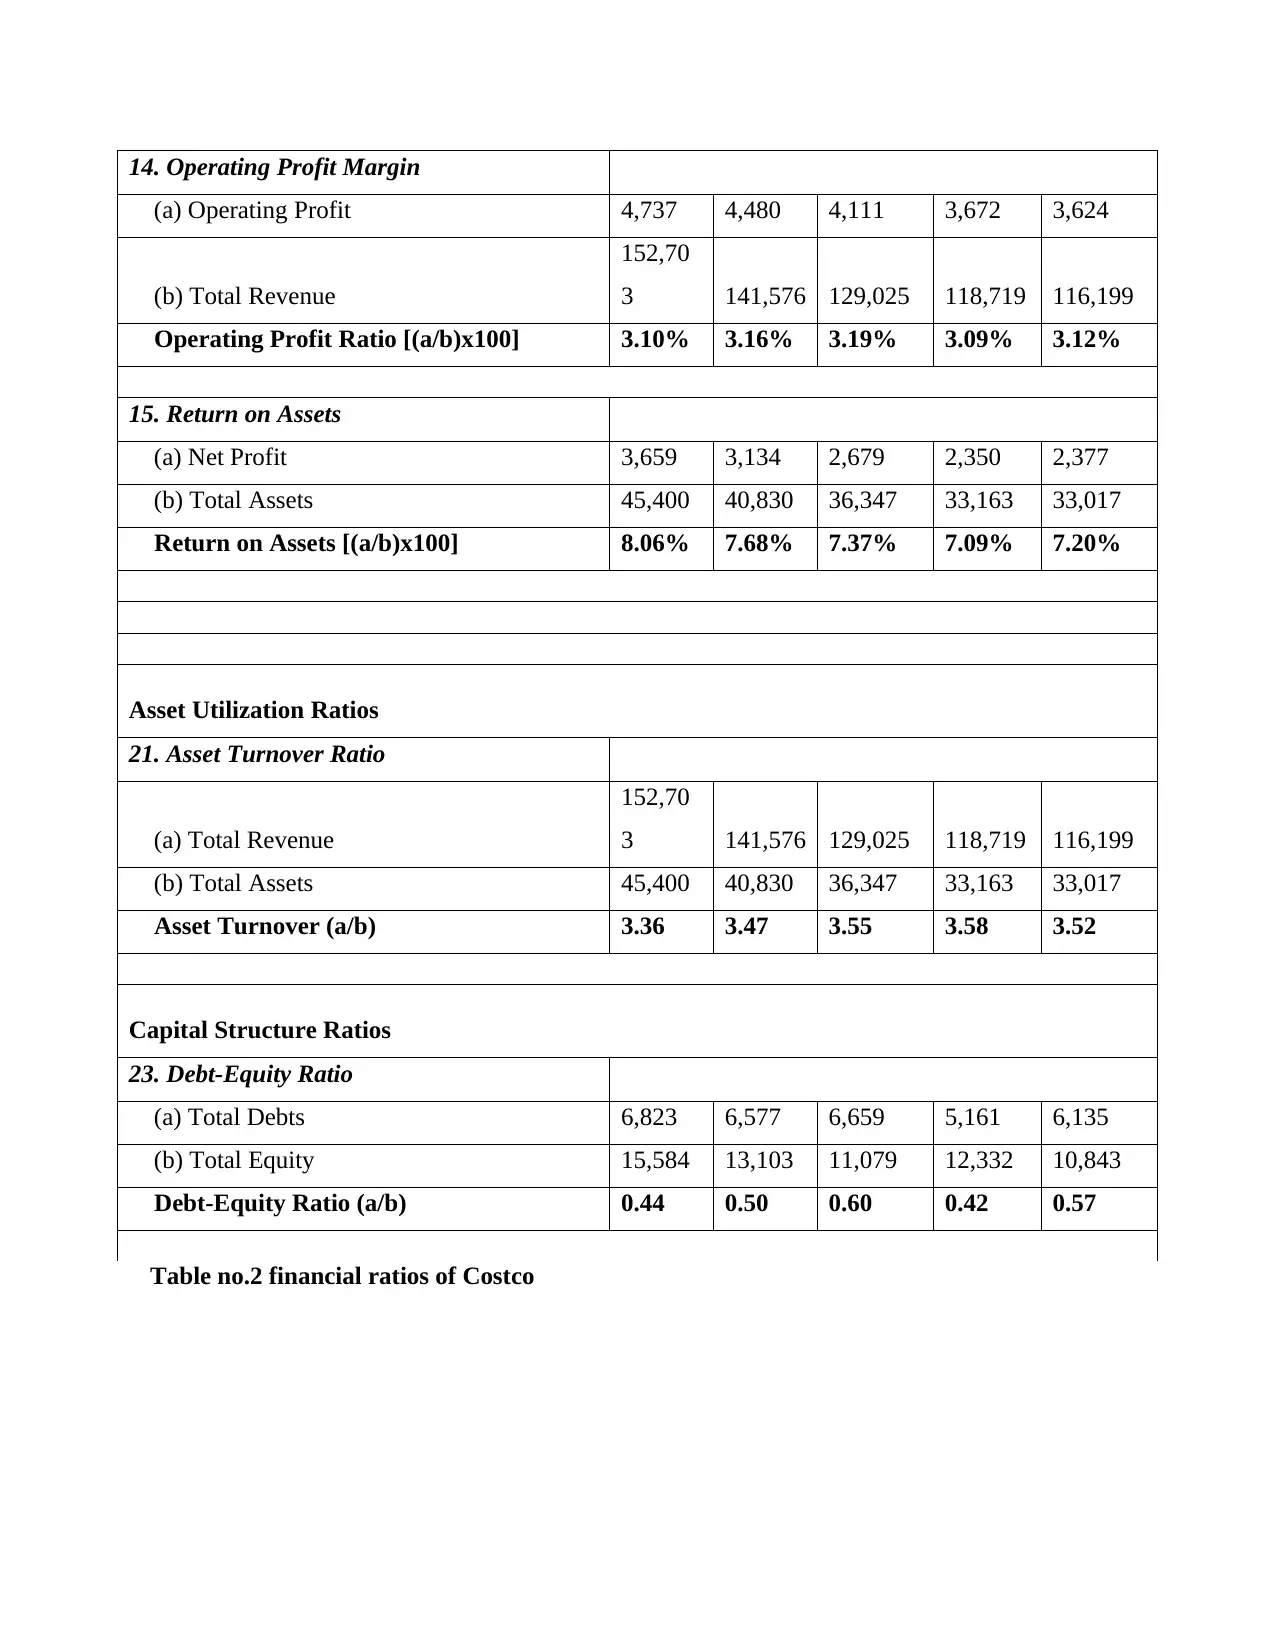
This report presents a comprehensive financial analysis of Wal-Mart and Costco, comparing their financial performance over a five-year period (2015-2019). The analysis includes a detailed examination of various financial ratios, such as liquidity, solvency, profitability, and asset utilization ratios, to assess their financial health and performance. The report compares key metrics like current ratio, debt-to-equity ratio, net profit margin, and asset turnover. Furthermore, the report calculates the intrinsic value of Wal-Mart using both the Discounted Cash Flow (DCF) method and the Residual Operating Income (ROPI) method, providing a valuation of its equity shares. A business memorandum evaluating the business environment, organizational risks, and profitability of Wal-Mart is also included. The findings indicate that Costco generally demonstrates stronger financial metrics in several areas and utilizes assets more efficiently than Wal-Mart. The report concludes with strategic recommendations for Wal-Mart, including adherence to accounting compliances and efficient capital allocation.
Document Page
Financial reporting and control
tabler-icon-diamond-filled.svg

Paraphrase This Document

Need a fresh take? Get an instant paraphrase of this document with our AI Paraphraser
Document Page
In this paper, detailed analysis of five years financial ratios of Wal-Mart which is the target
company and its competitor Costco has been done.
Financial Health & Performance Measurement
Yearly Comparison
Wal-Mart Inc.
Amount in US Dollars in millions
Particulars 2019 2018 2017 2016 2015
Liquidity Ratios
1. Net Working Capital
(a) Current Assets 61,897 59,664 57,689 60,239 63,278
(b) Current Liabilities 77,477 78,521 66,928 64,619 65,253
Net Working Capital (a-b)
(15,580
) (18,857) (9,239) (4,380) (1,975)
2. Current Ratio
(a) Current Assets 61,897 59,664 57,689 60,239 63,278
(b) Current Liabilities 77,477 78,521 66,928 64,619 65,253
Current Ratio (a/b) 0.80 0.76 0.86 0.93 0.97
3. Quick Ratio
(a) Current Assets 61,897 59,664 57,689 60,239 63,278
(b) Inventories 44,269 43,783 43,046 44,469 45,141
(c) Quick Assets (a-b) 17,628 15,881 14,643 15,770 18,137
(d) Current Liabilities 77,477 78,521 66,928 64,619 65,253
Quick Ratio (c/d) 0.23 0.20 0.22 0.24 0.28
5. Working Capital Ratio
(a) Total Revenue 510,329 495,761 481,317 478,614 482,229
Document Page
(b) Working Capital
(15,580
) (18,857) (9,239) (4,380) (1,975)
Working Capital Ratio (a/b) (32.76) (26.29) (52.10) (109.27) (244.17)
Solvency Ratios
8. Debt to Equity Ratio
(a) Total Debts 58,033 46,487 45,938 50,034 50,165
(b) Total Equity 79,634 80,822 80,535 83,611 85,937
Debt to Equity Ratio (a/b) 0.73 0.58 0.57 0.60 0.58
9. Debt Ratio
(a) Total Debts 58,033 46,487 45,938 50,034 50,165
(b) Total Assets 219,295 204,522 198,825 199,581 203,490
Debt Ratio (a/b) 0.26 0.23 0.23 0.25 0.25
10. Financial Leverage
(a) Total Assets 219,295 204,522 198,825 199,581 203,490
(b) Total Equity 79,634 80,822 80,535 83,611 85,937
Financial Leverage (a/b) 2.75 2.53 2.47 2.39 2.37
11. Proprietary Ratio
(a) Total Equity 79,634 80,822 80,535 83,611 85,937
(b) Total Assets 219,295 204,522 198,825 199,581 203,490
Proprietary Ratio (a/b) 0.36 0.40 0.41 0.42 0.42
12. Solvency Ratio
(a) Net Profit 6,670 9,862 13,643 14,694 16,363
(b) Total Liabilities 139,661 123,700 118,290 115,970 117,553
Solvency Ratio (a/b) 0.05 0.08 0.12 0.13 0.14
Profitability Ratios
Document Page
13. Net Profit Margin
(a) Net Profit 6,670 9,862 13,643 14,694 16,363
(b) Total Revenue 514,405 500,343 485,873 482,130 485,651
Net Profit Ratio [(a/b)x100] 1.30% 1.97% 2.81% 3.05% 3.37%
14. Operating Profit Margin
(a) Operating Profit 21,957 20,437 22,764 24,105 27,147
(b) Total Revenue 514,405 500,343 485,873 482,130 485,651
Operating Profit Ratio [(a/b)x100] 4.27% 4.08% 4.69% 5.00% 5.59%
15. Return on Assets
(a) Net Profit 6,670 9,862 13,643 14,694 16,363
(b) Total Assets 219,295 204,522 198,825 199,581 203,490
Return on Assets [(a/b)x100] 3.04% 4.82% 6.86% 7.36% 8.04%
Asset Utilization Ratios
21. Asset Turnover Ratio
(a) Total Revenue 514,405 500,343 485,873 482,130 485,651
(b) Total Assets 219,295 204,522 198,825 199,581 203,490
Asset Turnover (a/b) 2.35 2.45 2.44 2.42 2.39
Capital Structure Ratios
23. Debt-Equity Ratio
(a) Total Debts 58,033 46,487 45,938 50,034 50,165
(b) Total Equity 79,634 80,822 80,535 83,611 85,937
Debt-Equity Ratio (a/b) 0.73 0.58 0.57 0.60 0.58
Table1. Financial ratios of Wal-Mart
tabler-icon-diamond-filled.svg

Paraphrase This Document

Need a fresh take? Get an instant paraphrase of this document with our AI Paraphraser
Document Page
Financial Health & Performance Measurement
Document Page
Yearly Comparison
Costco Wholesale Corporation
Amount in US Dollars in millions
Particulars 2019 2018 2017 2016 2015
Liquidity Ratios
1. Net Working Capital
(a) Current Assets 23,485 20,289 17,317 15,218 16,779
(b) Current Liabilities 23,237 19,926 17,495 15,575 16,539
Net Working Capital (a-b) 248 363 (178) (357) 240
2. Current Ratio
(a) Current Assets 23,485 20,289 17,317 15,218 16,779
(b) Current Liabilities 23,237 19,926 17,495 15,575 16,539
Current Ratio (a/b) 1.01 1.02 0.99 0.98 1.01
3. Quick Ratio
(a) Current Assets 23,485 20,289 17,317 15,218 16,779
(b) Inventories 11,395 11,040 9,834 8,969 8,908
(c) Quick Assets (a-b) 12,090 9,249 7,483 6,249 7,871
(d) Current Liabilities 23,237 19,926 17,495 15,575 16,539
Quick Ratio (c/d) 0.52 0.46 0.43 0.40 0.48
5. Working Capital Ratio
(a) Total Revenue
152,70
3 141,576 129,025 118,719 116,199
(b) Working Capital 248 363 (178) (357) 240
Working Capital Ratio (a/b) 615.74 390.02 (724.86)
(332.55
) 484.16
Solvency Ratios
Document Page
8. Debt to Equity Ratio
(a) Total Debts 6,823 6,577 6,659 5,161 6,135
(b) Total Equity 15,584 13,103 11,079 12,332 10,843
Debt to Equity Ratio (a/b) 0.44 0.50 0.60 0.42 0.57
9. Debt Ratio
(a) Total Debts 6,823 6,577 6,659 5,161 6,135
(b) Total Assets 45,400 40,830 36,347 33,163 33,017
Debt Ratio (a/b) 0.15 0.16 0.18 0.16 0.19
10. Financial Leverage
(a) Total Assets 45,400 40,830 36,347 33,163 33,017
(b) Total Equity 15,584 13,103 11,079 12,332 10,843
Financial Leverage (a/b) 2.91 3.12 3.28 2.69 3.05
11. Proprietary Ratio
(a) Total Equity 15,584 13,103 11,079 12,332 10,843
(b) Total Assets 45,400 40,830 36,347 33,163 33,017
Proprietary Ratio (a/b) 0.34 0.32 0.30 0.37 0.33
12. Solvency Ratio
(a) Net Profit 3,659 3,134 2,679 2,350 2,377
(b) Total Liabilities 29,816 27,727 25,268 20,831 22,174
Solvency Ratio (a/b) 0.12 0.11 0.11 0.11 0.11
Profitability Ratios
13. Net Profit Margin
(a) Net Profit 3,659 3,134 2,679 2,350 2,377
(b) Total Revenue
152,70
3 141,576 129,025 118,719 116,199
Net Profit Ratio [(a/b)x100] 2.40% 2.21% 2.08% 1.98% 2.05%
tabler-icon-diamond-filled.svg

Paraphrase This Document

Need a fresh take? Get an instant paraphrase of this document with our AI Paraphraser
Document Page
14. Operating Profit Margin
(a) Operating Profit 4,737 4,480 4,111 3,672 3,624
(b) Total Revenue
152,70
3 141,576 129,025 118,719 116,199
Operating Profit Ratio [(a/b)x100] 3.10% 3.16% 3.19% 3.09% 3.12%
15. Return on Assets
(a) Net Profit 3,659 3,134 2,679 2,350 2,377
(b) Total Assets 45,400 40,830 36,347 33,163 33,017
Return on Assets [(a/b)x100] 8.06% 7.68% 7.37% 7.09% 7.20%
Asset Utilization Ratios
21. Asset Turnover Ratio
(a) Total Revenue
152,70
3 141,576 129,025 118,719 116,199
(b) Total Assets 45,400 40,830 36,347 33,163 33,017
Asset Turnover (a/b) 3.36 3.47 3.55 3.58 3.52
Capital Structure Ratios
23. Debt-Equity Ratio
(a) Total Debts 6,823 6,577 6,659 5,161 6,135
(b) Total Equity 15,584 13,103 11,079 12,332 10,843
Debt-Equity Ratio (a/b) 0.44 0.50 0.60 0.42 0.57
Table no.2 financial ratios of Costco
Document Page
After comparing the financial ratio of Wal-Mart and Costco it has been analyzed that the
current ratio of Wal-Mart in 2019 was 0.80 and the current ratio of Costco was1.01. Costco has a
better position in terms of short term liquidity as compared to Wal-Mart. The companies that
have a current ratio of more than 1 will have higher capacity in payment of its short term
obligation (Martínez, Galván, & Alam, 2017).
The ratio of debt to equity of target company (Wal-Mart) was 0.73 in the year 2019 and
that of Costco was 0.44. This indicates that the proportion of debt is more in the capital structure
of Wal-Mart than Costco. But Costco in its capital structure balance the debt and equity
proportion (“Costco Wholesale Corporation | Company Profile | Vault.com”, 2020)
Target company that is Wal-Mart does not want to take much risk by including equity in
its balance sheet rather it wants to take the leveraging advantage of including more and more
debt (Bierey, Muhn & Schmidt, 2016).
After studying the solvency ratio (i.e. 0.05) of Wal-Mart for the financial year 2019 it has
been scrutinized that the chances of making default to its creditors or lenders are much higher
(“Walmart Corporate”, 2020). The solvency ratio of Costco is 0.012 which is also not deemed to
be financially sound.
While analyzing asset turnover of target and Competitor Company it has been reported
that ratio of asset turnover of Wal-Mart is 2.35 while that of Costco is 3.36. This ratio signifies
that Costco is utilizing its assets efficiently in generating revenue than Wal-Mart.
The net profit margin of Costco (2.40%) is also greater than Wal-Mart (1.30%) that indicates
Costco is utilizing its resources efficiently to achieve its market goals of increasing sales.
Both the target company (Wal-Mart) and competitor Costco belong to retail industry.
Retail industry is an industry where the dealers or retailers of goods make the products available
for the consumers. The retail industry of United States in 2017 generated revenue of 1.14 trillion
dollars which includes 5.9% of domestic products of United States (“The Retail Industry and its
impact on the Economy”, 2020).
Document Page
Calculation of Intrinsic Value
For 2019
Particulars
Wal-
Mart
Inc.
Costco
Wholesale
Corporation
Total Assets 219,295 45,400
Less: Current liabilities 77,477 23,237
Less: Non-current liabilities 62,184 6,579
Net Assets (a) 79,634 15,584
Weighted average no. of share outstanding (b) 2929 439.76
Intrinsic Value per share (a/b) 27.19 35.44
Table no. 3computation of Intrinsic value
Walmart Inc.
Equity Valuation
(DCF Method)
For the 2019
Yea
r
Free Cash
Flow
Present Value
Factor @12%
Present Value
of
Free Cash Flow
2019 17,409 1.120 0.893 15,543.75
2018 18,286 1.254 0.797 14,577.49
2017 21,054 1.405 0.712 14,985.82
2016 15,912 1.574 0.636 10,112.36
2015 16,360 1.762 0.567 9,283.10
(a) Present Value of Cash Flows 64,502.53
(b) Weighted average no. of share outstanding (in millions) 2929
Value of Equity shares (a÷b) 22.02
tabler-icon-diamond-filled.svg

Paraphrase This Document

Need a fresh take? Get an instant paraphrase of this document with our AI Paraphraser
Document Page
Table no.4 equity valuation as per DCF method
The value calculated by equity capitalization is $22.02 and the market price of Wal-Mart share is
$130.02. Thus it can be said that Wal-Mart share price is trading at a higher price and the
investor can take the advantage by selling all their stock.
Walmart Inc.
Equity Valuation
(Residual Operating Income Method) (ROPI)
For the 2019
Particulars 2019 2018 2017 2016 2015
(a) Operating income 21,957 20,437 22,764 24,105 27,147
(b) Total value of equity 79,634 80,822 80,535 83,611 85,937
(c) Cost of equity (assumed) 10% 10% 10% 10% 10%
(d) Equity charge (b×c) 7,963 8,082 8,054 8,361 8,594
(e) Residual income (a-d) 13,994 12,355 14,711 15,744 18,553
(f) Present value factor @12% 0.893 0.797 0.712 0.636 0.567
(g) Present Value of Residual Income 12,494.29 9,849.17 10,470.64 10,005.53 10,527.64
(h) Total Value 53,347.27
(i) Weighted average no. of share outstanding (in millions) 2929
Value of equity share (h/i) 18.21
Table7. Calculation of equity valuation as per ROPI method
The stock price as per equity valuation determined by applying dividend capitalization method
comes to $18.21 while the current share price of target Company is $131.02. This means that the
value determined by DCM is less than the current share price trading in the market and is also
overvalued.
Document Page
Business memorandum
Date: 16th April, 2020
To: Doug Mc Millon, CEO Wal-Mart
From: George and Bailey Associates PWC
RE: Evaluation of Business environment and company profitability
It’s an honor to work with the world largest retail company. We have examined the business
environment, organization risk, and also performed the financial analysis as per your request.
Based on the research the following evaluation has been done:
Business environment: Wal-Mart works in a competitive environment where it has to face lots
of challenges to stay on the top position in retail industry. There are many companies in the
retailing industry who are doing amalgamation and using the synergy benefit to reduce the price
of the product. The bargaining powers of consumers are also increasing due to many suppliers
available in the market. Companies also have a threat of new entrants in the industry.
Risk and profitability
The international operation of Wal-Mart has certain risks related to accounting, political, tax,
legal, judicial, economic, and legal risk which could affect the financial or business performance
in the countries in which the company operates. It has been analyzed that in 2019 the profits of
the organization has been decreased to 2.9 percent as compared to previous year. The gross profit
margin also shows a decreasing trend in 2019.
Adjustment required
Company should adhere to compliances laid down by accounting boards to value different assets
of the organization such as inventory, investment, Property, plant, and equipment, building, etc.
The management should not defer the taxes rather pay it in the current year and the liabilities
should be valued by values and experts such as actuaries and financial analysts. Inventories of
the organization should be measured at lower of Net realizable amount or cost.
Growth and future anticipation
It has been examined that the company is focusing on long term strategic investment for making
efficient growth. The total sales in 2018 were 495761 million dollars which was increased to
510329 million dollars. Company is allocating its resources in a strategic way and also utilizing
chevron_up_icon
1 out of 22
circle_padding
hide_on_mobile
zoom_out_icon
[object Object]