Detailed Financial Analysis of Walmart: Income, Balance Sheet, Ratios

Verified

Added on  2022/11/23

|15
|1695
|456
Report
AI Summary
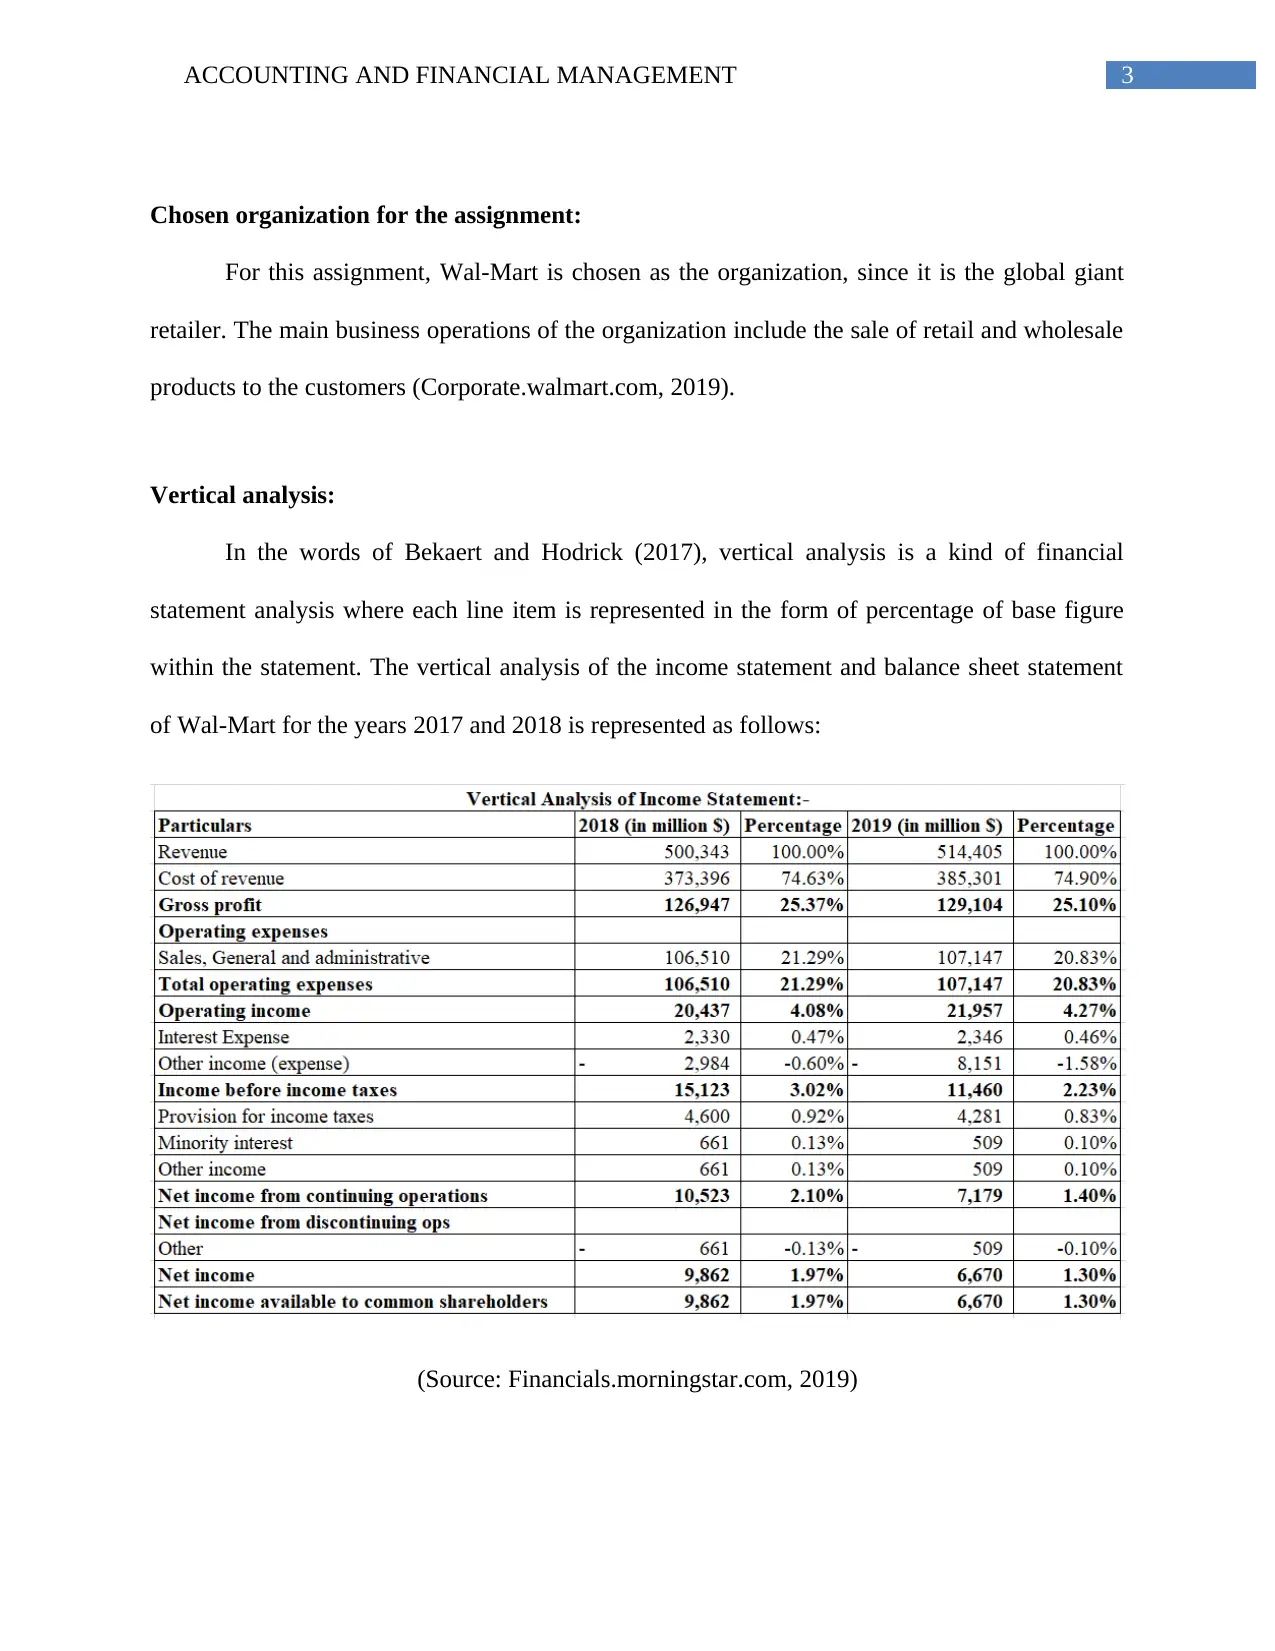
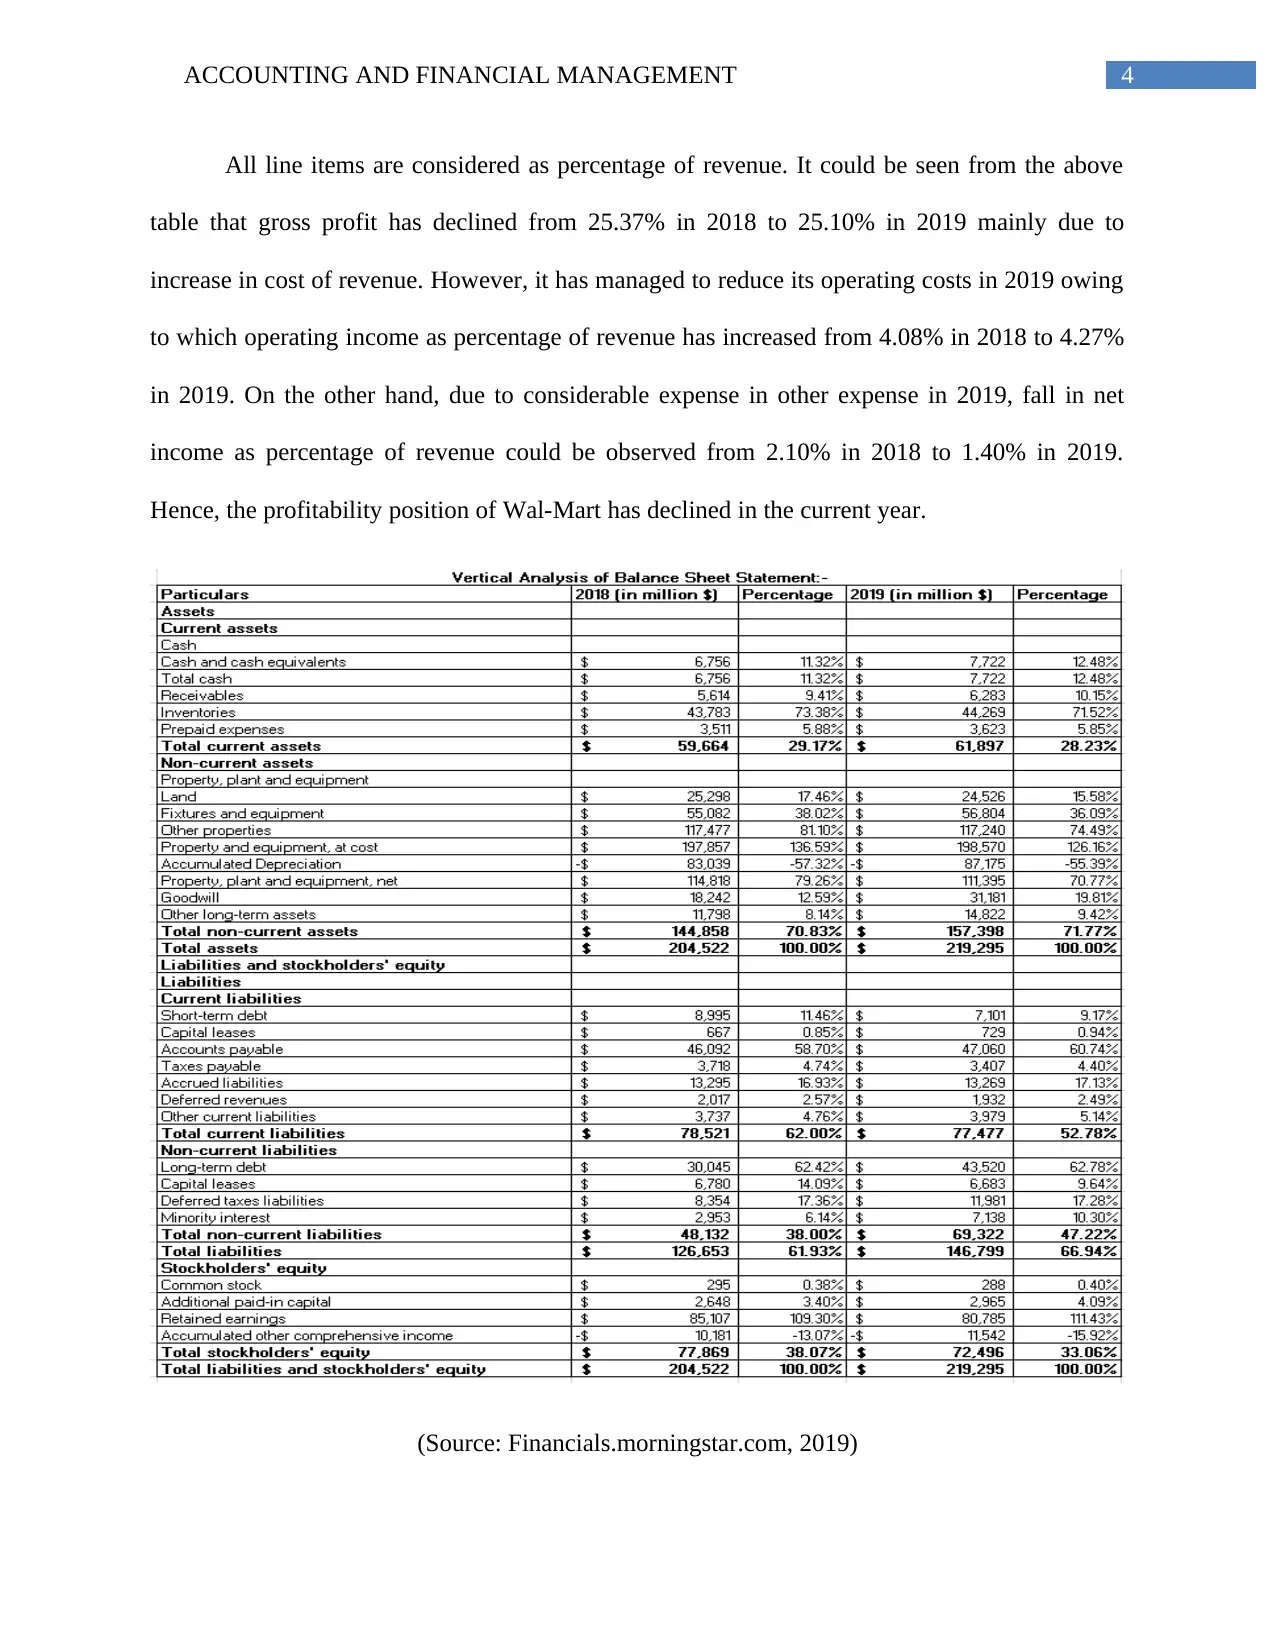
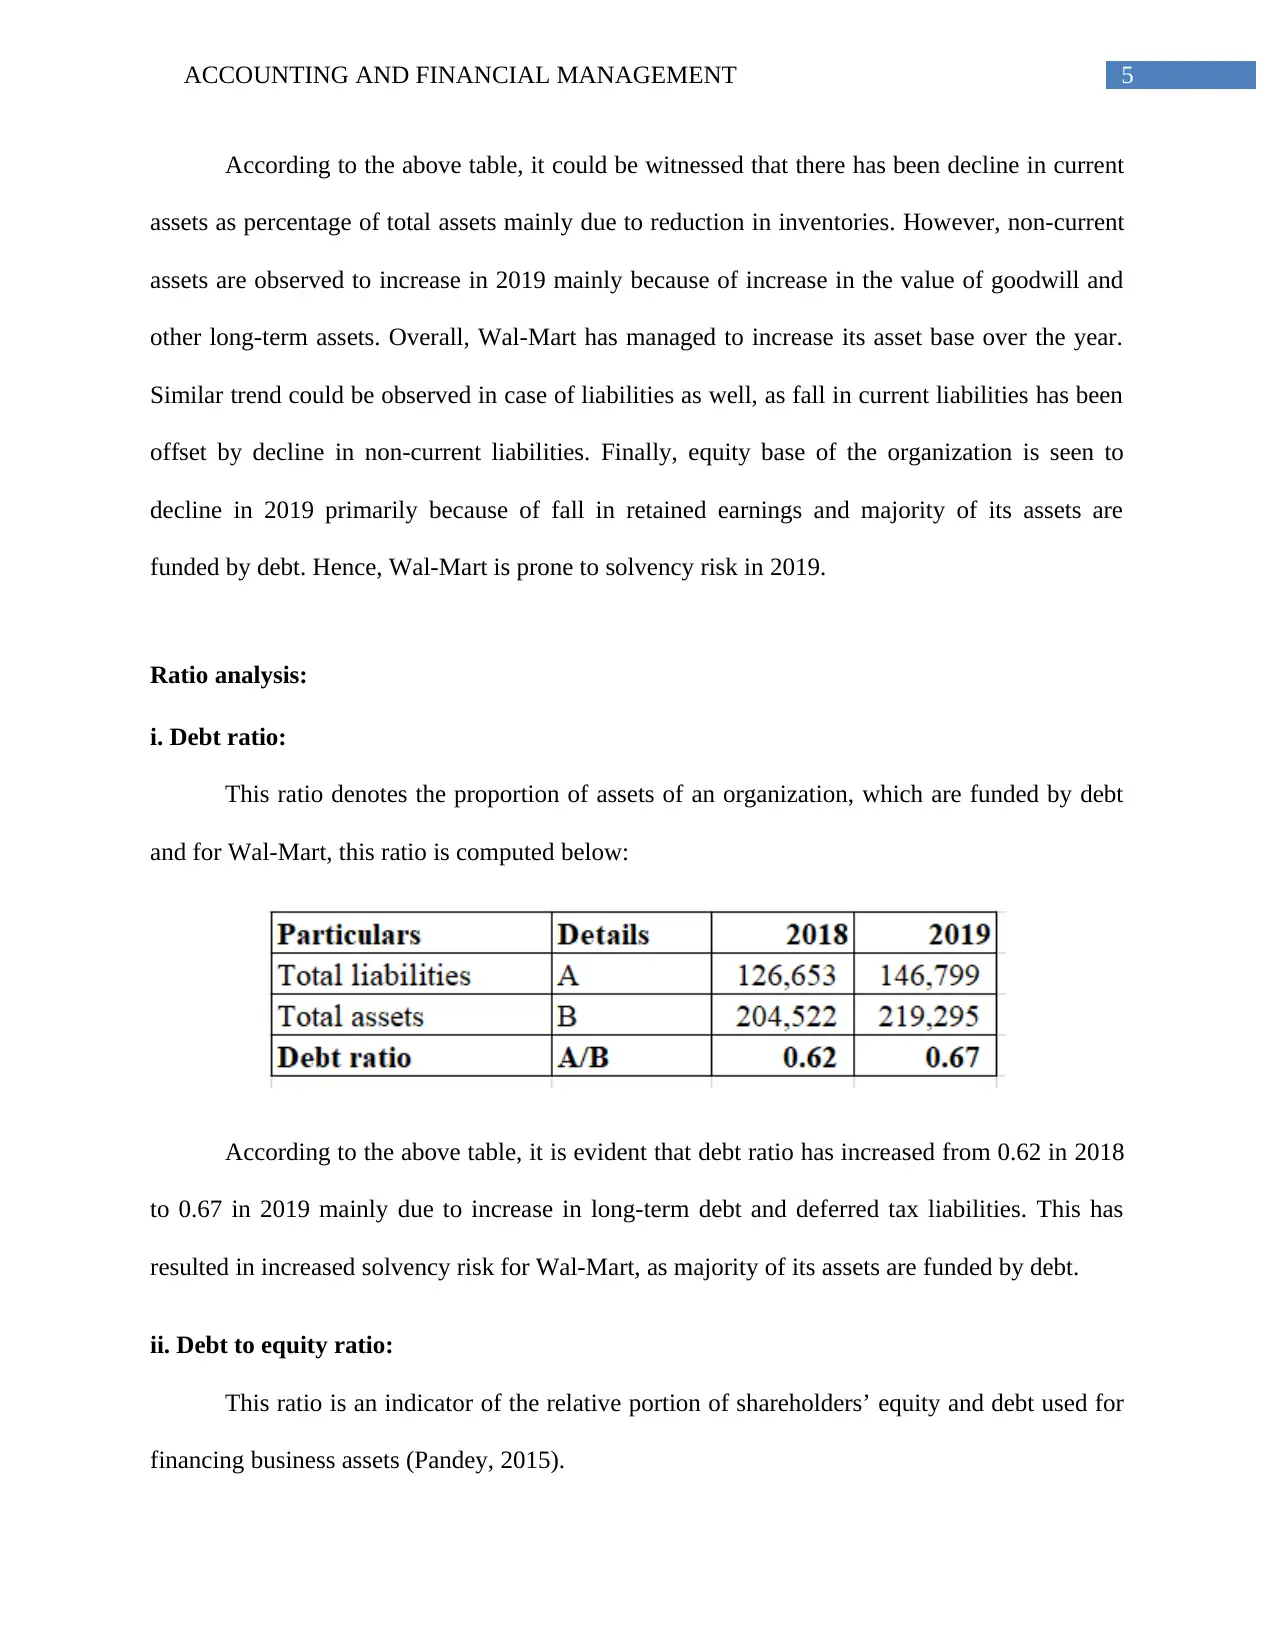
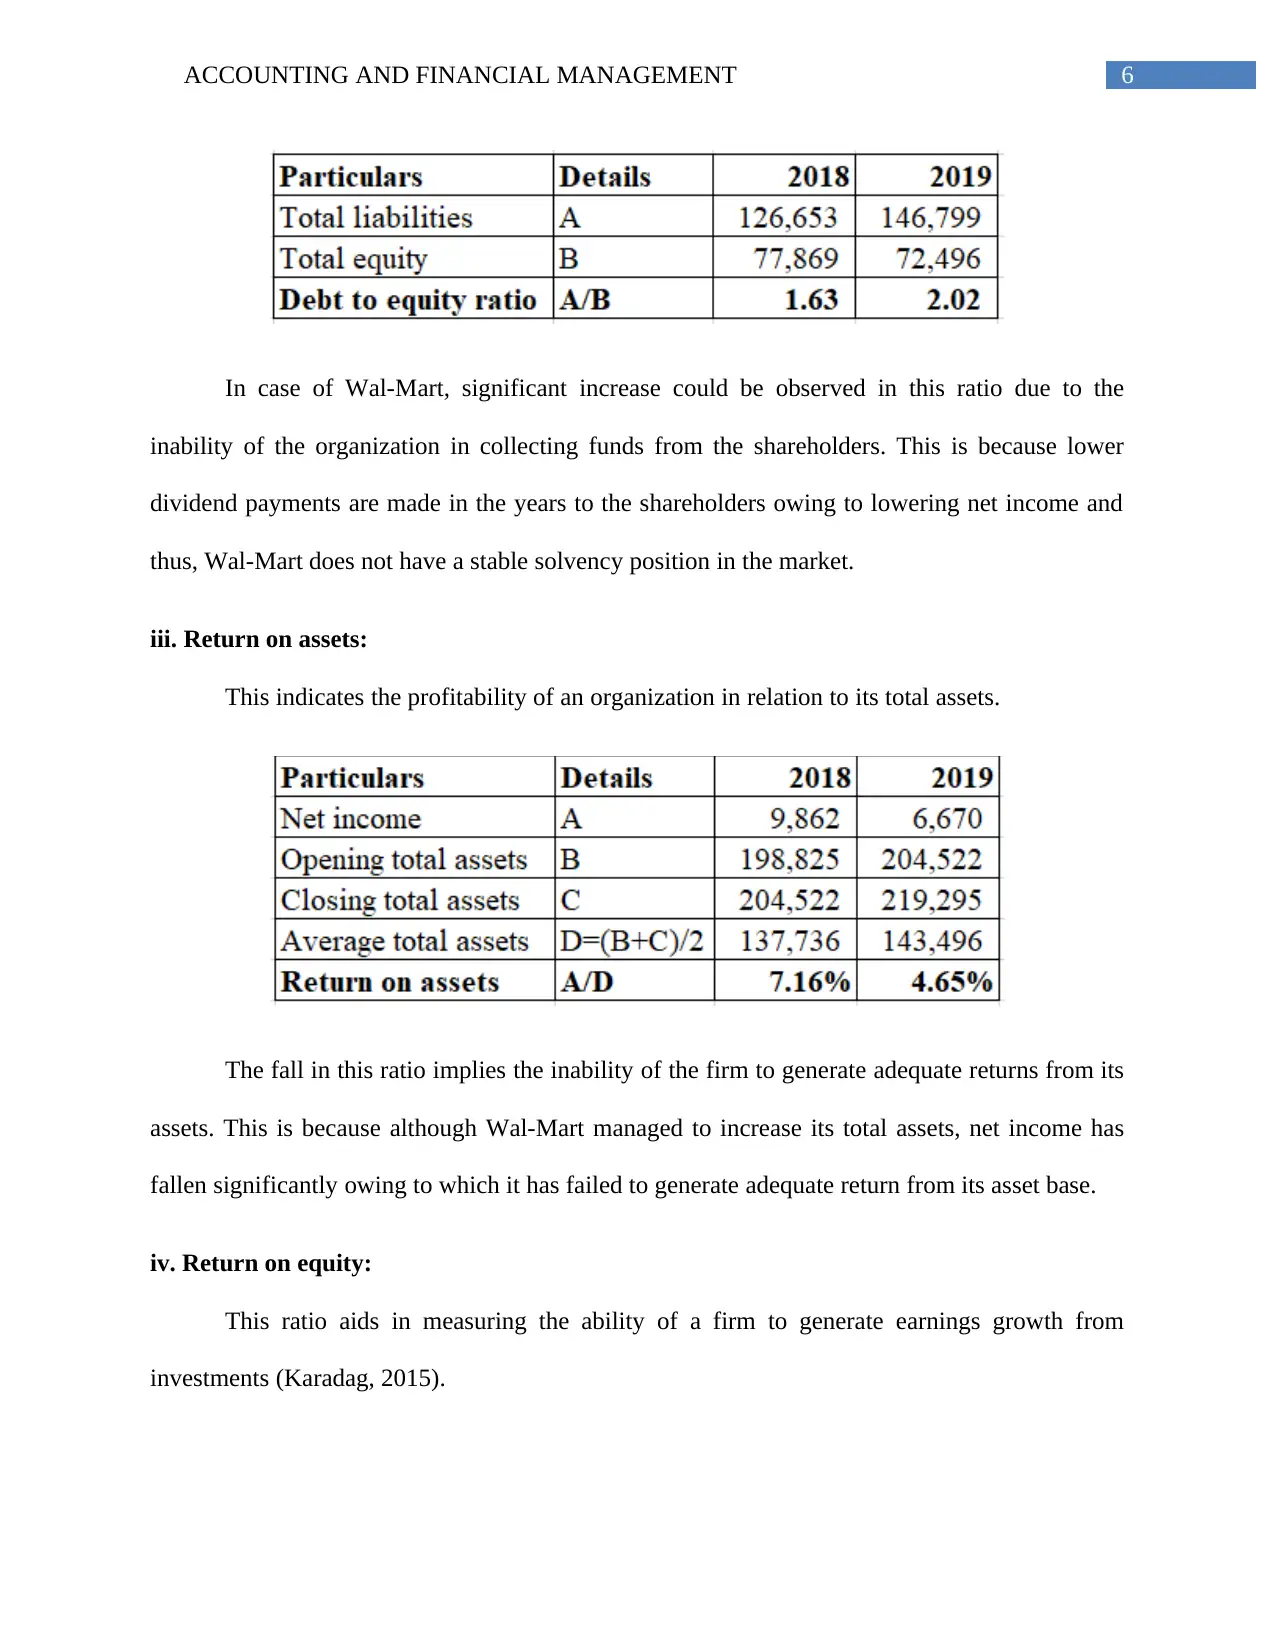
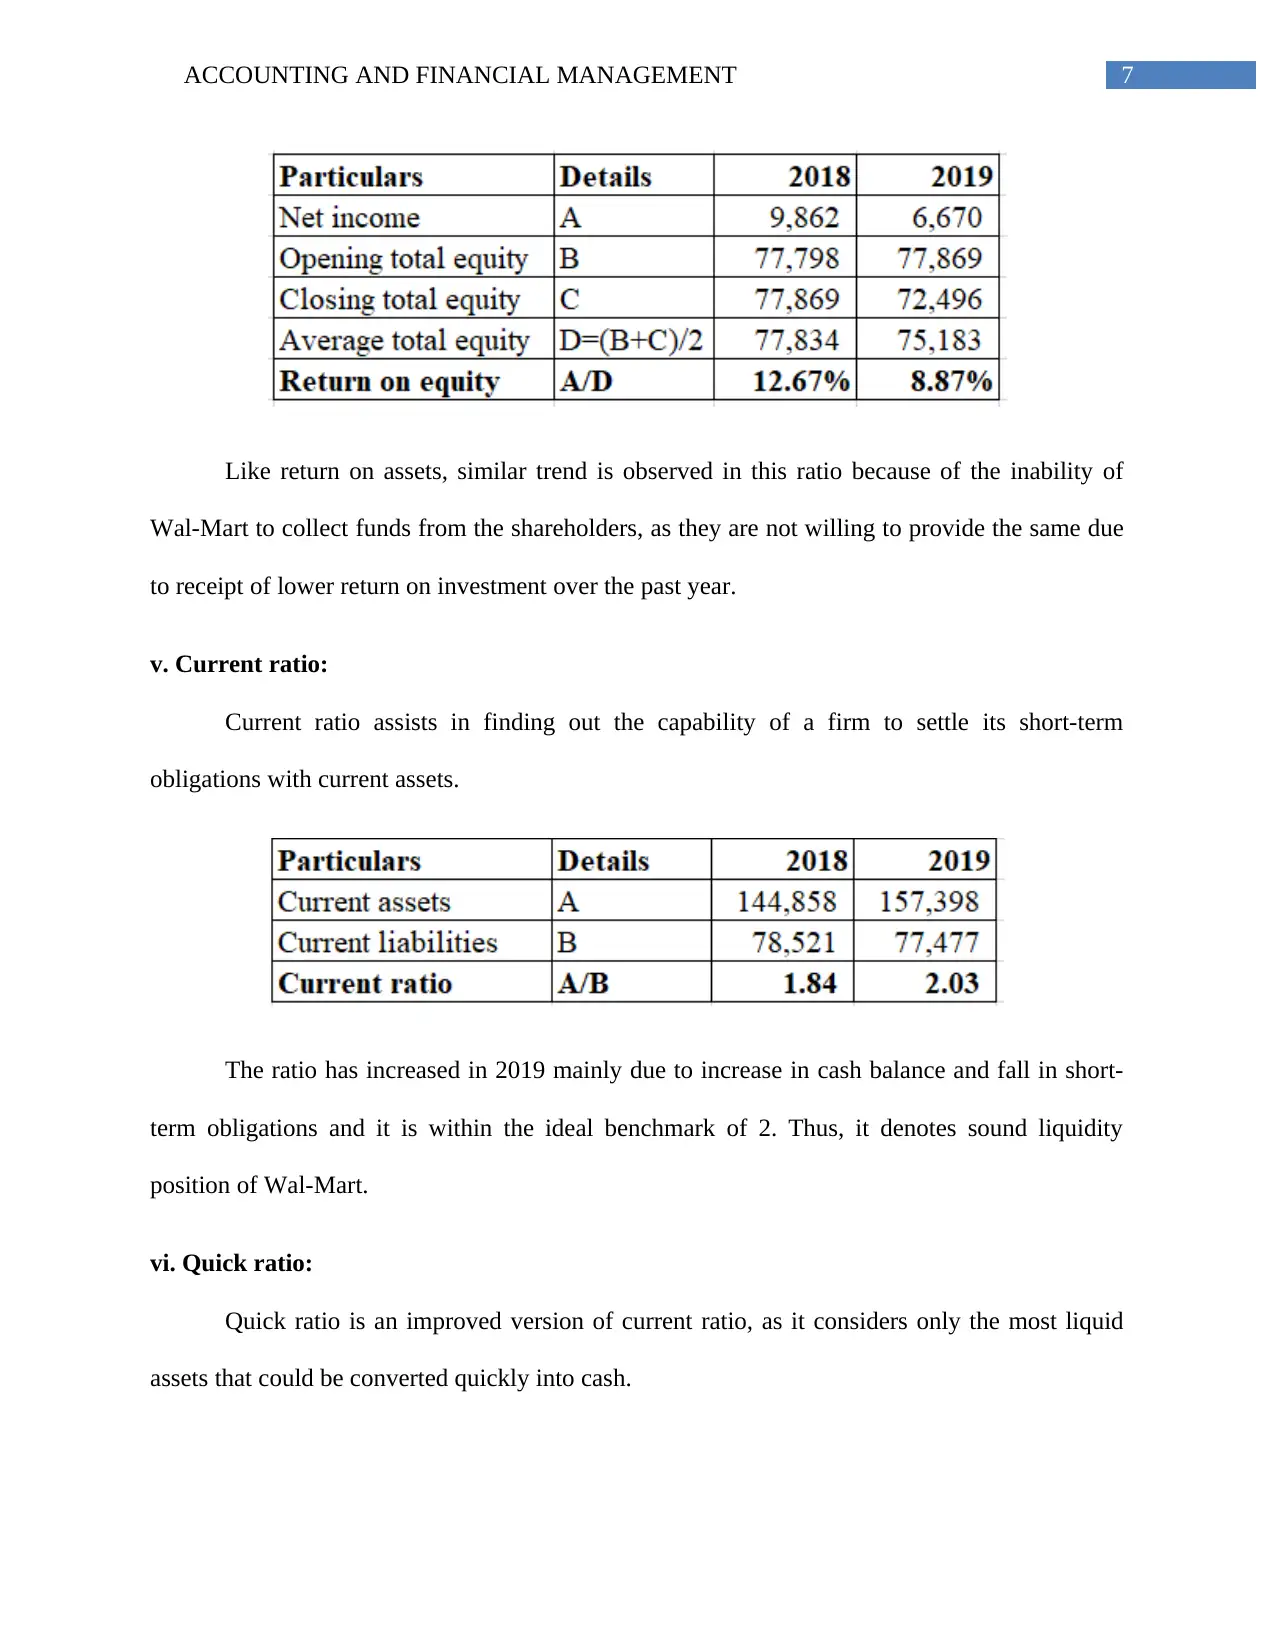
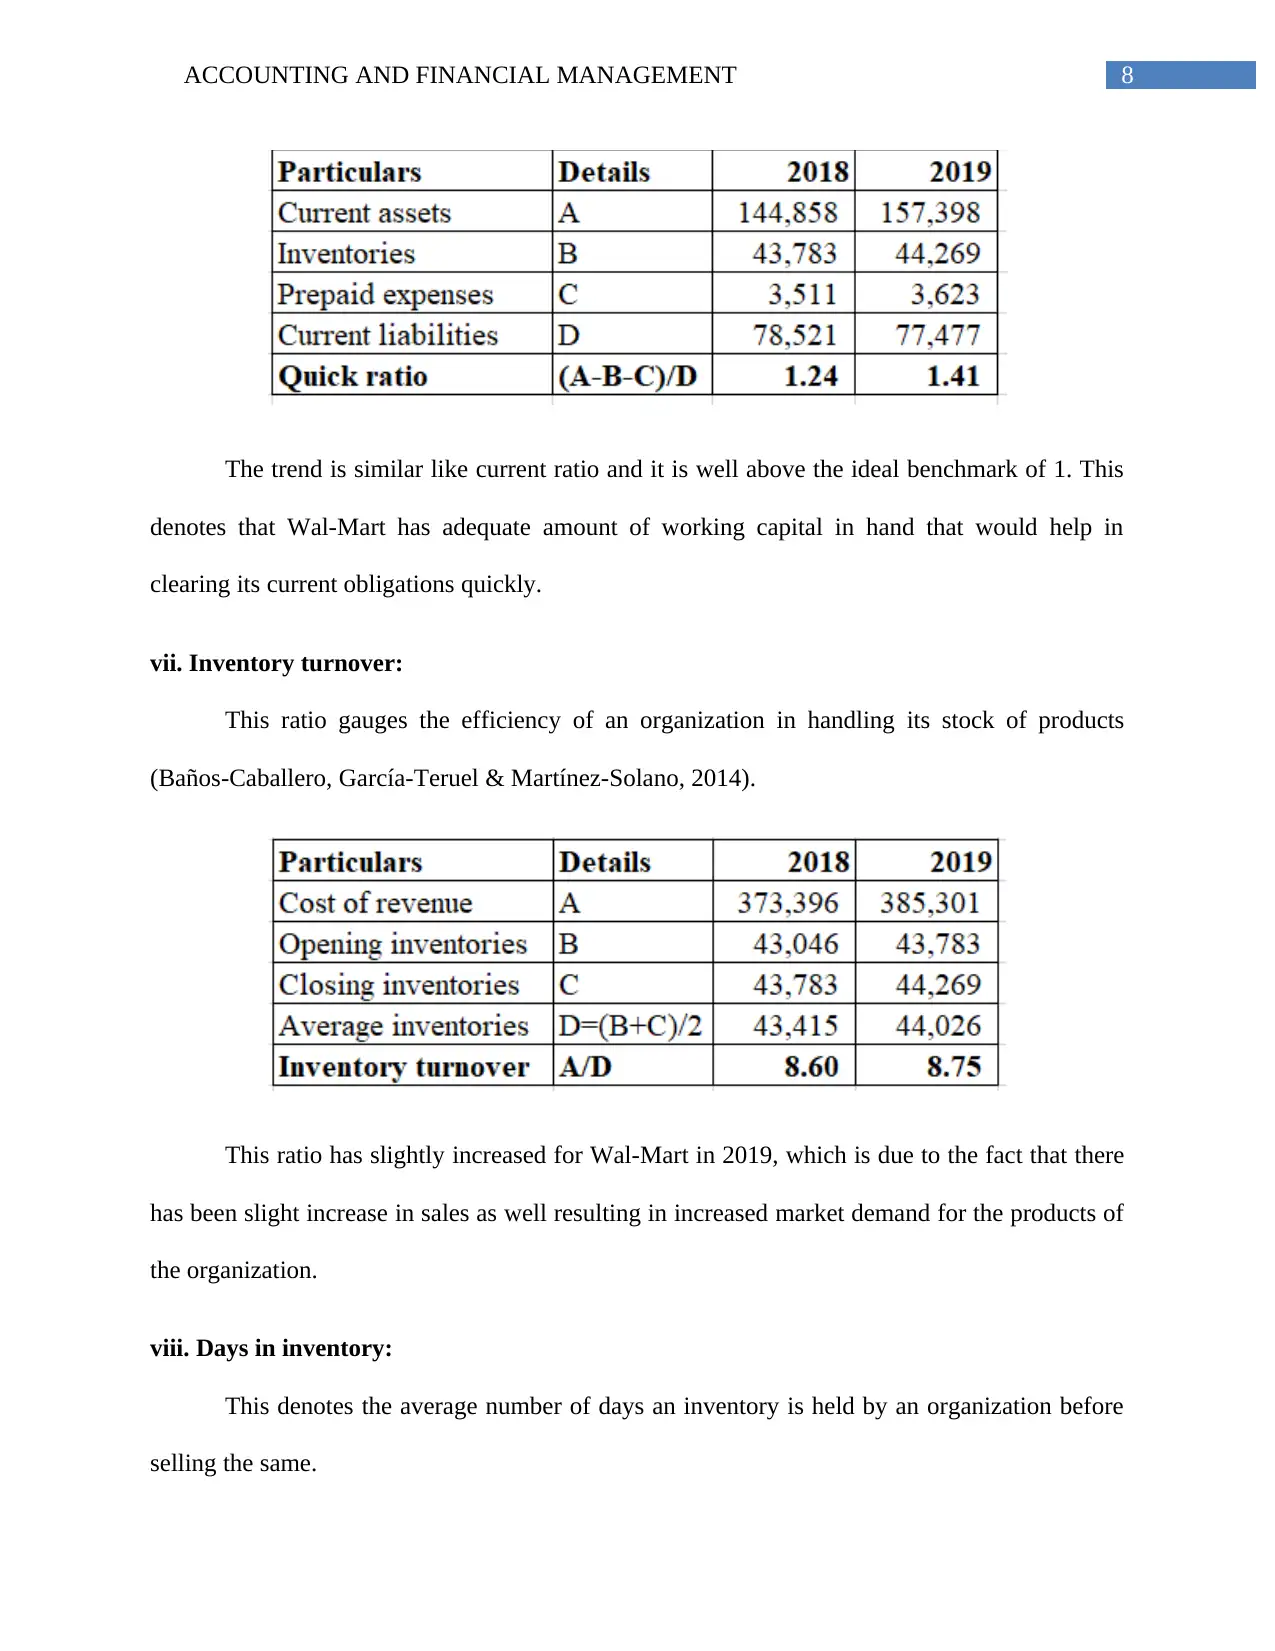
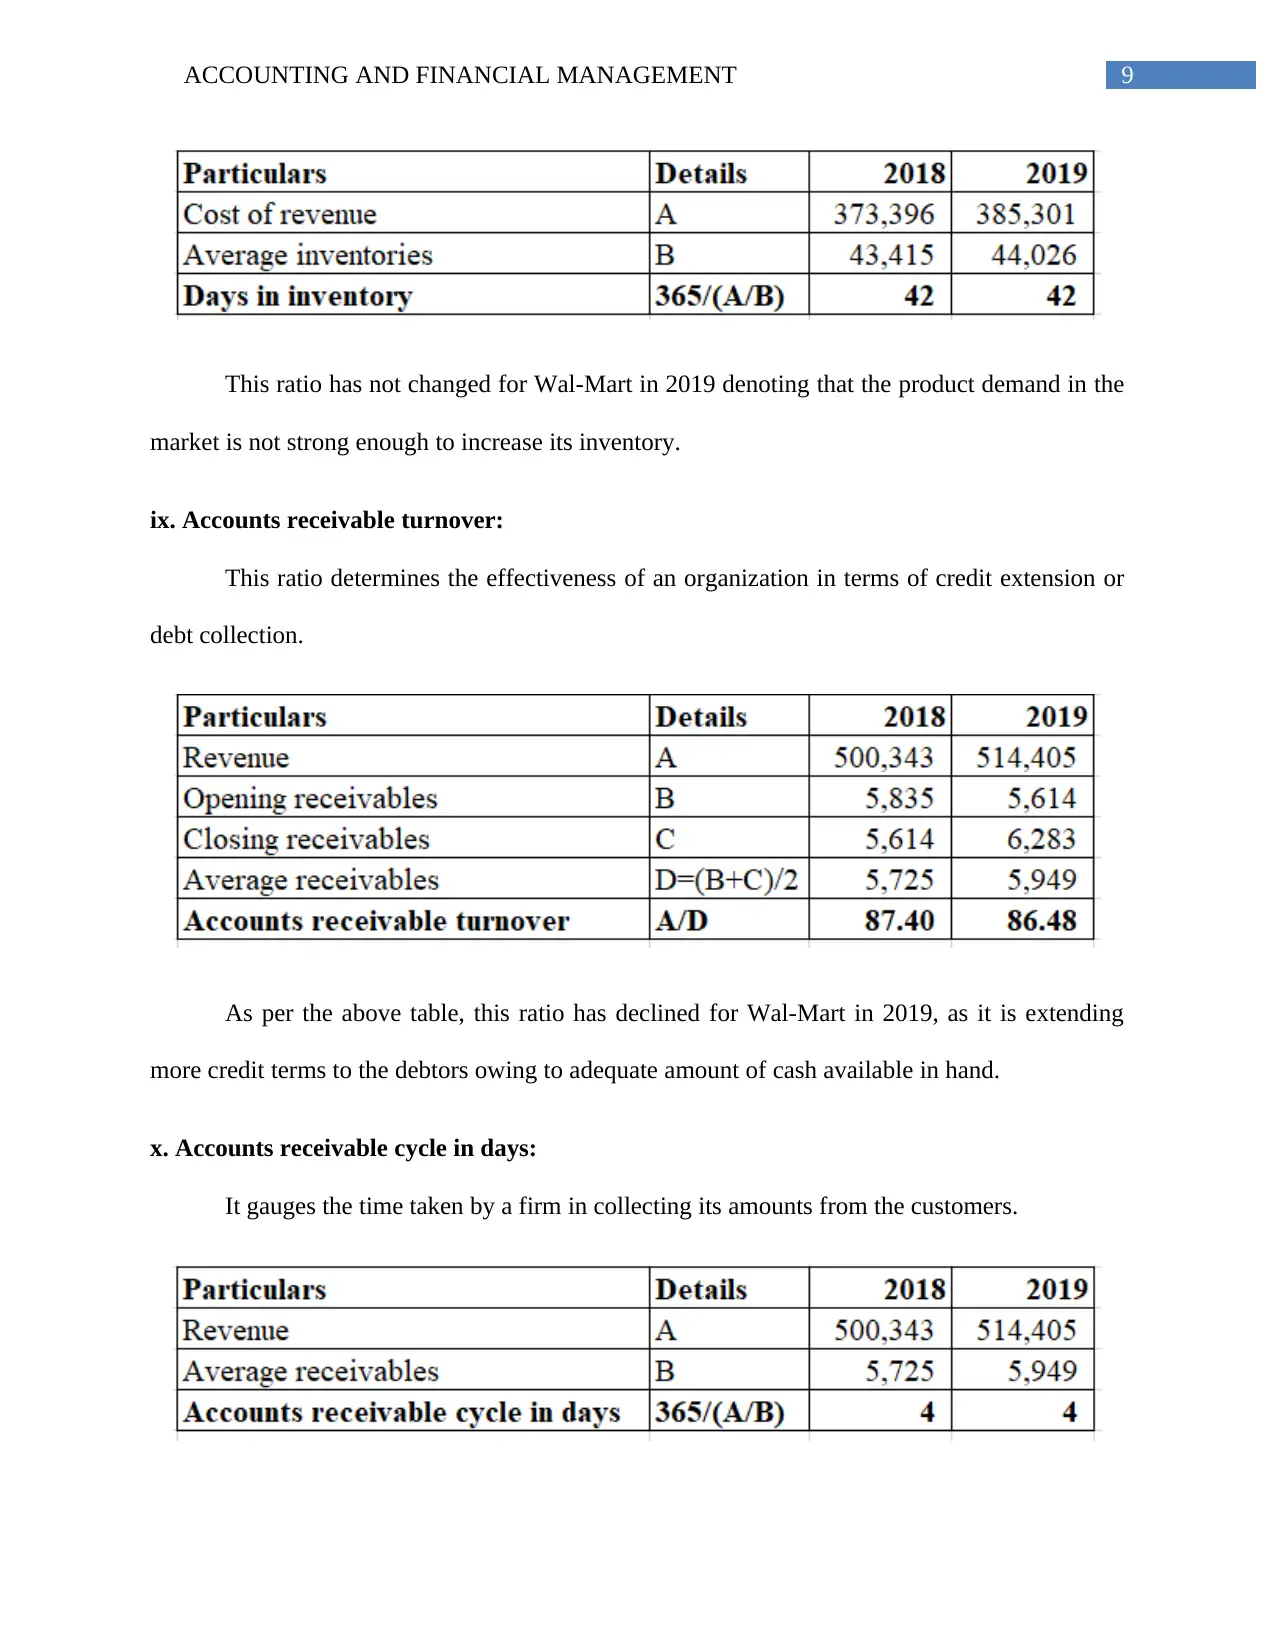
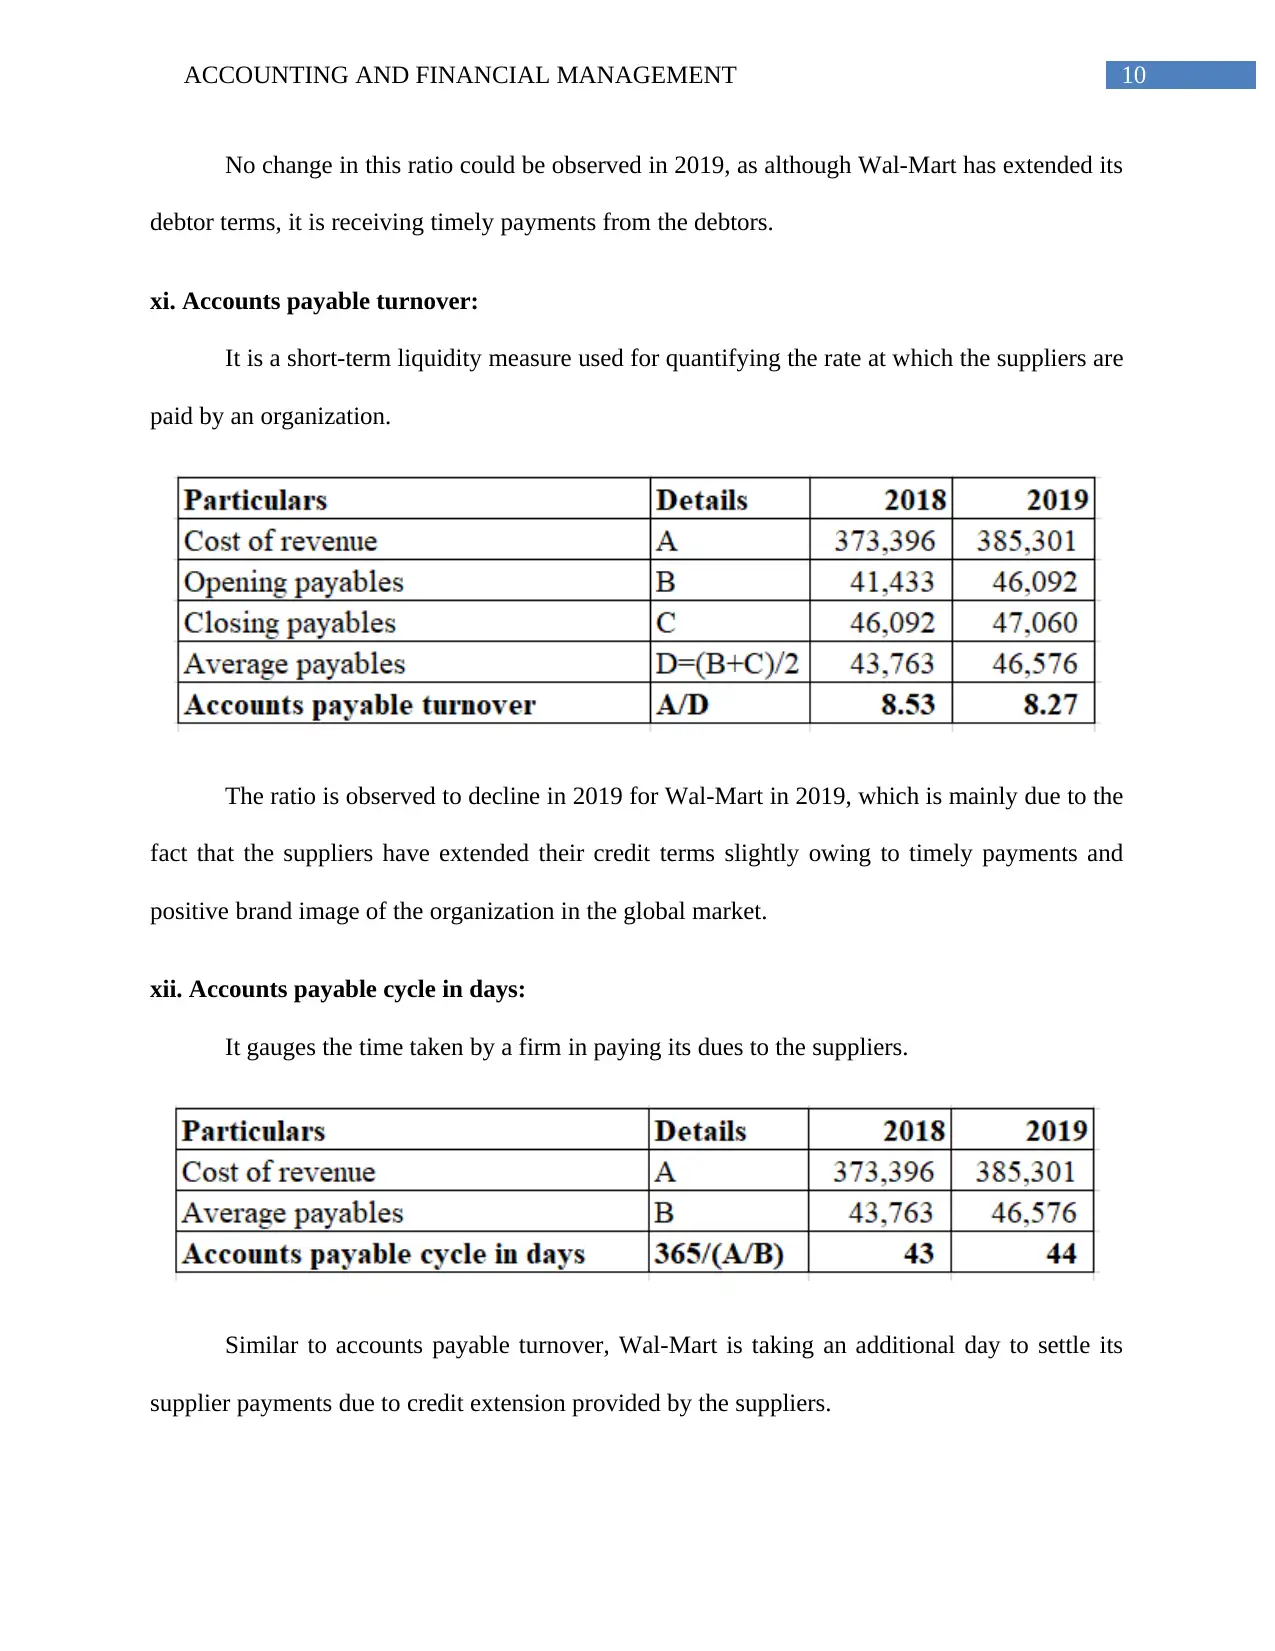
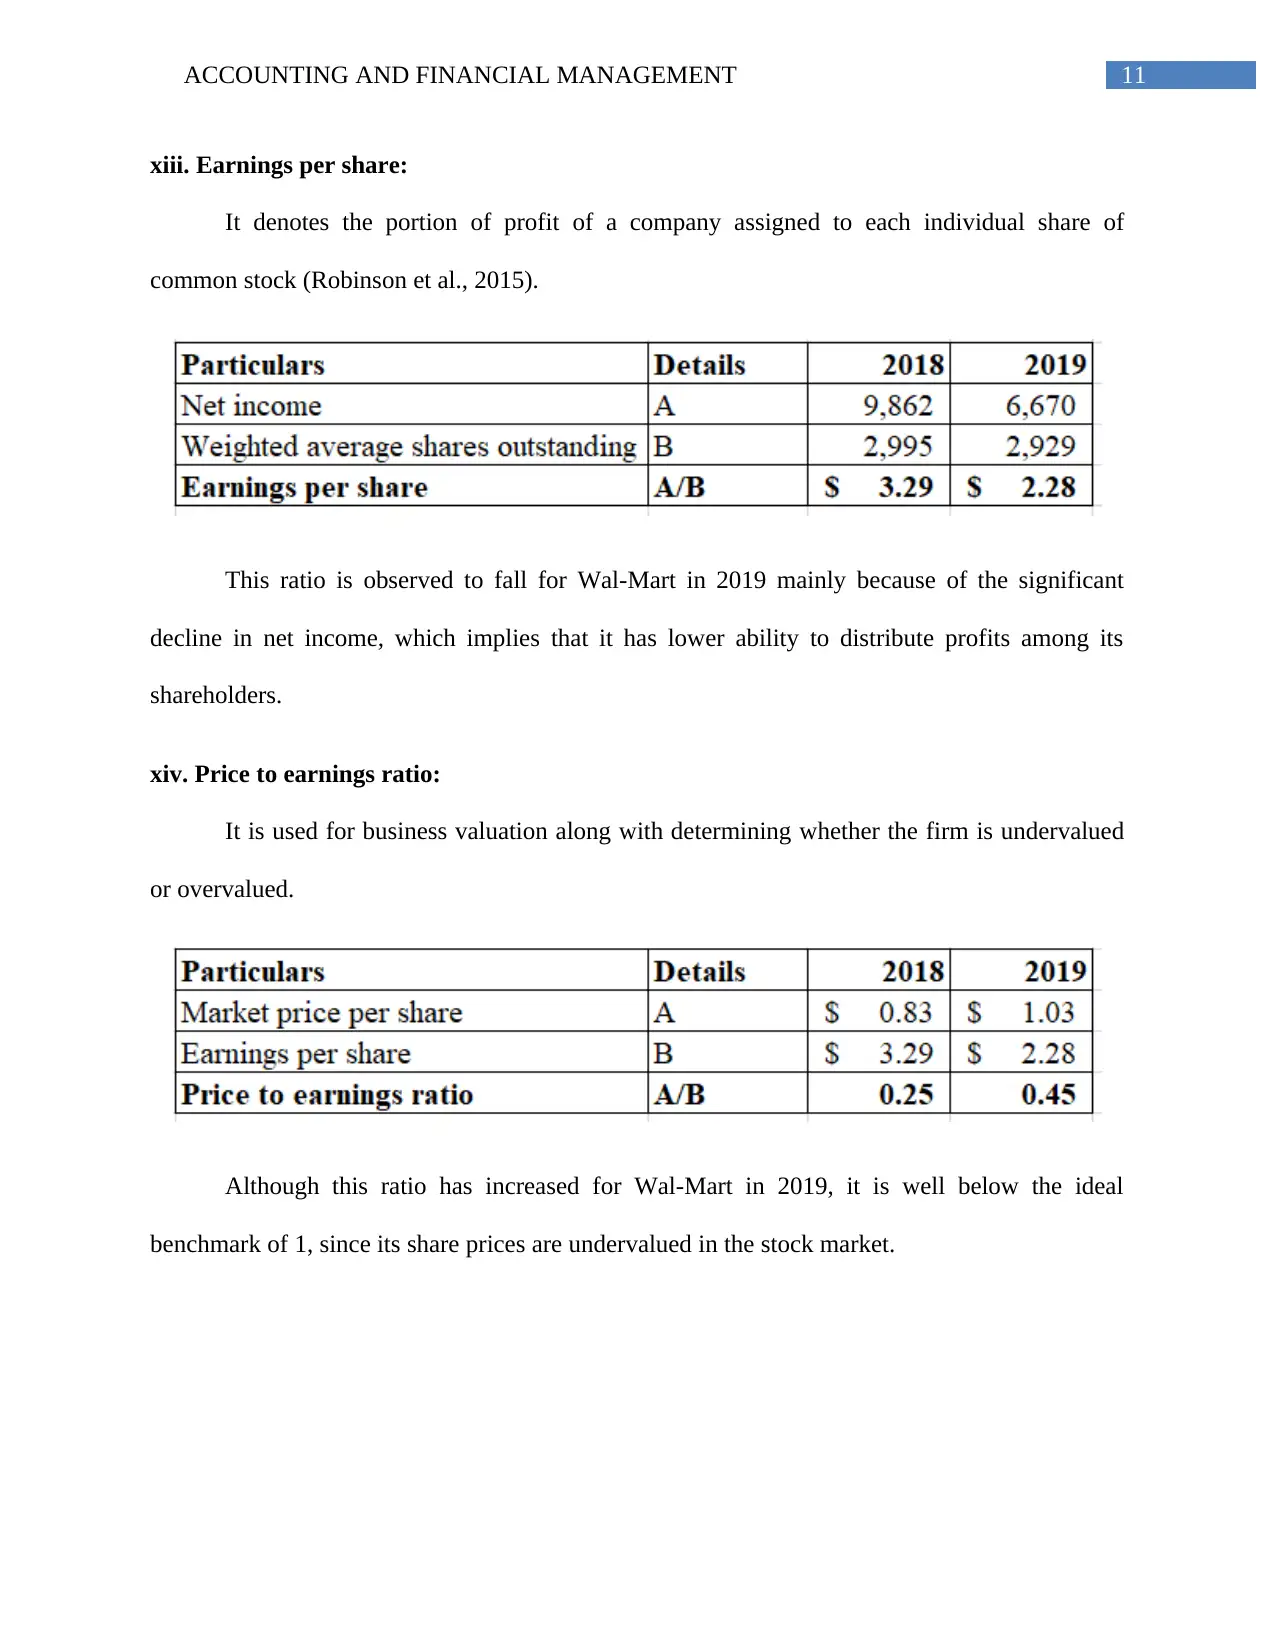
This report presents a financial analysis of Walmart, focusing on the years 2017-2019. The analysis begins with a vertical analysis of the income statement and balance sheet, examining the percentage of each line item relative to a base figure. Key observations include a decline in gross profit and net income as a percentage of revenue, coupled with changes in asset and liability structures. The report then delves into ratio analysis, covering debt ratio, debt-to-equity ratio, return on assets, return on equity, current ratio, quick ratio, inventory turnover, days in inventory, accounts receivable turnover, accounts receivable cycle in days, accounts payable turnover, accounts payable cycle in days, earnings per share, and price-to-earnings ratio. The analysis reveals trends in liquidity, solvency, and profitability, highlighting Walmart's financial position and performance. The report concludes with references and appendices including income statement and balance sheet data.
Document Page
Running head: ACCOUNTING AND FINANCIAL MANAGEMENT
Accounting and Financial Management
Name of the Student:
Name of the University:
Author’s Note:
Course ID:
tabler-icon-diamond-filled.svg

Paraphrase This Document

Need a fresh take? Get an instant paraphrase of this document with our AI Paraphraser
Document Page
1ACCOUNTING AND FINANCIAL MANAGEMENT
Table of Contents
Chosen organization for the assignment:.........................................................................................3
Vertical analysis:.............................................................................................................................3
Ratio analysis:..................................................................................................................................5
i. Debt ratio:.................................................................................................................................5
ii. Debt to equity ratio:.................................................................................................................5
iii. Return on assets:.....................................................................................................................6
iv. Return on equity:....................................................................................................................6
v. Current ratio:............................................................................................................................7
vi. Quick ratio:.............................................................................................................................7
vii. Inventory turnover:................................................................................................................8
viii. Days in inventory:................................................................................................................8
ix. Accounts receivable turnover:................................................................................................9
x. Accounts receivable cycle in days:..........................................................................................9
xi. Accounts payable turnover:..................................................................................................10
xii. Accounts payable cycle in days:..........................................................................................10
xiii. Earnings per share:.............................................................................................................11
xiv. Price to earnings ratio:........................................................................................................11
References:....................................................................................................................................12
Document Page
2ACCOUNTING AND FINANCIAL MANAGEMENT
Appendices:...................................................................................................................................13
Document Page
3ACCOUNTING AND FINANCIAL MANAGEMENT
Chosen organization for the assignment:
For this assignment, Wal-Mart is chosen as the organization, since it is the global giant
retailer. The main business operations of the organization include the sale of retail and wholesale
products to the customers (Corporate.walmart.com, 2019).
Vertical analysis:
In the words of Bekaert and Hodrick (2017), vertical analysis is a kind of financial
statement analysis where each line item is represented in the form of percentage of base figure
within the statement. The vertical analysis of the income statement and balance sheet statement
of Wal-Mart for the years 2017 and 2018 is represented as follows:
(Source: Financials.morningstar.com, 2019)
tabler-icon-diamond-filled.svg

Paraphrase This Document

Need a fresh take? Get an instant paraphrase of this document with our AI Paraphraser
Document Page
4ACCOUNTING AND FINANCIAL MANAGEMENT
All line items are considered as percentage of revenue. It could be seen from the above
table that gross profit has declined from 25.37% in 2018 to 25.10% in 2019 mainly due to
increase in cost of revenue. However, it has managed to reduce its operating costs in 2019 owing
to which operating income as percentage of revenue has increased from 4.08% in 2018 to 4.27%
in 2019. On the other hand, due to considerable expense in other expense in 2019, fall in net
income as percentage of revenue could be observed from 2.10% in 2018 to 1.40% in 2019.
Hence, the profitability position of Wal-Mart has declined in the current year.
(Source: Financials.morningstar.com, 2019)
Document Page
5ACCOUNTING AND FINANCIAL MANAGEMENT
According to the above table, it could be witnessed that there has been decline in current
assets as percentage of total assets mainly due to reduction in inventories. However, non-current
assets are observed to increase in 2019 mainly because of increase in the value of goodwill and
other long-term assets. Overall, Wal-Mart has managed to increase its asset base over the year.
Similar trend could be observed in case of liabilities as well, as fall in current liabilities has been
offset by decline in non-current liabilities. Finally, equity base of the organization is seen to
decline in 2019 primarily because of fall in retained earnings and majority of its assets are
funded by debt. Hence, Wal-Mart is prone to solvency risk in 2019.
Ratio analysis:
i. Debt ratio:
This ratio denotes the proportion of assets of an organization, which are funded by debt
and for Wal-Mart, this ratio is computed below:
According to the above table, it is evident that debt ratio has increased from 0.62 in 2018
to 0.67 in 2019 mainly due to increase in long-term debt and deferred tax liabilities. This has
resulted in increased solvency risk for Wal-Mart, as majority of its assets are funded by debt.
ii. Debt to equity ratio:
This ratio is an indicator of the relative portion of shareholders’ equity and debt used for
financing business assets (Pandey, 2015).
Document Page
6ACCOUNTING AND FINANCIAL MANAGEMENT
In case of Wal-Mart, significant increase could be observed in this ratio due to the
inability of the organization in collecting funds from the shareholders. This is because lower
dividend payments are made in the years to the shareholders owing to lowering net income and
thus, Wal-Mart does not have a stable solvency position in the market.
iii. Return on assets:
This indicates the profitability of an organization in relation to its total assets.
The fall in this ratio implies the inability of the firm to generate adequate returns from its
assets. This is because although Wal-Mart managed to increase its total assets, net income has
fallen significantly owing to which it has failed to generate adequate return from its asset base.
iv. Return on equity:
This ratio aids in measuring the ability of a firm to generate earnings growth from
investments (Karadag, 2015).
tabler-icon-diamond-filled.svg

Paraphrase This Document

Need a fresh take? Get an instant paraphrase of this document with our AI Paraphraser
Document Page
7ACCOUNTING AND FINANCIAL MANAGEMENT
Like return on assets, similar trend is observed in this ratio because of the inability of
Wal-Mart to collect funds from the shareholders, as they are not willing to provide the same due
to receipt of lower return on investment over the past year.
v. Current ratio:
Current ratio assists in finding out the capability of a firm to settle its short-term
obligations with current assets.
The ratio has increased in 2019 mainly due to increase in cash balance and fall in short-
term obligations and it is within the ideal benchmark of 2. Thus, it denotes sound liquidity
position of Wal-Mart.
vi. Quick ratio:
Quick ratio is an improved version of current ratio, as it considers only the most liquid
assets that could be converted quickly into cash.
Document Page
8ACCOUNTING AND FINANCIAL MANAGEMENT
The trend is similar like current ratio and it is well above the ideal benchmark of 1. This
denotes that Wal-Mart has adequate amount of working capital in hand that would help in
clearing its current obligations quickly.
vii. Inventory turnover:
This ratio gauges the efficiency of an organization in handling its stock of products
(Baños-Caballero, García-Teruel & Martínez-Solano, 2014).
This ratio has slightly increased for Wal-Mart in 2019, which is due to the fact that there
has been slight increase in sales as well resulting in increased market demand for the products of
the organization.
viii. Days in inventory:
This denotes the average number of days an inventory is held by an organization before
selling the same.
Document Page
9ACCOUNTING AND FINANCIAL MANAGEMENT
This ratio has not changed for Wal-Mart in 2019 denoting that the product demand in the
market is not strong enough to increase its inventory.
ix. Accounts receivable turnover:
This ratio determines the effectiveness of an organization in terms of credit extension or
debt collection.
As per the above table, this ratio has declined for Wal-Mart in 2019, as it is extending
more credit terms to the debtors owing to adequate amount of cash available in hand.
x. Accounts receivable cycle in days:
It gauges the time taken by a firm in collecting its amounts from the customers.
tabler-icon-diamond-filled.svg

Paraphrase This Document

Need a fresh take? Get an instant paraphrase of this document with our AI Paraphraser
Document Page
10ACCOUNTING AND FINANCIAL MANAGEMENT
No change in this ratio could be observed in 2019, as although Wal-Mart has extended its
debtor terms, it is receiving timely payments from the debtors.
xi. Accounts payable turnover:
It is a short-term liquidity measure used for quantifying the rate at which the suppliers are
paid by an organization.
The ratio is observed to decline in 2019 for Wal-Mart in 2019, which is mainly due to the
fact that the suppliers have extended their credit terms slightly owing to timely payments and
positive brand image of the organization in the global market.
xii. Accounts payable cycle in days:
It gauges the time taken by a firm in paying its dues to the suppliers.
Similar to accounts payable turnover, Wal-Mart is taking an additional day to settle its
supplier payments due to credit extension provided by the suppliers.
Document Page
11ACCOUNTING AND FINANCIAL MANAGEMENT
xiii. Earnings per share:
It denotes the portion of profit of a company assigned to each individual share of
common stock (Robinson et al., 2015).
This ratio is observed to fall for Wal-Mart in 2019 mainly because of the significant
decline in net income, which implies that it has lower ability to distribute profits among its
shareholders.
xiv. Price to earnings ratio:
It is used for business valuation along with determining whether the firm is undervalued
or overvalued.
Although this ratio has increased for Wal-Mart in 2019, it is well below the ideal
benchmark of 1, since its share prices are undervalued in the stock market.
chevron_up_icon
1 out of 15
circle_padding
hide_on_mobile
zoom_out_icon
[object Object]