Financial Analysis of Walmart and Tesco: A Comparative Report
VerifiedAdded on 2020/07/23
|26
|3672
|56
Report
AI Summary
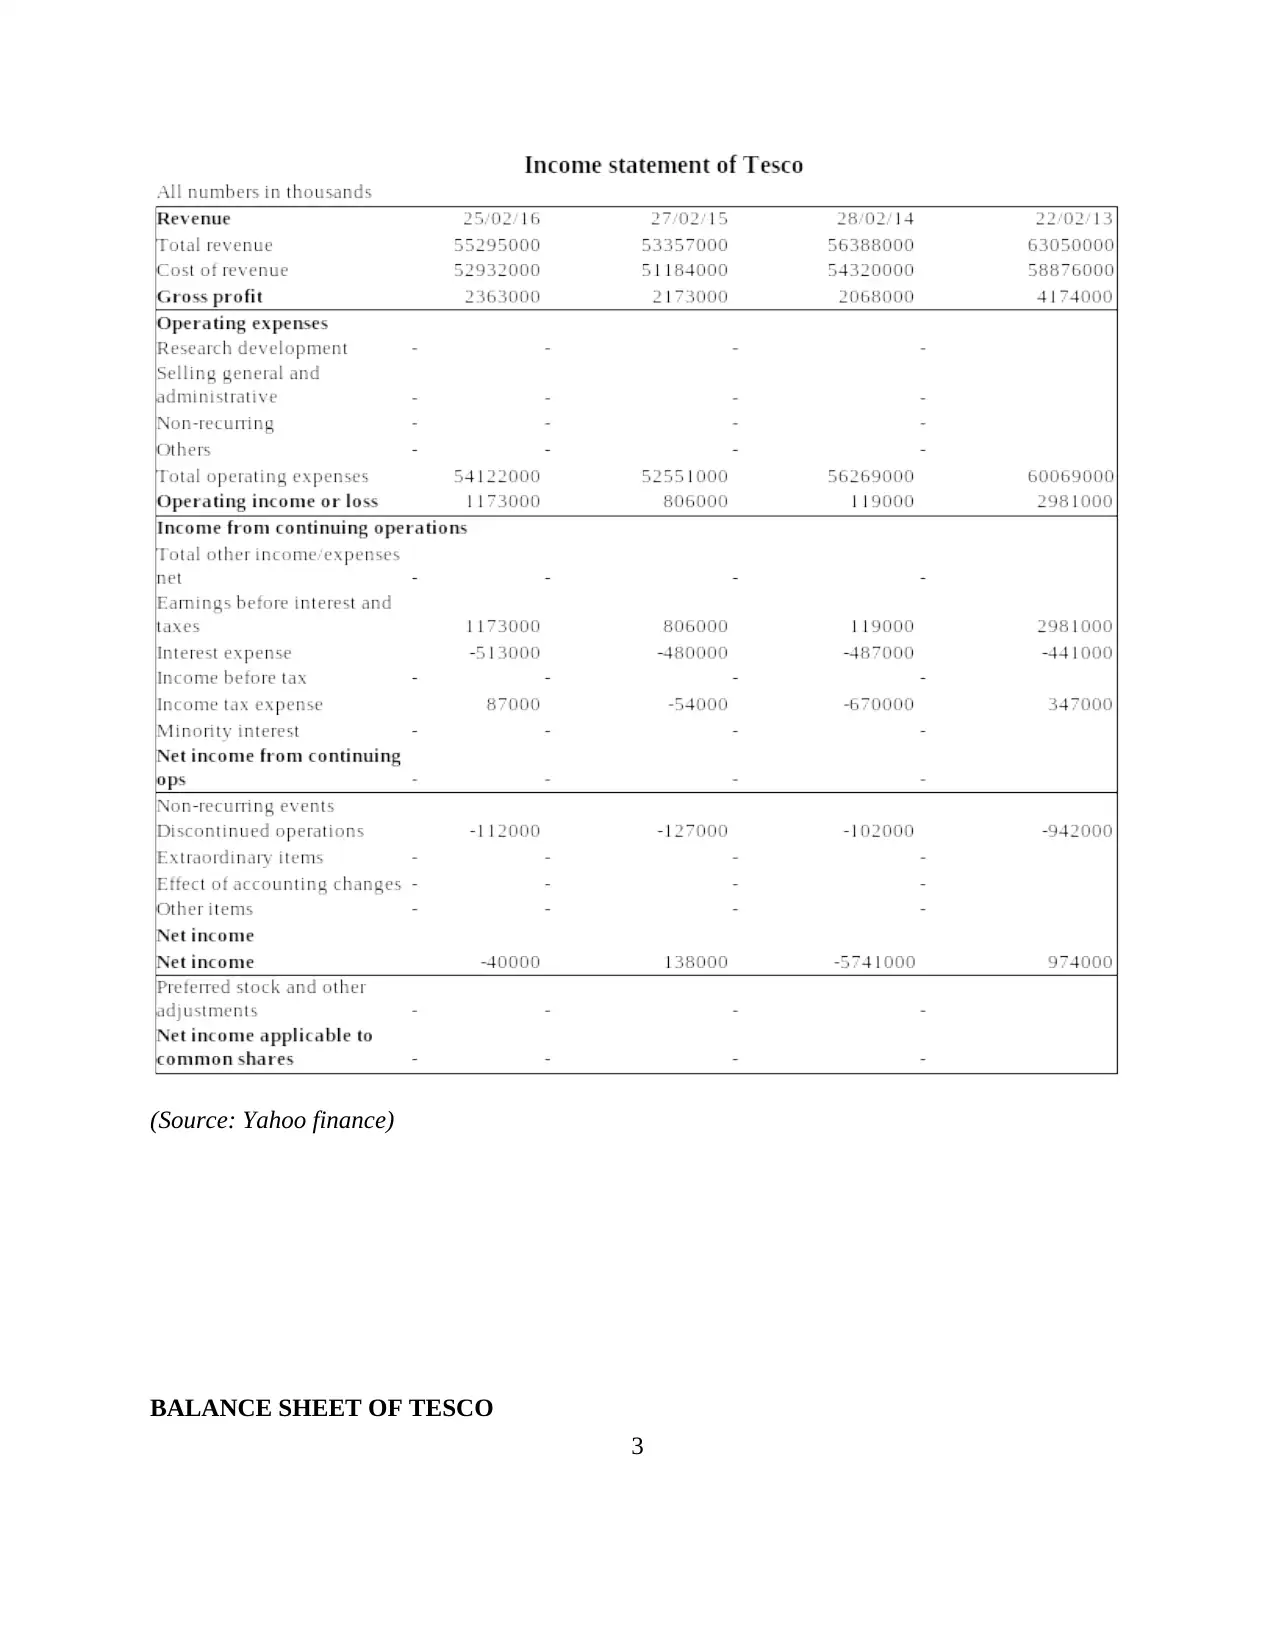
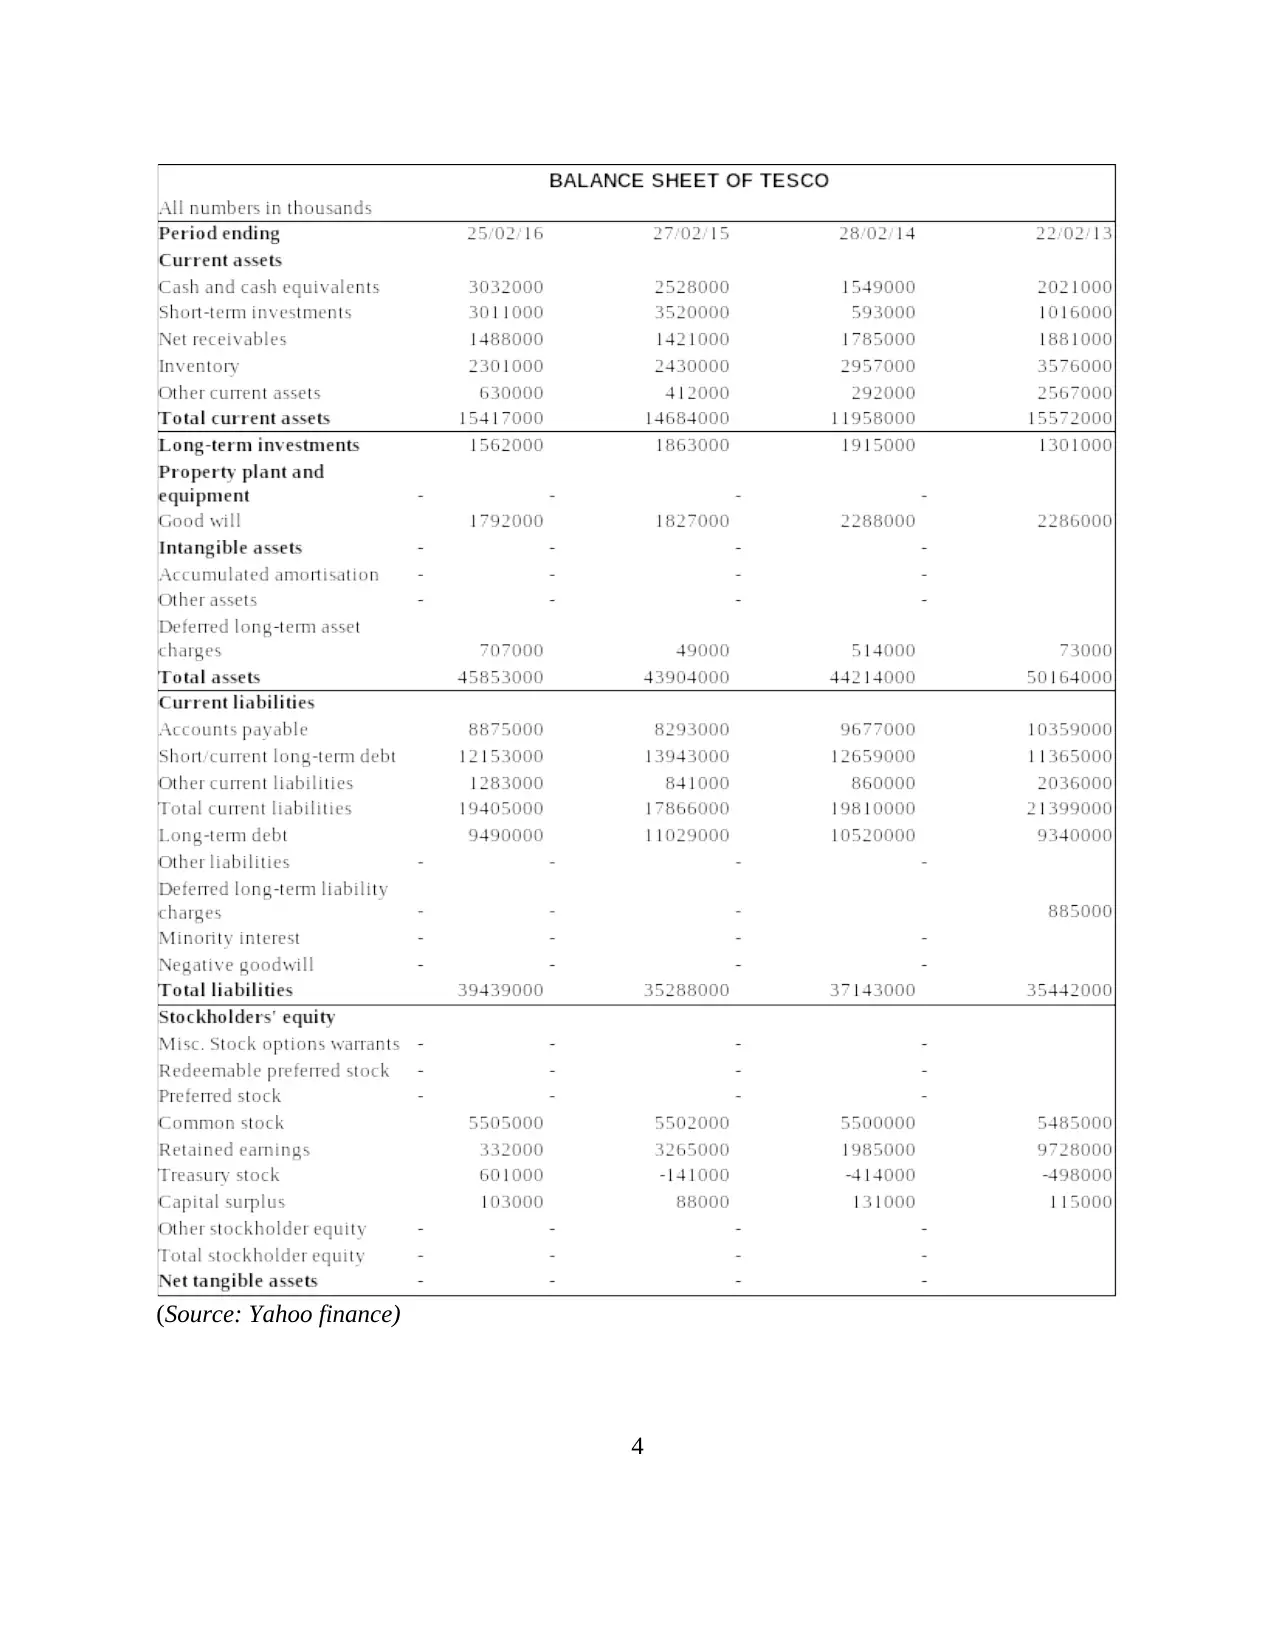
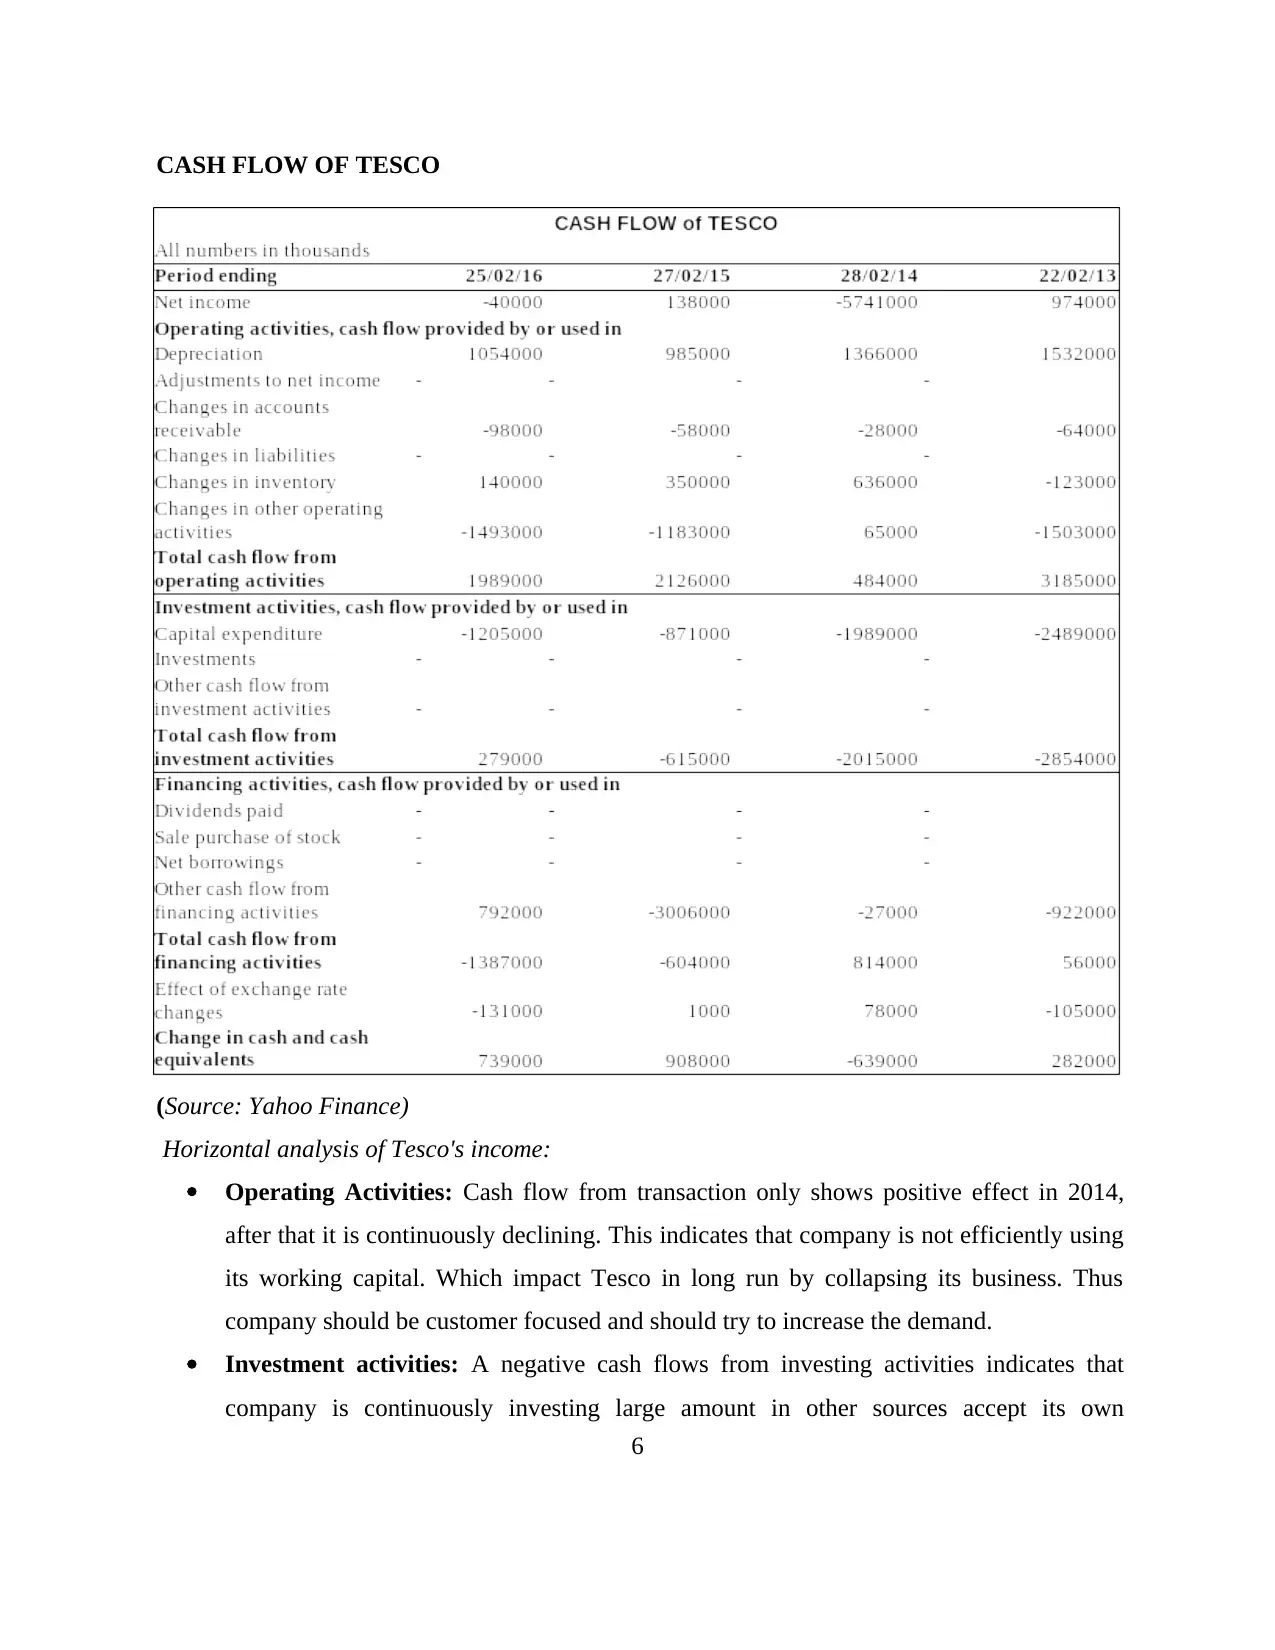
This report provides a detailed financial analysis of Walmart and Tesco, two major multinational retailers. It begins with an introduction to both companies, outlining their market positions and revenues. The core of the report involves a comparative analysis of their financial performance and financial position, utilizing horizontal and vertical analyses of their income statements, balance sheets, and cash flow statements from 2013 to 2016. Key financial metrics such as total revenue, net income, interest expenses, gross profit, current assets, and current liabilities are examined to assess each company's performance. The report also evaluates the working capital and cash flow of both companies to determine their operational efficiency and liquidity. The analysis includes a table summarizing the comparison between Tesco and Walmart based on various financial factors. The conclusion highlights Walmart's stronger financial position compared to Tesco based on the analysis. Overall, the report provides a comprehensive overview of the financial health and performance of both companies during the specified period.

Financial Analysis
Management
&
Entrepreneurship
Management
&
Entrepreneurship
Paraphrase This Document
Need a fresh take? Get an instant paraphrase of this document with our AI Paraphraser

Table of Contents
INTRODUCTION...........................................................................................................................1
1 Evaluation of the financial performance and financial position of Walmart and Tesco..........1
2. Evaluation of the Working Capital.......................................................................................19
3. Evaluation of cash flow.........................................................................................................20
CONCLUSION..............................................................................................................................22
REFERENCES..............................................................................................................................23

INTRODUCTION
In this report, analyses of the financial performances of two companies Walmart and
Tesco has been done. Both company has compared through ratio analysis and vertical and
horizontal analysis of both the companies. Their working capital has been evaluated in this
report, to find the efficiency of Walmart and Tesco during operations. Cash flow analysis will
recommend which company is more liquid.
Walmart is an American transnational selling corp that run as a chain of supermarket and
deduction division stores. It has 11.695 stores and approaches to 28 countries. Its has
approximate revenue of $480 billion. Tesco is also a British multinational grocery retailer as like
Walmart. It is leaded by Walmart in total number of stores. Because Tesco has only 7000 stores
across the countries. It has recorded $73.59 billion as a revenue at the end of 2016. So again
Walmart is leading with $480 billion revenue which is 5 times greater than TESCO.
1 Evaluation of the financial performance and financial position of Walmart and Tesco
To understand the value a company, investors have to look firm's financial positions
(Burns, 2010). Financial analysis involves the use of financial statements, horizontal and vertical
analysis, ratio analysis, etc. to find the actual positions of two companies. Financial statements
consists Income Statement, cash flow statement and Balance sheet of a company. Below is the
financial statements of Tesco and Walmart over 4 years from 2013 to 2016:
Horizontal Analysis of TESCO's income statement:
Total Revenue: Company's total revenue is declining continuously from 2013 to 2014 as
in 2013 it records approx $63 billion revenue which decline in 2014 by approx 11% and
2015 it again records approx 5% shortfall in revenues. But due to implementing attractive
strategies its revenue again increased approx 4.2%. Still Tesco needs more improvement.
It should increase advertisements, improve its quality services and should examine the
market.
Interest Expenses: Tesco's paying more interest on its debts, as from the figure it is
clearly shown that its besides decreasing in its total revenue, its interest expenses is
increasing continuously. Which indicates that the company is utilizing more funds
comparing to previous years. So it can use these funds either in the expansion of the
1
⊘ This is a preview!⊘
Do you want full access?
Subscribe today to unlock all pages.

Trusted by 1+ million students worldwide

business or in promotion. But Tesco has declining revenues thus it is clear that company
has invested its debt funds in opening new stores.
Net Income: Tesco's net income is not stable. As company is only earning profit in 2013
and 2015. But it has incurred huge loss in 2014 which is approx $5.74 billion. It indicates
that company was fail to control its costs of goods sold and other operating expenses with
the decline in Total revenues.
2
Paraphrase This Document
Need a fresh take? Get an instant paraphrase of this document with our AI Paraphraser

(Source: Yahoo finance)
BALANCE SHEET OF TESCO
3
BALANCE SHEET OF TESCO
3

(Source: Yahoo finance)
4
4
⊘ This is a preview!⊘
Do you want full access?
Subscribe today to unlock all pages.

Trusted by 1+ million students worldwide

Horizontal analysis of Tesco's balance sheet:
Total Current Assets: Companies current assets shows a huge crash in 2014, but after
that it starts improving. The main reason behind this huge declined is inventories.
Because Tesco is failed in producing more groceries due to less demand of the product.
This effect is directly linked with total revenues of the company.
Long-term Investments: Company has invested huge amount in 2014, but it reduces the
investment amount after 2014. it indicates that Tesco is diversifying its funds into
different sources to improve their portfolio.
Total Current Liabilities: Company manages to control its current liabilities to match
with inventories level. But in 2015 company is less financially leverage because its
current liabilities is decreasing with increasing in the sales as compared to 2014. This
indicates the operations efficiency of Tesco.
Equity Stocks: Companies equity stocks are stable which indicates that company is not
raising its funds through issuing stocks but through taking long term debts. Tesco doesn't
have any constant revenue so it is recommended to the company that it should raise its
funds through issuing shares,
5
Paraphrase This Document
Need a fresh take? Get an instant paraphrase of this document with our AI Paraphraser

CASH FLOW OF TESCO
(Source: Yahoo Finance)
Horizontal analysis of Tesco's income:
Operating Activities: Cash flow from transaction only shows positive effect in 2014,
after that it is continuously declining. This indicates that company is not efficiently using
its working capital. Which impact Tesco in long run by collapsing its business. Thus
company should be customer focused and should try to increase the demand.
Investment activities: A negative cash flows from investing activities indicates that
company is continuously investing large amount in other sources accept its own
6

operations. At the same time it is not getting any cash inflows from investing activities.
Tesco is not focusing on its core activities which is also the another reason in declining in
total revenue.
Financing Activities: In 2015 and 2016, company is showing negative cash flows which
is due to taking more long-term debt and issuing more equities. As company is not paying
any dividend so this couldn't be reason behind this. But the other possibilities may be that
Tesco is repurchasing its own stock to minimise the power of decision making by other
person outside the company.
INCOME STATENT OF WALMART
7
⊘ This is a preview!⊘
Do you want full access?
Subscribe today to unlock all pages.

Trusted by 1+ million students worldwide

(Source: Yahoo Finance)
Horizontal analysis of Walmart's Income statements:
Total Revenue: Walmart's total revenue is not stable as it shows up downs every year in
income statements, which indicates that company is failing in maintaining its constant
revenue. So it has to focus on demands and preference of the customer.
Gross Profit: Even after declining in the revenues of the company, Walmart has
managed to increase its gross profit. This indicates that company has smartly control its
8
Paraphrase This Document
Need a fresh take? Get an instant paraphrase of this document with our AI Paraphraser

cost of goods sold through reduced raw material costs and labour costs (Stokes, Wilson,
and Wilson, 2010).
Interest Expenses: Walmart's interest on debt was increased up-to 2015 but company
managed to reduced this expenses, because company internally analyses its strength and
evaluate that it's revenue is not constant so it should raise funds through issuing shares in
the market. This indicates that it has good capital structure.
Net Income: Companies net income is decreasing instead of increasing in gross profit
trends. This indicates that company is utilizing more cash in its operations like paying
rents, depreciations, etc.
9

(Source: Yahoo finance)
Horizontal analysis of Walmart's Balance Sheet:
Total current Assets: Companies current assets are declining every year, because
of decreasing inventories. This indicates that Walmart is failing in deal with market
changes and thus its demand of product is declining every year.
10
Horizontal analysis of Walmart's Balance Sheet:
Total current Assets: Companies current assets are declining every year, because
of decreasing inventories. This indicates that Walmart is failing in deal with market
changes and thus its demand of product is declining every year.
10
⊘ This is a preview!⊘
Do you want full access?
Subscribe today to unlock all pages.

Trusted by 1+ million students worldwide
1 out of 26