Financial Analysis Report: Wesfarmers Pty Ltd - HI5002 Finance
VerifiedAdded on 2021/06/17
|20
|3898
|68
Report
AI Summary
This report provides a comprehensive financial analysis of Wesfarmers Pty Ltd, a leading Australian retail company listed on the ASX. The analysis includes an executive summary, an introduction outlining the report's objectives, and a brief description of Wesfarmers, its ownership structure, and key personnel involved in its governance. The report conducts a fundamental analysis using ratio analysis to evaluate the company's financial performance over the past two years. It also examines the movement of Wesfarmers' share prices compared to the All Ordinaries Index, calculating the correlation and volatility. Financial and business applications, such as the demerger of Coles, capital returns, and changes in directors' interests, are discussed. The report applies the CAPM model to calculate the required rate of return, estimates beta, and discusses the weighted average cost of capital (WACC) and capital structure. Finally, it analyzes Wesfarmers' dividend policy and offers recommendations to investors based on the overall financial analysis. The report concludes that Wesfarmers has maintained its strong financial performance and is suitable for investment.
1
Unit Code: HI5002
Unit Name: Finance for Business
Unit Code: HI5002
Unit Name: Finance for Business
Paraphrase This Document
Need a fresh take? Get an instant paraphrase of this document with our AI Paraphraser
2
Executive Summary
The present report has been developed for presenting the financial analysis of
Wesfarmers Pty Ltd for the purpose of taking investment decisions. It has been reflected from
the analysis that Wesfarmers has maintained its strong financial performance over the past years
and also its potential of growth is very strong as depicted from its performance ratios and debt
ratios. The calculation of beta by the use of CAPM model for the company has reflected that its
securities are less risky for the investment purpose. Also, its dividend policy seems adequate for
creating larger return to shareholders and it has been recommended from the overall analysis
carried out that Wesfarmers financial position seems to be appropriate for providing larger return
to investors in the future context. Introduction 150 words
3
Contents
Executive Summary.........................................................................................................................2
Introduction......................................................................................................................................4
Part 1: Brief Description of the Company.......................................................................................4
Part 2: Ownership- Structure of Wesfarmers Ltd............................................................................5
Part 3: Fundamental Analysis of Wesfarmers ratio analysis as a financial tool..............................7
Part 4: Movement of Wesfarmers Company Share prices Vs movements in the All Ordinaries
Index..............................................................................................................................................10
4.1: Graph representing the monthly share price of Wesfarmers and All Ordinaries................10
4.2: Report to compare the movements of share price of Wesfarmers and All Ordinaries.......11
Part 5: Financial or Business Applications....................................................................................13
Part 6: Application of CAPM Model to calculate the required rate of return of Wesfarmers.......14
6.1: Estimation of calculated beta of the chosen company........................................................14
6.2: Required rate of return using the CAPM Model.................................................................14
6.3: Discussion on whether Wesfarmers is ideal for “conservative” investment......................15
Part 7: Weighted Average cost of capital......................................................................................15
7.1: WACC of Wesfarmers........................................................................................................15
7.2: Implication of higher WACC..............................................................................................16
Part 8: Capital Structure of Wesfarmers........................................................................................16
8.1: Optimal Capital Structure...................................................................................................16
8.2: Impact on the gearing ratio.................................................................................................16
Part 9: Dividend Policy..................................................................................................................16
Part 10: Recommendation to Client...............................................................................................17
References......................................................................................................................................18
⊘ This is a preview!⊘
Do you want full access?
Subscribe today to unlock all pages.
Trusted by 1+ million students worldwide
4
Introduction
The present report is developed for carrying out an in-depth analysis into the financial
performance of a selected company listed on ASX. The analysis is carried out for the purpose of
providing financial assistance to wealthy investors by guiding their decision-making process.
The analysis is undertaken in respect of the financial reports disclosed by the selected company
on the ASX. The company selected for the analysis purpose is Wesfarmers Pty Ltd, a
supermarket giant in Australia. In this context, the report includes providing a brief description
of the company and its ownership-governance structure. This is followed by carrying out
examination of its difference performance ratios for gaining an analysis of its financial
performance in depth. The report also provides a description of the significant factors influencing
the share price of the company. Also, it carries out the calculation regarding the beta values and
the expected rates of return using the CAPM model. The report also carries out calculation in
relation to the weighted average cost of capital of the company and debt ratios for examining the
improvement achieved in relation to maintaining a preferred optimal capital structure. Lastly, the
report provides discussion in relation to dividend policy and recommendation to the investors in
relation to the overall analysis carried out.
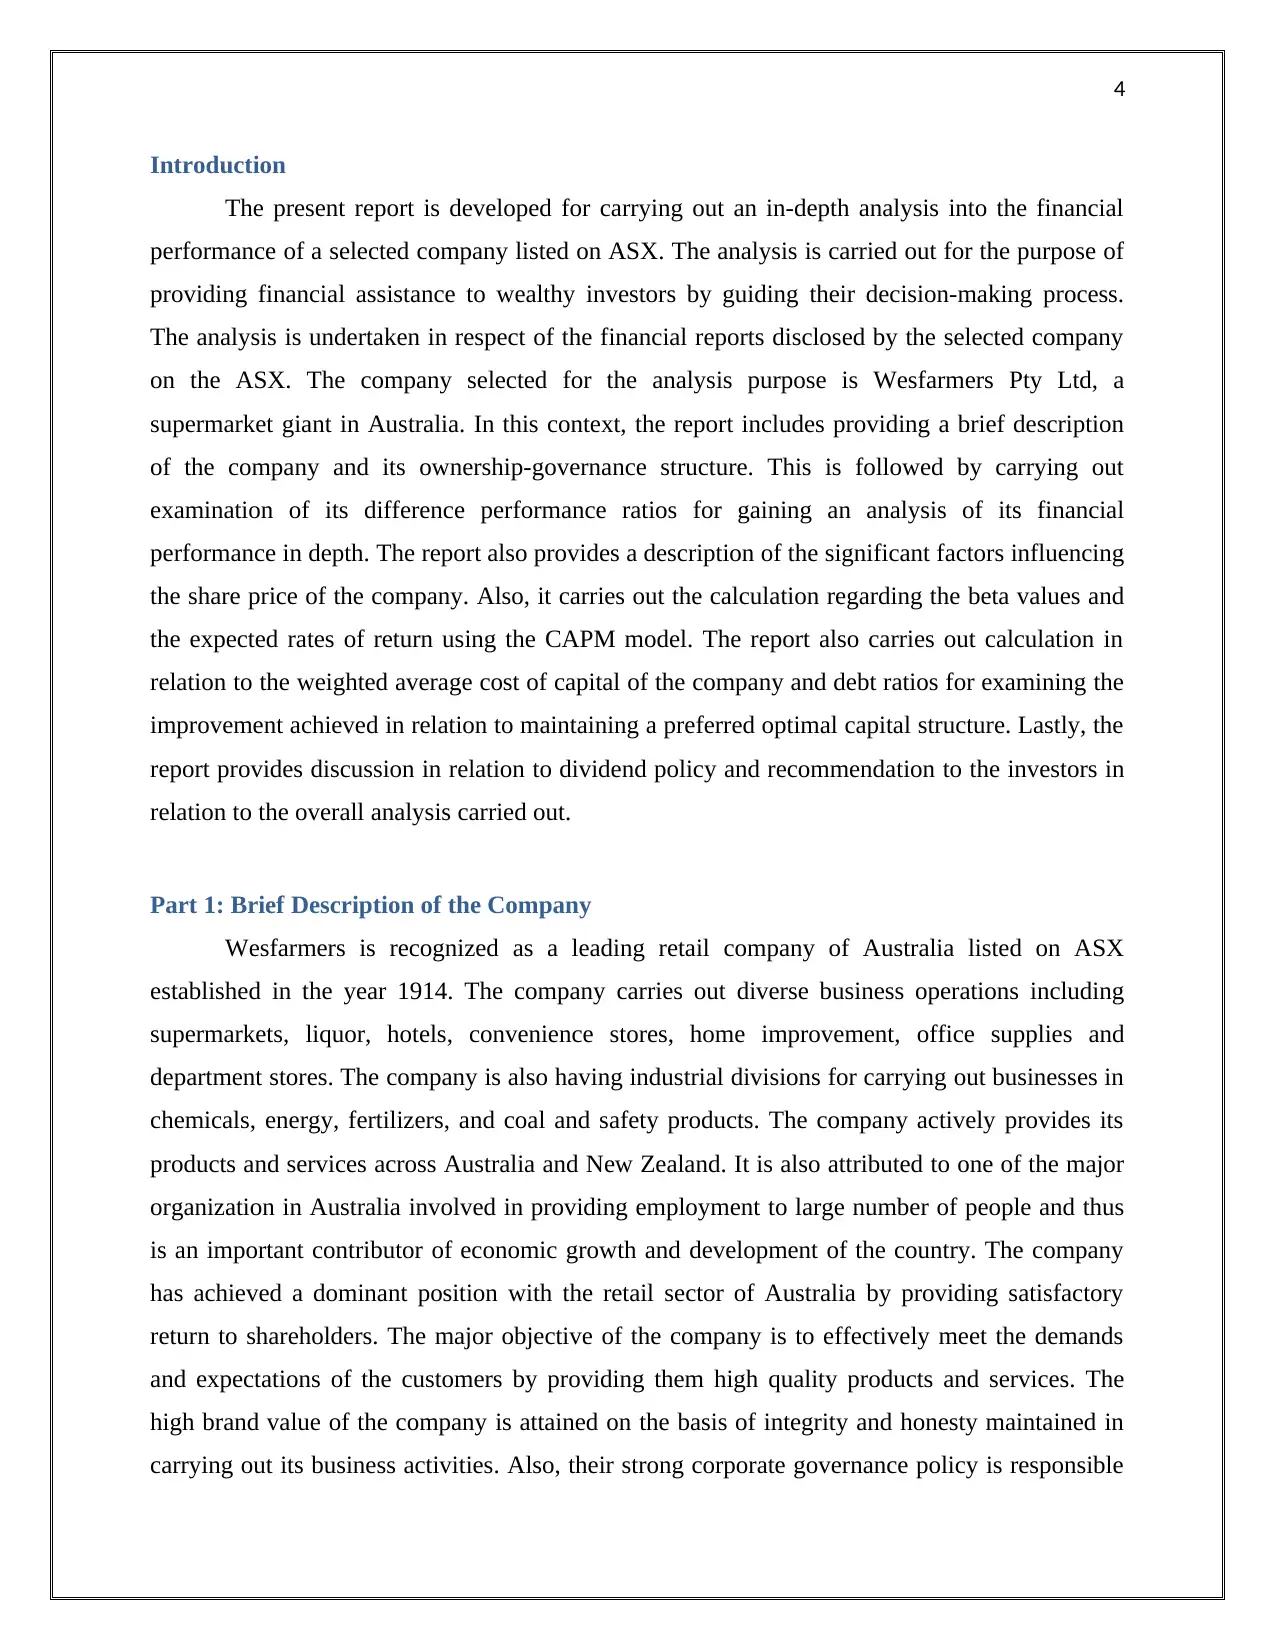
Part 1: Brief Description of the Company
Wesfarmers is recognized as a leading retail company of Australia listed on ASX
established in the year 1914. The company carries out diverse business operations including
supermarkets, liquor, hotels, convenience stores, home improvement, office supplies and
department stores. The company is also having industrial divisions for carrying out businesses in
chemicals, energy, fertilizers, and coal and safety products. The company actively provides its
products and services across Australia and New Zealand. It is also attributed to one of the major
organization in Australia involved in providing employment to large number of people and thus
is an important contributor of economic growth and development of the country. The company
has achieved a dominant position with the retail sector of Australia by providing satisfactory
return to shareholders. The major objective of the company is to effectively meet the demands
and expectations of the customers by providing them high quality products and services. The
high brand value of the company is attained on the basis of integrity and honesty maintained in
carrying out its business activities. Also, their strong corporate governance policy is responsible
Introduction
The present report is developed for carrying out an in-depth analysis into the financial
performance of a selected company listed on ASX. The analysis is carried out for the purpose of
providing financial assistance to wealthy investors by guiding their decision-making process.
The analysis is undertaken in respect of the financial reports disclosed by the selected company
on the ASX. The company selected for the analysis purpose is Wesfarmers Pty Ltd, a
supermarket giant in Australia. In this context, the report includes providing a brief description
of the company and its ownership-governance structure. This is followed by carrying out
examination of its difference performance ratios for gaining an analysis of its financial
performance in depth. The report also provides a description of the significant factors influencing
the share price of the company. Also, it carries out the calculation regarding the beta values and
the expected rates of return using the CAPM model. The report also carries out calculation in
relation to the weighted average cost of capital of the company and debt ratios for examining the
improvement achieved in relation to maintaining a preferred optimal capital structure. Lastly, the
report provides discussion in relation to dividend policy and recommendation to the investors in
relation to the overall analysis carried out.
Part 1: Brief Description of the Company
Wesfarmers is recognized as a leading retail company of Australia listed on ASX
established in the year 1914. The company carries out diverse business operations including
supermarkets, liquor, hotels, convenience stores, home improvement, office supplies and
department stores. The company is also having industrial divisions for carrying out businesses in
chemicals, energy, fertilizers, and coal and safety products. The company actively provides its
products and services across Australia and New Zealand. It is also attributed to one of the major
organization in Australia involved in providing employment to large number of people and thus
is an important contributor of economic growth and development of the country. The company
has achieved a dominant position with the retail sector of Australia by providing satisfactory
return to shareholders. The major objective of the company is to effectively meet the demands
and expectations of the customers by providing them high quality products and services. The
high brand value of the company is attained on the basis of integrity and honesty maintained in
carrying out its business activities. Also, their strong corporate governance policy is responsible
Paraphrase This Document
Need a fresh take? Get an instant paraphrase of this document with our AI Paraphraser
5
for carrying out its business activities in an ethical manner by proper management of its
community and environmental impact (Wesfarmers: About Us, 2018).
Part 2: Ownership- Structure of Wesfarmers Ltd
Major Substantial Shareholders
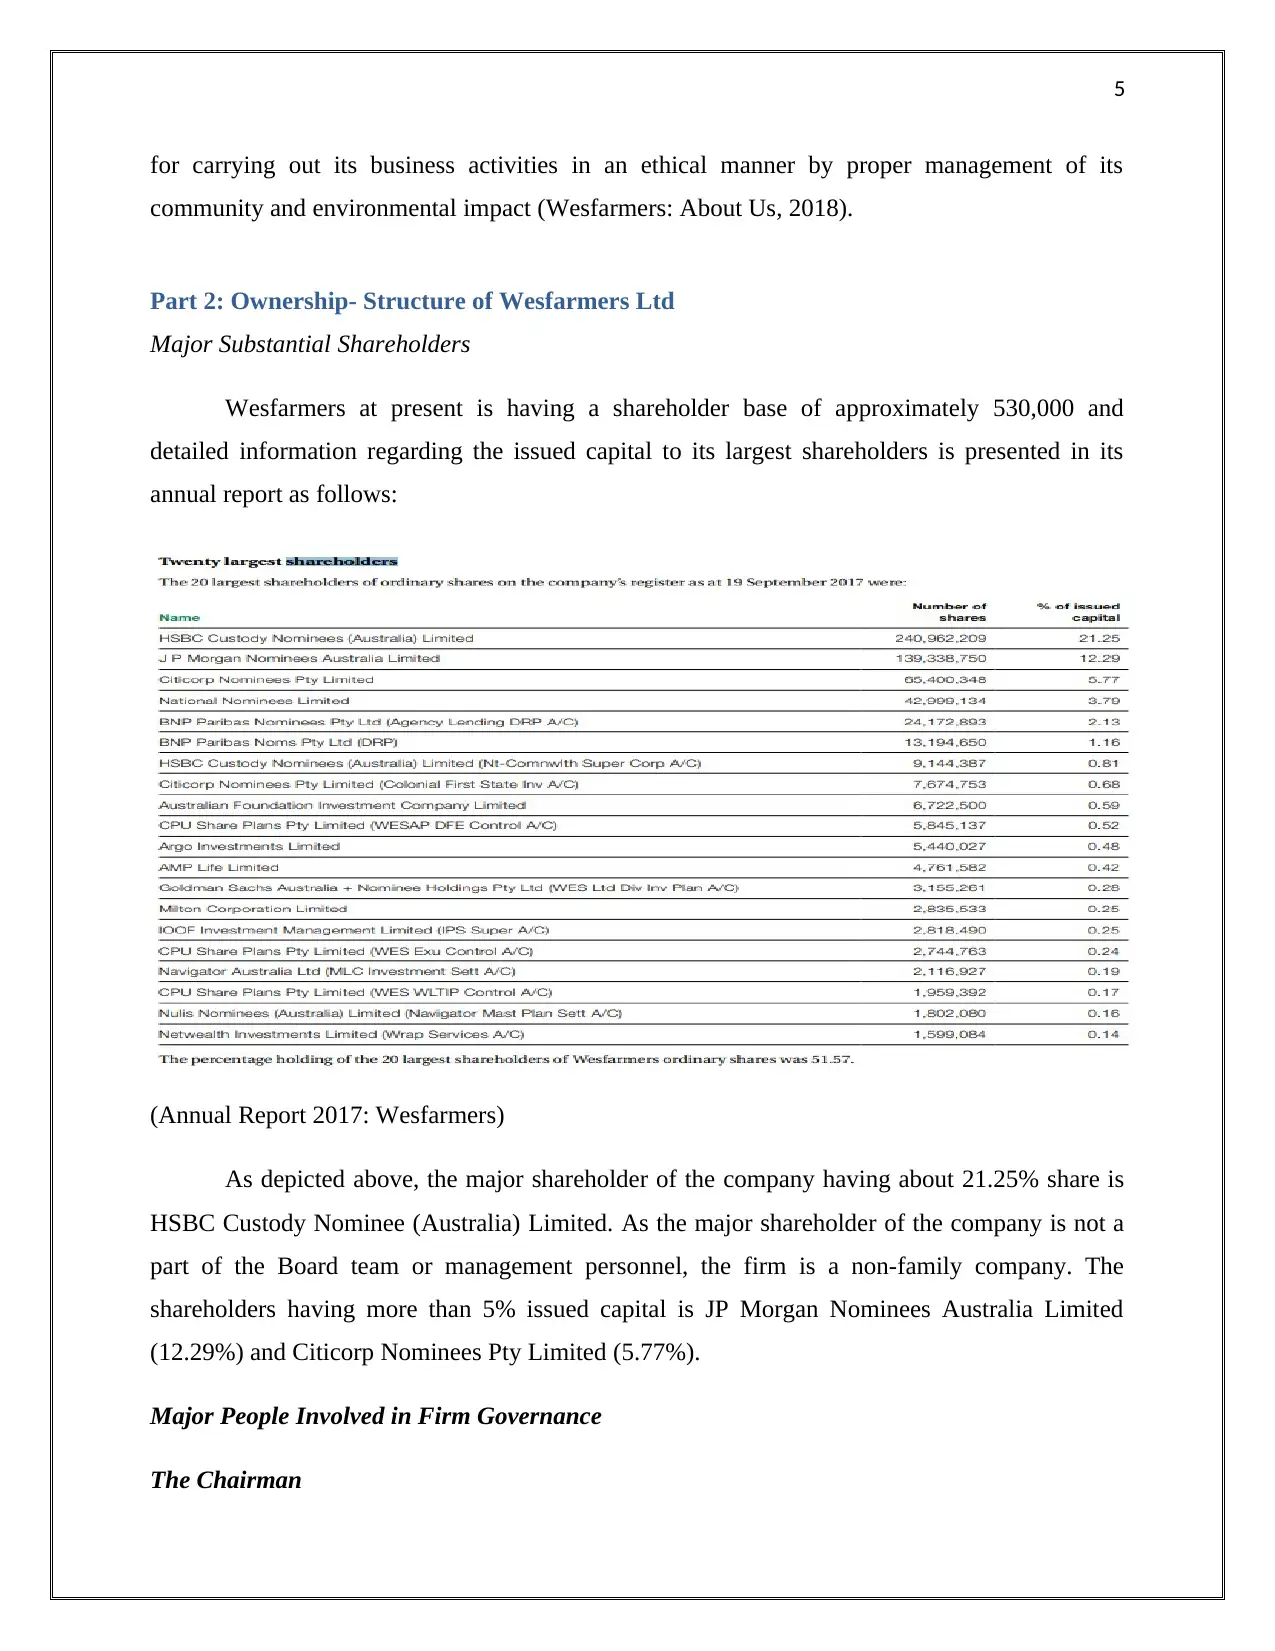
Wesfarmers at present is having a shareholder base of approximately 530,000 and
detailed information regarding the issued capital to its largest shareholders is presented in its
annual report as follows:
(Annual Report 2017: Wesfarmers)
As depicted above, the major shareholder of the company having about 21.25% share is
HSBC Custody Nominee (Australia) Limited. As the major shareholder of the company is not a
part of the Board team or management personnel, the firm is a non-family company. The
shareholders having more than 5% issued capital is JP Morgan Nominees Australia Limited
(12.29%) and Citicorp Nominees Pty Limited (5.77%).
Major People Involved in Firm Governance
The Chairman
for carrying out its business activities in an ethical manner by proper management of its
community and environmental impact (Wesfarmers: About Us, 2018).
Part 2: Ownership- Structure of Wesfarmers Ltd
Major Substantial Shareholders
Wesfarmers at present is having a shareholder base of approximately 530,000 and
detailed information regarding the issued capital to its largest shareholders is presented in its
annual report as follows:
(Annual Report 2017: Wesfarmers)
As depicted above, the major shareholder of the company having about 21.25% share is
HSBC Custody Nominee (Australia) Limited. As the major shareholder of the company is not a
part of the Board team or management personnel, the firm is a non-family company. The
shareholders having more than 5% issued capital is JP Morgan Nominees Australia Limited
(12.29%) and Citicorp Nominees Pty Limited (5.77%).
Major People Involved in Firm Governance
The Chairman
6
Michael Chaney is the Chairman of the Group since the year 2015 and possesses the
qualifications of BSc, MBA and FTSE (Annual Report 2017: Wesfarmers).
Board Members
Michael Chaney is the Chairman of the Group since the year 2015 and possesses the
qualifications of BSc, MBA and FTSE (Annual Report 2017: Wesfarmers).
Board Members
⊘ This is a preview!⊘
Do you want full access?
Subscribe today to unlock all pages.
Trusted by 1+ million students worldwide
7
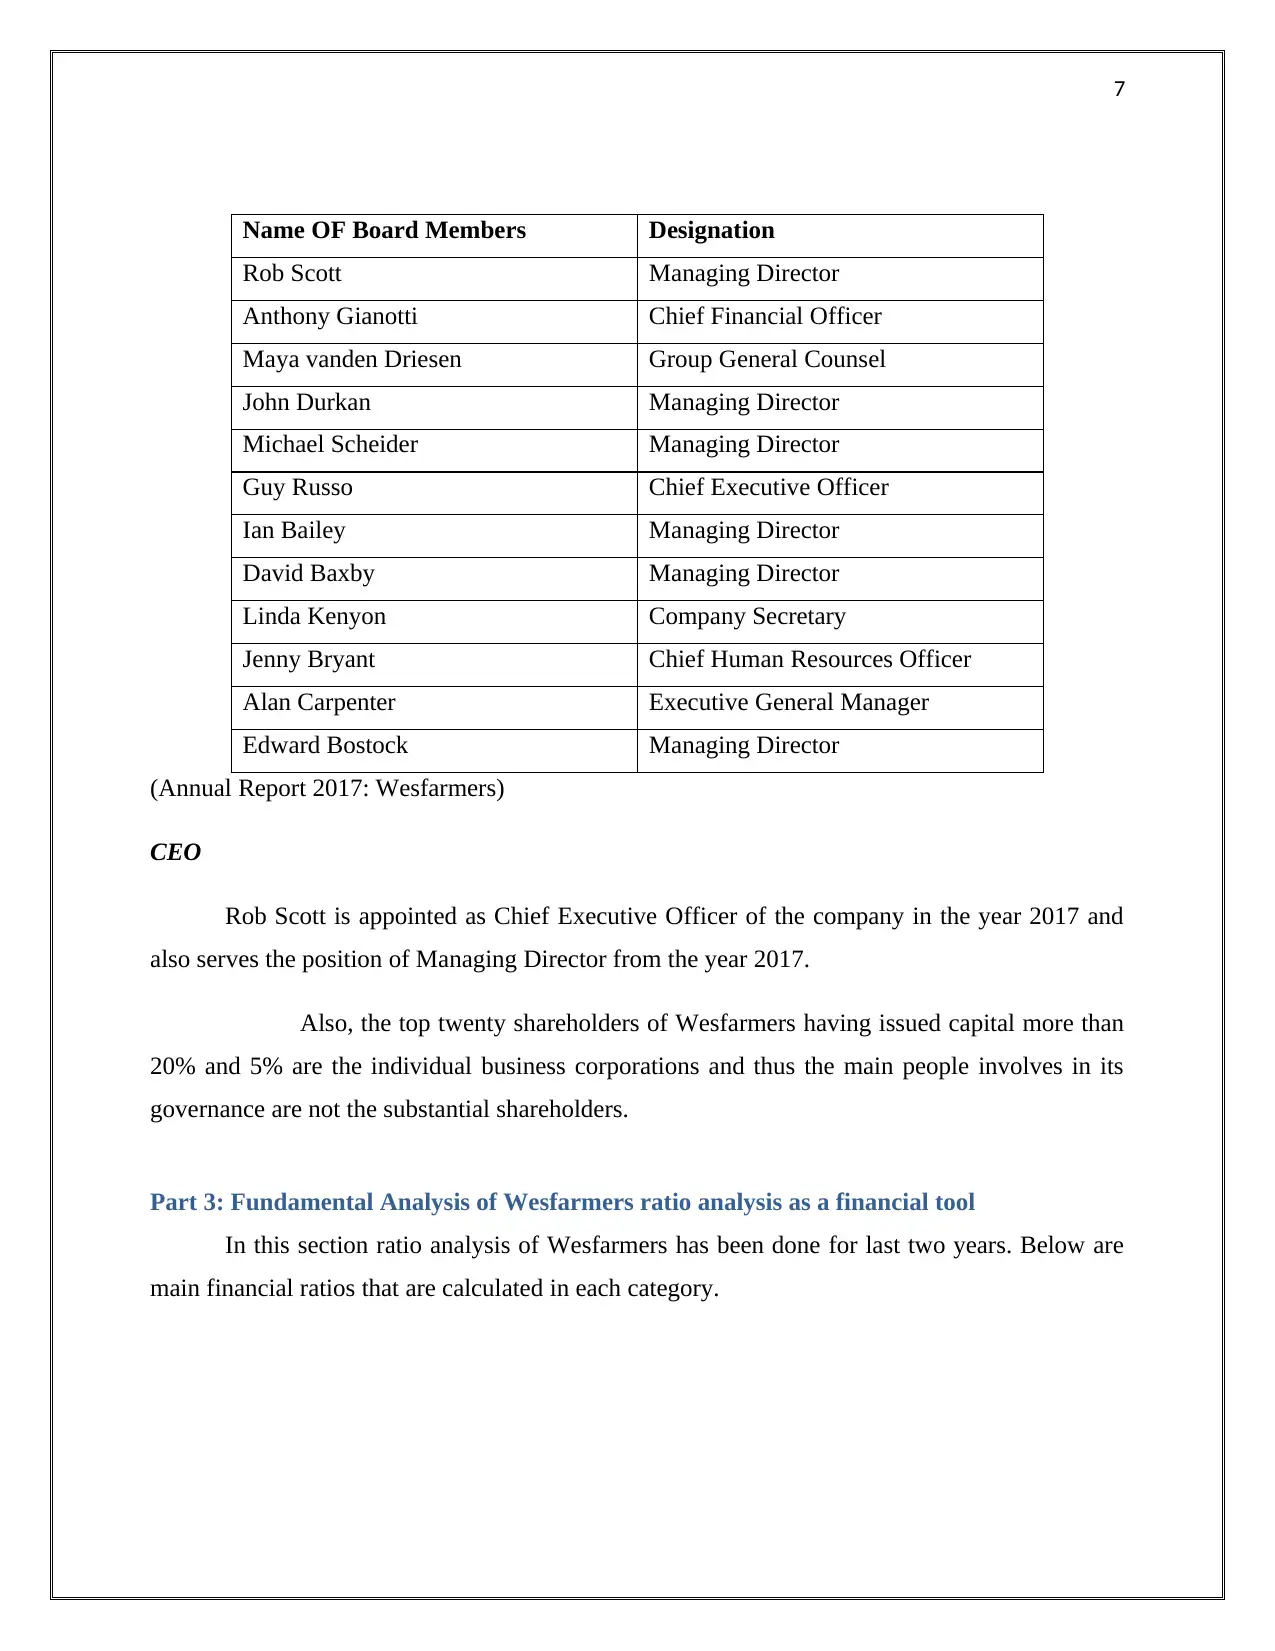
Name OF Board Members Designation
Rob Scott Managing Director
Anthony Gianotti Chief Financial Officer
Maya vanden Driesen Group General Counsel
John Durkan Managing Director
Michael Scheider Managing Director
Guy Russo Chief Executive Officer
Ian Bailey Managing Director
David Baxby Managing Director
Linda Kenyon Company Secretary
Jenny Bryant Chief Human Resources Officer
Alan Carpenter Executive General Manager
Edward Bostock Managing Director
(Annual Report 2017: Wesfarmers)
CEO
Rob Scott is appointed as Chief Executive Officer of the company in the year 2017 and
also serves the position of Managing Director from the year 2017.
Also, the top twenty shareholders of Wesfarmers having issued capital more than
20% and 5% are the individual business corporations and thus the main people involves in its
governance are not the substantial shareholders.
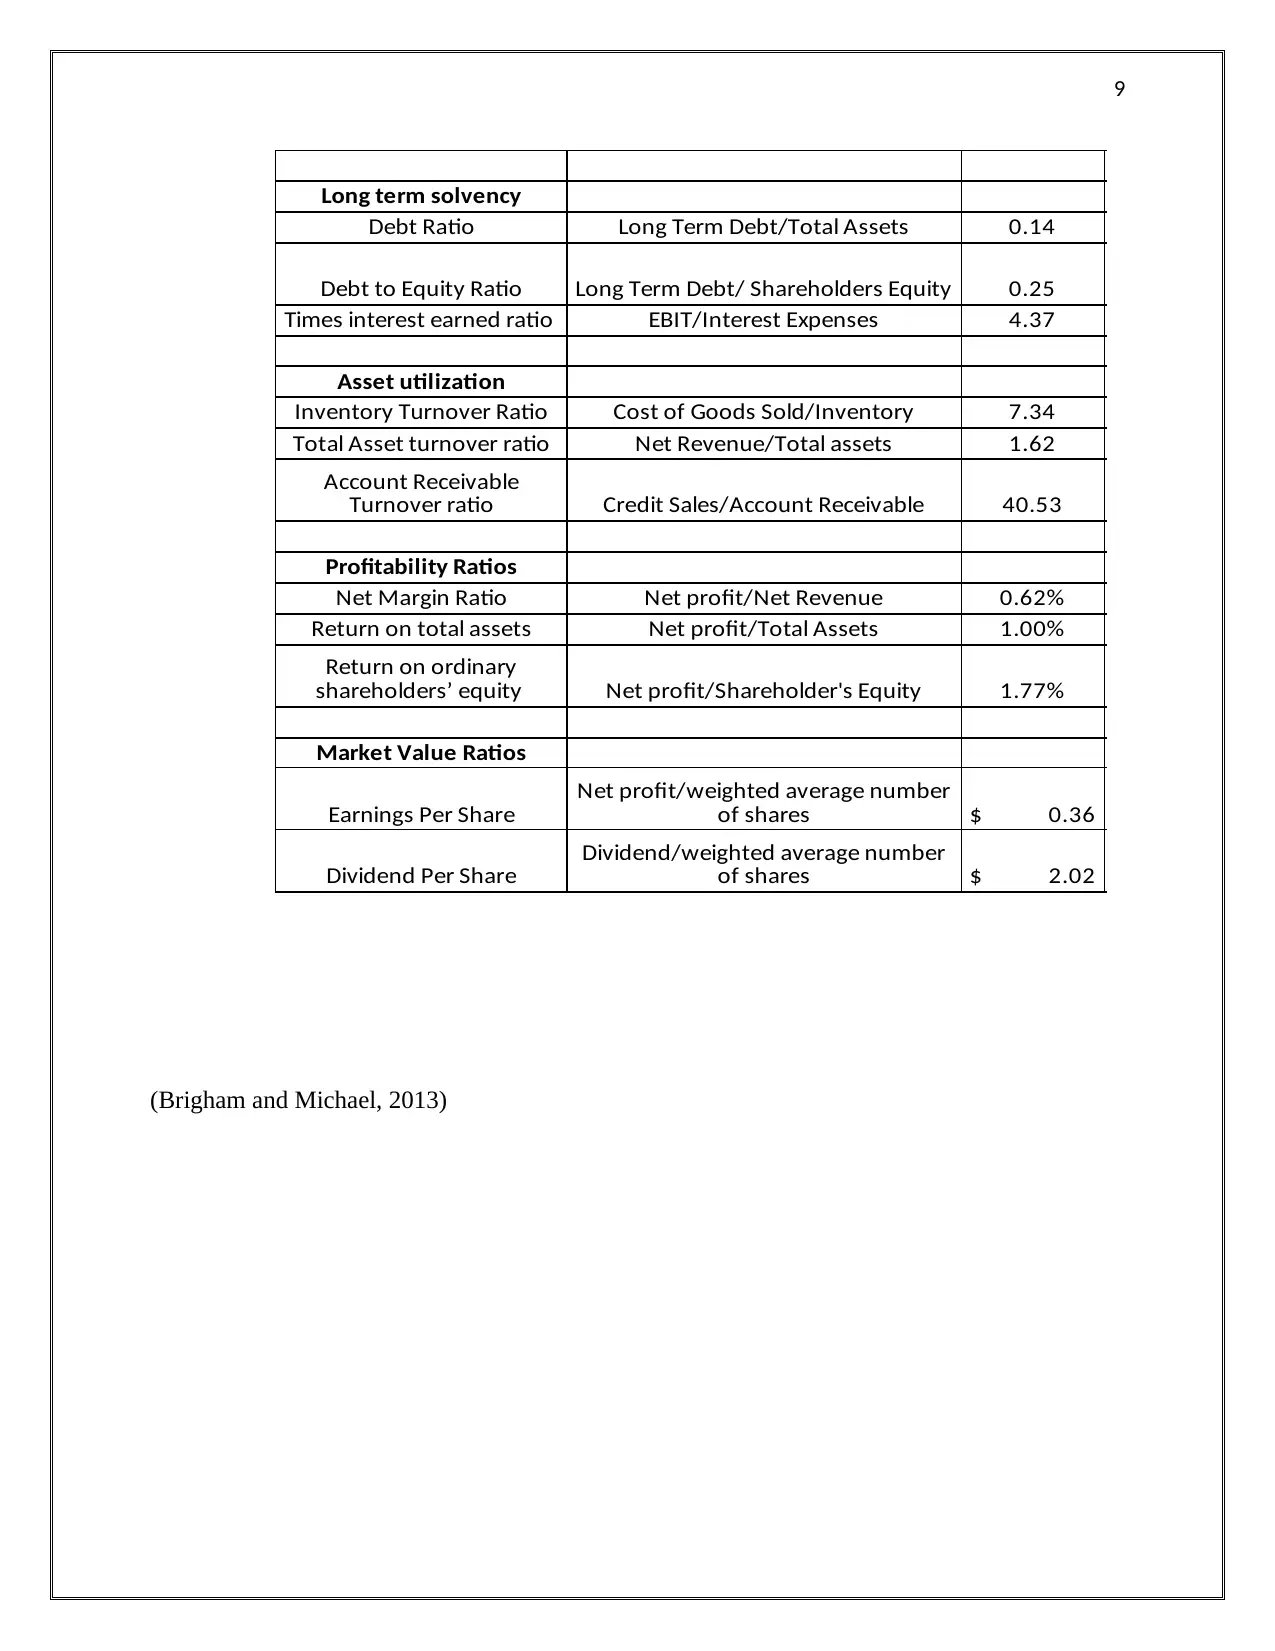
Part 3: Fundamental Analysis of Wesfarmers ratio analysis as a financial tool
In this section ratio analysis of Wesfarmers has been done for last two years. Below are
main financial ratios that are calculated in each category.
Name OF Board Members Designation
Rob Scott Managing Director
Anthony Gianotti Chief Financial Officer
Maya vanden Driesen Group General Counsel
John Durkan Managing Director
Michael Scheider Managing Director
Guy Russo Chief Executive Officer
Ian Bailey Managing Director
David Baxby Managing Director
Linda Kenyon Company Secretary
Jenny Bryant Chief Human Resources Officer
Alan Carpenter Executive General Manager
Edward Bostock Managing Director
(Annual Report 2017: Wesfarmers)
CEO
Rob Scott is appointed as Chief Executive Officer of the company in the year 2017 and
also serves the position of Managing Director from the year 2017.
Also, the top twenty shareholders of Wesfarmers having issued capital more than
20% and 5% are the individual business corporations and thus the main people involves in its
governance are not the substantial shareholders.
Part 3: Fundamental Analysis of Wesfarmers ratio analysis as a financial tool
In this section ratio analysis of Wesfarmers has been done for last two years. Below are
main financial ratios that are calculated in each category.
Paraphrase This Document
Need a fresh take? Get an instant paraphrase of this document with our AI Paraphraser
8
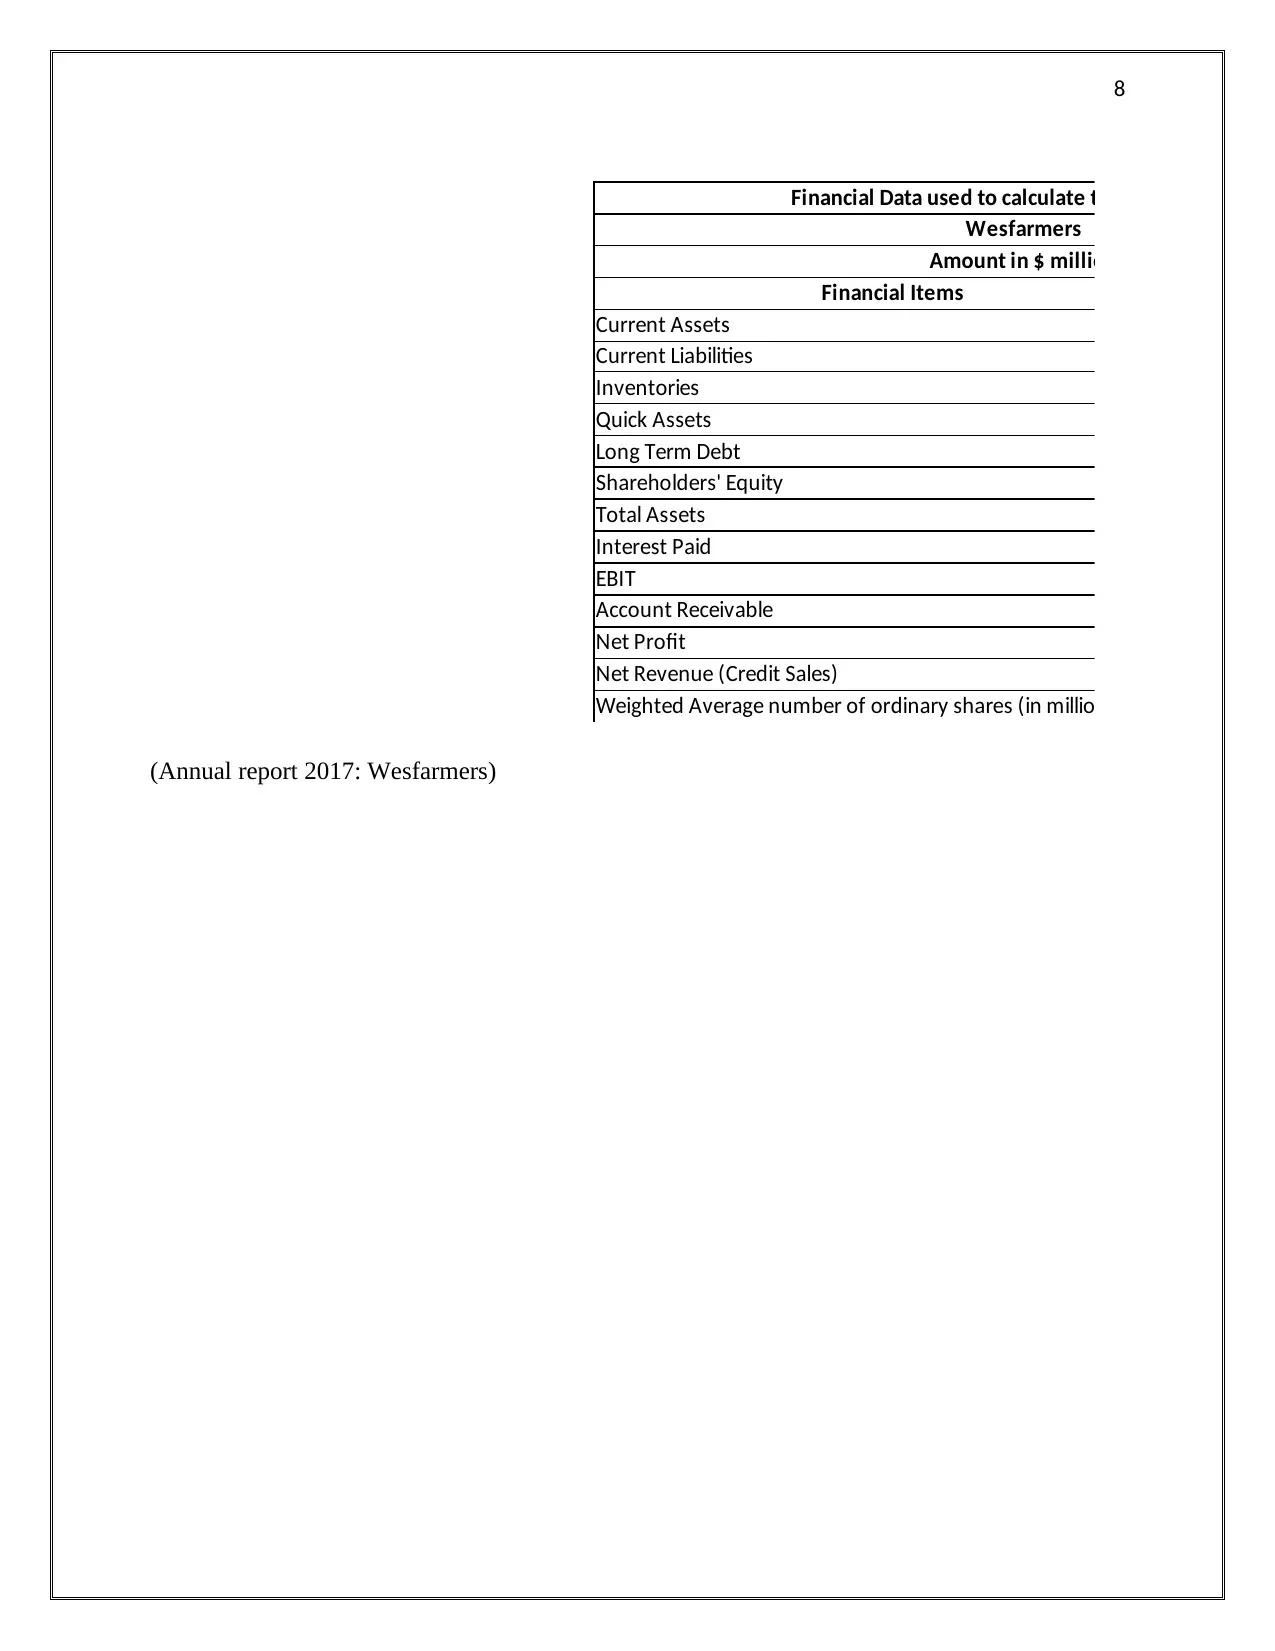
Financial Data used to calculate the financial ratio
Wesfarmers
Amount in $ million
Financial Items
Current Assets
Current Liabilities
Inventories
Quick Assets
Long Term Debt
Shareholders' Equity
Total Assets
Interest Paid
EBIT
Account Receivable
Net Profit
Net Revenue (Credit Sales)
Weighted Average number of ordinary shares (in million)
(Annual report 2017: Wesfarmers)
9
Long term solvency
Debt Ratio Long Term Debt/Total Assets 0.14
Debt to Equity Ratio Long Term Debt/ Shareholders Equity 0.25
Times interest earned ratio EBIT/Interest Expenses 4.37
Asset utilization
Inventory Turnover Ratio Cost of Goods Sold/Inventory 7.34
Total Asset turnover ratio Net Revenue/Total assets 1.62
Credit Sales/Account Receivable 40.53
Profitability Ratios
Net Margin Ratio Net profit/Net Revenue 0.62%
Return on total assets Net profit/Total Assets 1.00%
Net profit/Shareholder's Equity 1.77%
Market Value Ratios
Earnings Per Share $ 0.36
Dividend Per Share $ 2.02
Account Receivable
Turnover ratio
Return on ordinary
shareholders’ equity
Net profit/weighted average number
of shares
Dividend/weighted average number
of shares
(Brigham and Michael, 2013)
⊘ This is a preview!⊘
Do you want full access?
Subscribe today to unlock all pages.
Trusted by 1+ million students worldwide
10
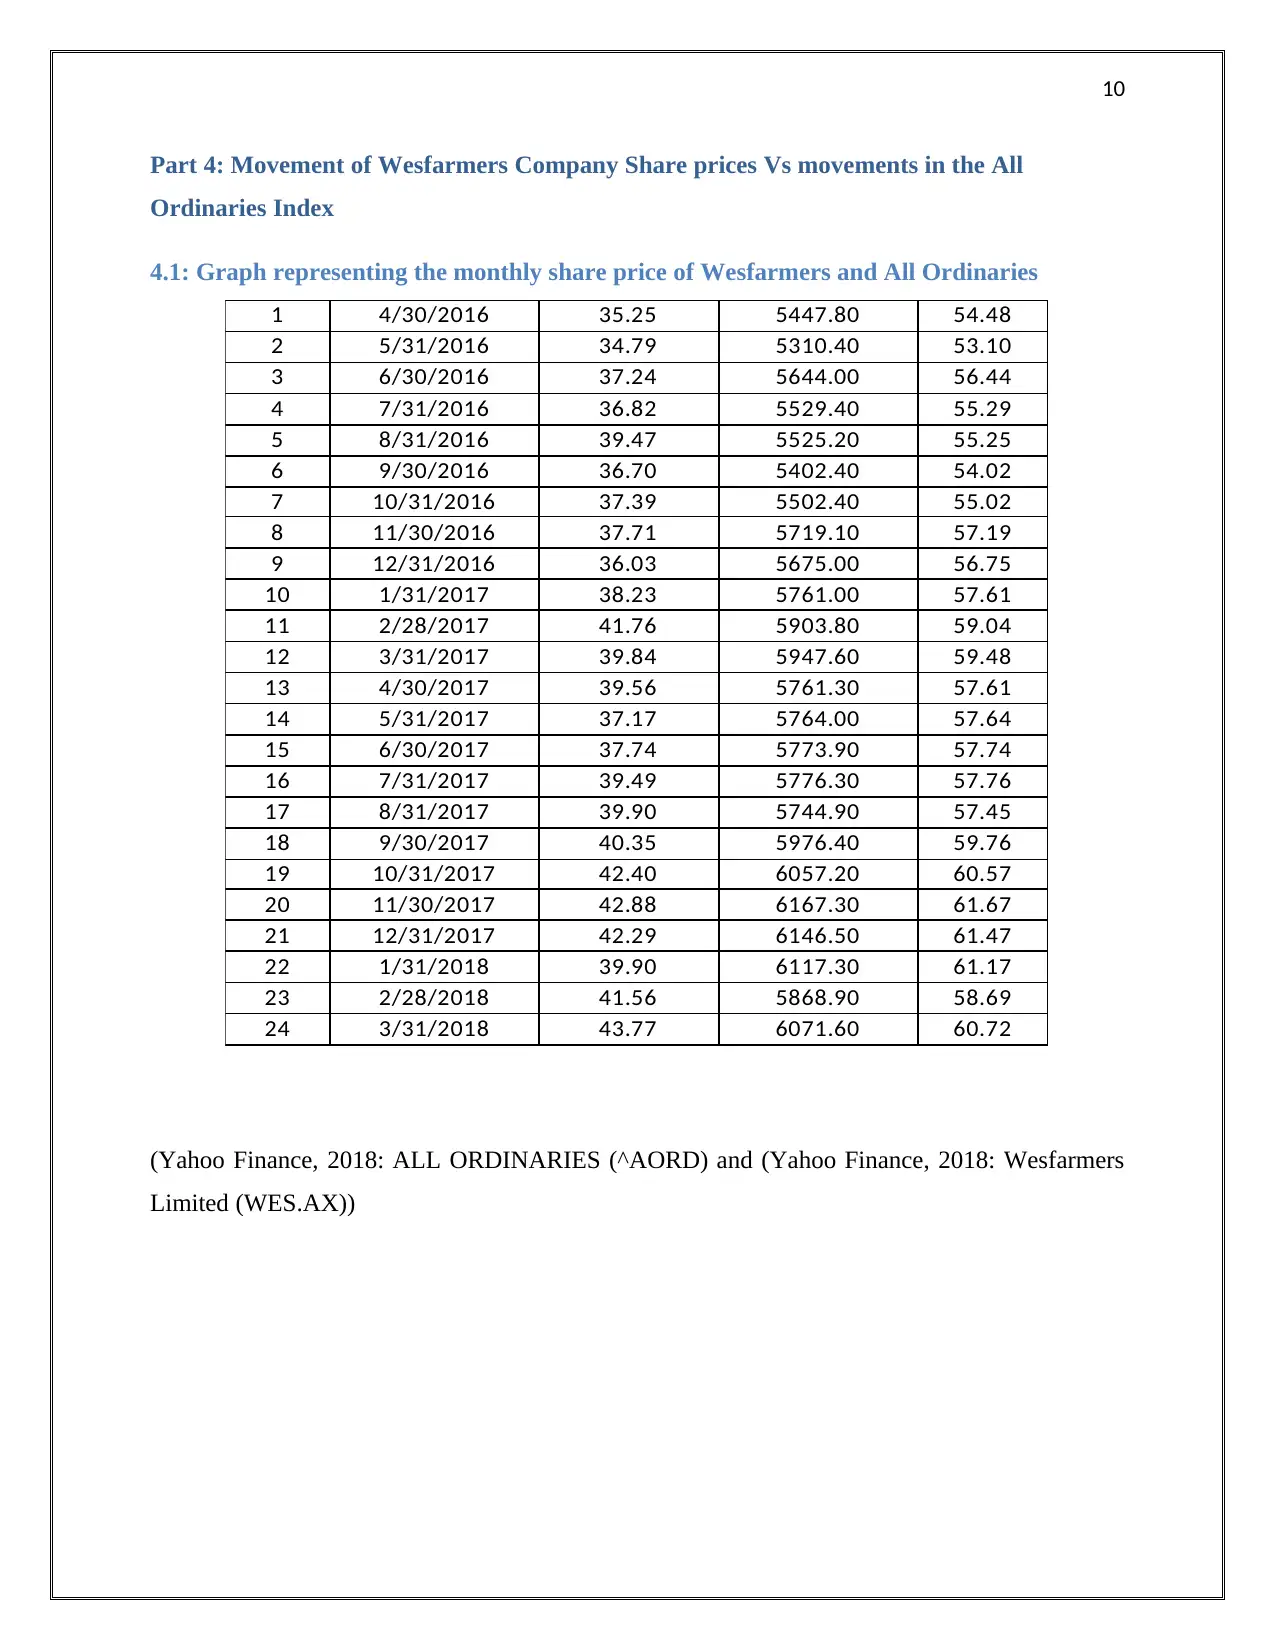
Part 4: Movement of Wesfarmers Company Share prices Vs movements in the All
Ordinaries Index
4.1: Graph representing the monthly share price of Wesfarmers and All Ordinaries
1 4/30/2016 35.25 5447.80 54.48
2 5/31/2016 34.79 5310.40 53.10
3 6/30/2016 37.24 5644.00 56.44
4 7/31/2016 36.82 5529.40 55.29
5 8/31/2016 39.47 5525.20 55.25
6 9/30/2016 36.70 5402.40 54.02
7 10/31/2016 37.39 5502.40 55.02
8 11/30/2016 37.71 5719.10 57.19
9 12/31/2016 36.03 5675.00 56.75
10 1/31/2017 38.23 5761.00 57.61
11 2/28/2017 41.76 5903.80 59.04
12 3/31/2017 39.84 5947.60 59.48
13 4/30/2017 39.56 5761.30 57.61
14 5/31/2017 37.17 5764.00 57.64
15 6/30/2017 37.74 5773.90 57.74
16 7/31/2017 39.49 5776.30 57.76
17 8/31/2017 39.90 5744.90 57.45
18 9/30/2017 40.35 5976.40 59.76
19 10/31/2017 42.40 6057.20 60.57
20 11/30/2017 42.88 6167.30 61.67
21 12/31/2017 42.29 6146.50 61.47
22 1/31/2018 39.90 6117.30 61.17
23 2/28/2018 41.56 5868.90 58.69
24 3/31/2018 43.77 6071.60 60.72
(Yahoo Finance, 2018: ALL ORDINARIES (^AORD) and (Yahoo Finance, 2018: Wesfarmers
Limited (WES.AX))
Paraphrase This Document
Need a fresh take? Get an instant paraphrase of this document with our AI Paraphraser
11
01/04/2016
01/05/2016
01/06/2016
01/07/2016
01/08/2016
01/09/2016
01/10/2016
01/11/2016
01/12/2016
01/01/2017
01/02/2017
01/03/2017
01/04/2017
01/05/2017
01/06/2017
01/07/2017
01/08/2017
01/09/2017
01/10/2017
01/11/2017
01/12/2017
01/01/2018
01/02/2018
01/03/2018
0.00
5.00
10.00
15.00
20.00
25.00
30.00
35.00
40.00
45.00
50.00
55.00
60.00
65.00
Price Movement of Wesfarmers and all
ordinaries
All Ordinaries
Wesfarmers
Date (Monthly)
Share Price
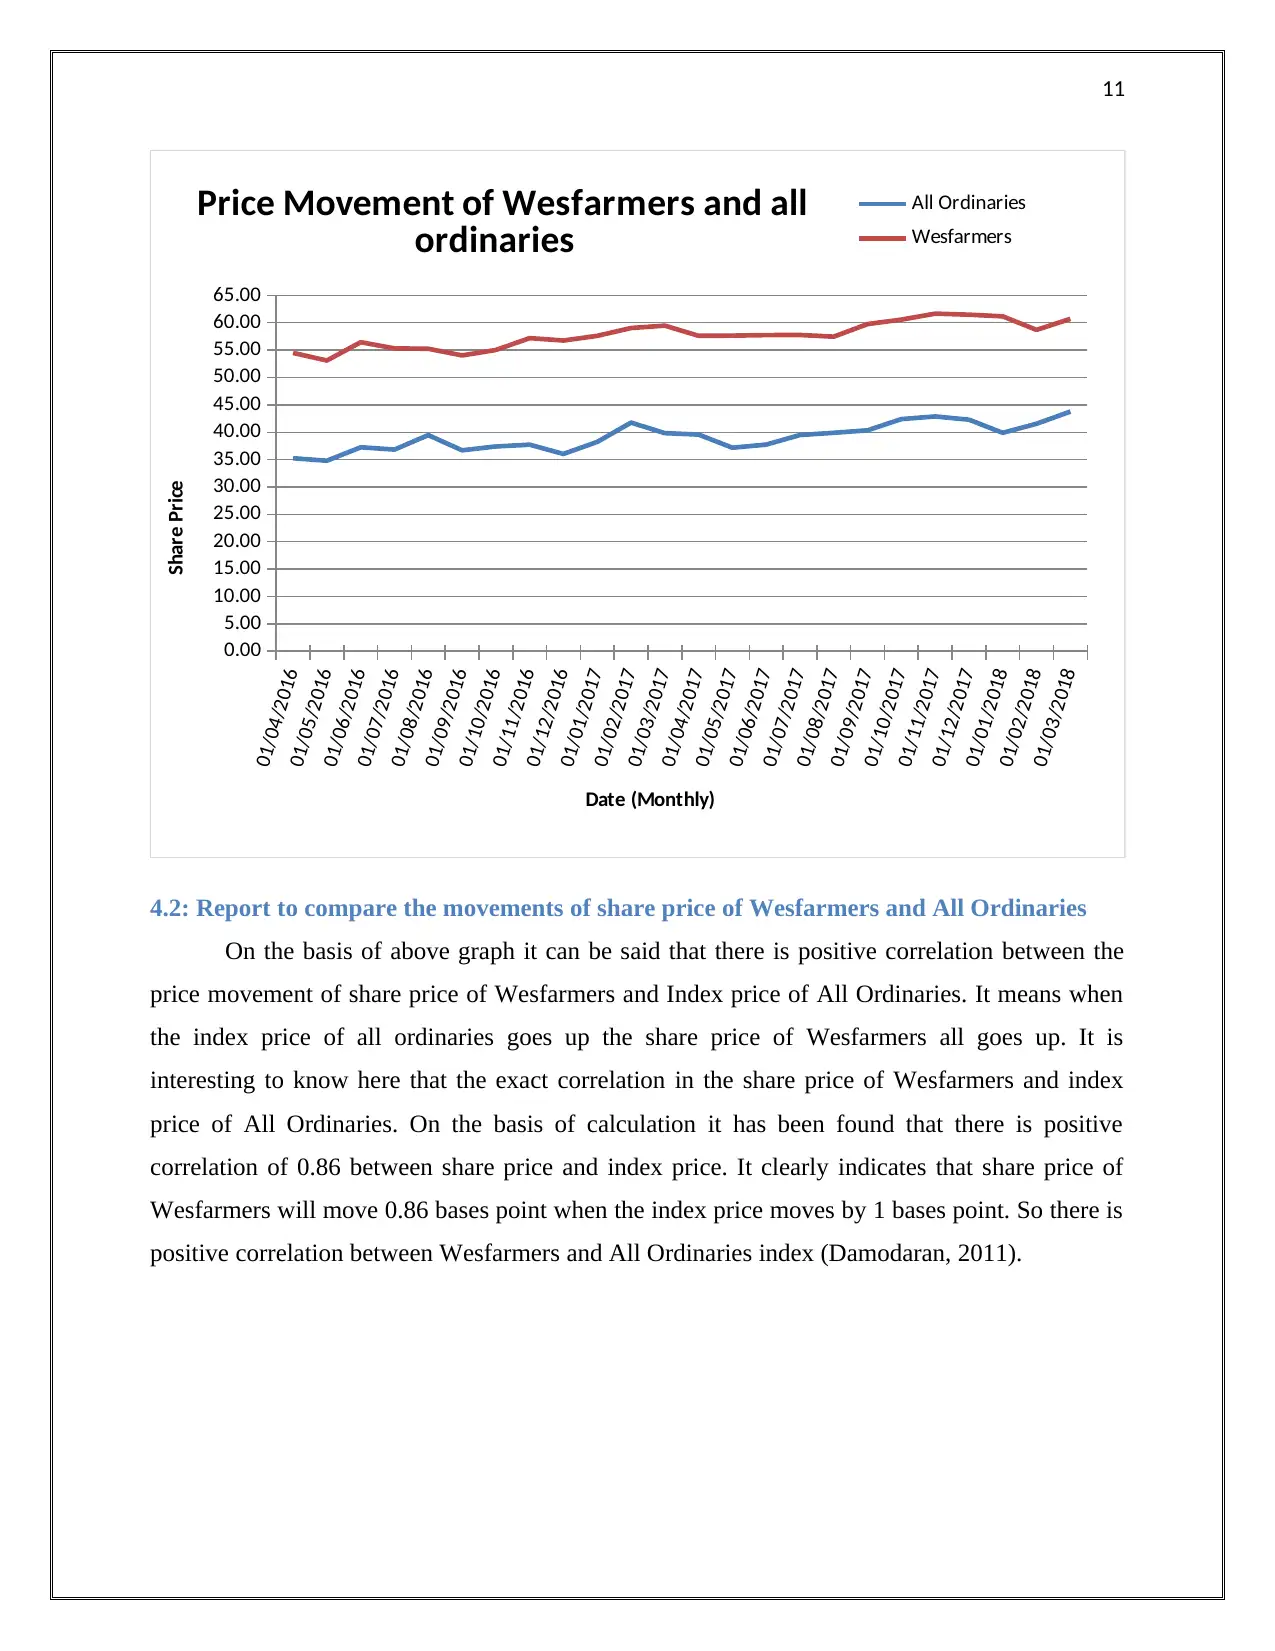
4.2: Report to compare the movements of share price of Wesfarmers and All Ordinaries
On the basis of above graph it can be said that there is positive correlation between the
price movement of share price of Wesfarmers and Index price of All Ordinaries. It means when
the index price of all ordinaries goes up the share price of Wesfarmers all goes up. It is
interesting to know here that the exact correlation in the share price of Wesfarmers and index
price of All Ordinaries. On the basis of calculation it has been found that there is positive
correlation of 0.86 between share price and index price. It clearly indicates that share price of
Wesfarmers will move 0.86 bases point when the index price moves by 1 bases point. So there is
positive correlation between Wesfarmers and All Ordinaries index (Damodaran, 2011).
01/04/2016
01/05/2016
01/06/2016
01/07/2016
01/08/2016
01/09/2016
01/10/2016
01/11/2016
01/12/2016
01/01/2017
01/02/2017
01/03/2017
01/04/2017
01/05/2017
01/06/2017
01/07/2017
01/08/2017
01/09/2017
01/10/2017
01/11/2017
01/12/2017
01/01/2018
01/02/2018
01/03/2018
0.00
5.00
10.00
15.00
20.00
25.00
30.00
35.00
40.00
45.00
50.00
55.00
60.00
65.00
Price Movement of Wesfarmers and all
ordinaries
All Ordinaries
Wesfarmers
Date (Monthly)
Share Price
4.2: Report to compare the movements of share price of Wesfarmers and All Ordinaries
On the basis of above graph it can be said that there is positive correlation between the
price movement of share price of Wesfarmers and Index price of All Ordinaries. It means when
the index price of all ordinaries goes up the share price of Wesfarmers all goes up. It is
interesting to know here that the exact correlation in the share price of Wesfarmers and index
price of All Ordinaries. On the basis of calculation it has been found that there is positive
correlation of 0.86 between share price and index price. It clearly indicates that share price of
Wesfarmers will move 0.86 bases point when the index price moves by 1 bases point. So there is
positive correlation between Wesfarmers and All Ordinaries index (Damodaran, 2011).
12
6/30/2016 -1.14% -2.03%
7/31/2016 7.19% -0.08%
8/31/2016 -7.01% -2.22%
9/30/2016 1.88% 1.85%
10/31/2016 0.86% 3.94%
11/30/2016 -4.46% -0.77%
12/31/2016 6.11% 1.52%
1/31/2017 9.23% 2.48%
2/28/2017 -4.59% 0.74%
3/31/2017 -0.70% -3.13%
4/30/2017 -6.04% 0.05%
5/31/2017 1.52% 0.17%
6/30/2017 4.64% 0.04%
7/31/2017 1.04% -0.54%
8/31/2017 1.14% 4.03%
9/30/2017 5.07% 1.35%
10/31/2017 1.14% 1.82%
11/30/2017 -1.37% -0.34%
12/31/2017 -5.66% -0.48%
1/31/2018 4.16% -4.06%
2/28/2018 5.32% 3.45%
3/31/2018
0.046 0.025
Average Mean 1.05% 0.50%
4.40 4.99
Standard Deviation or
Volatility
Coefficient of variation
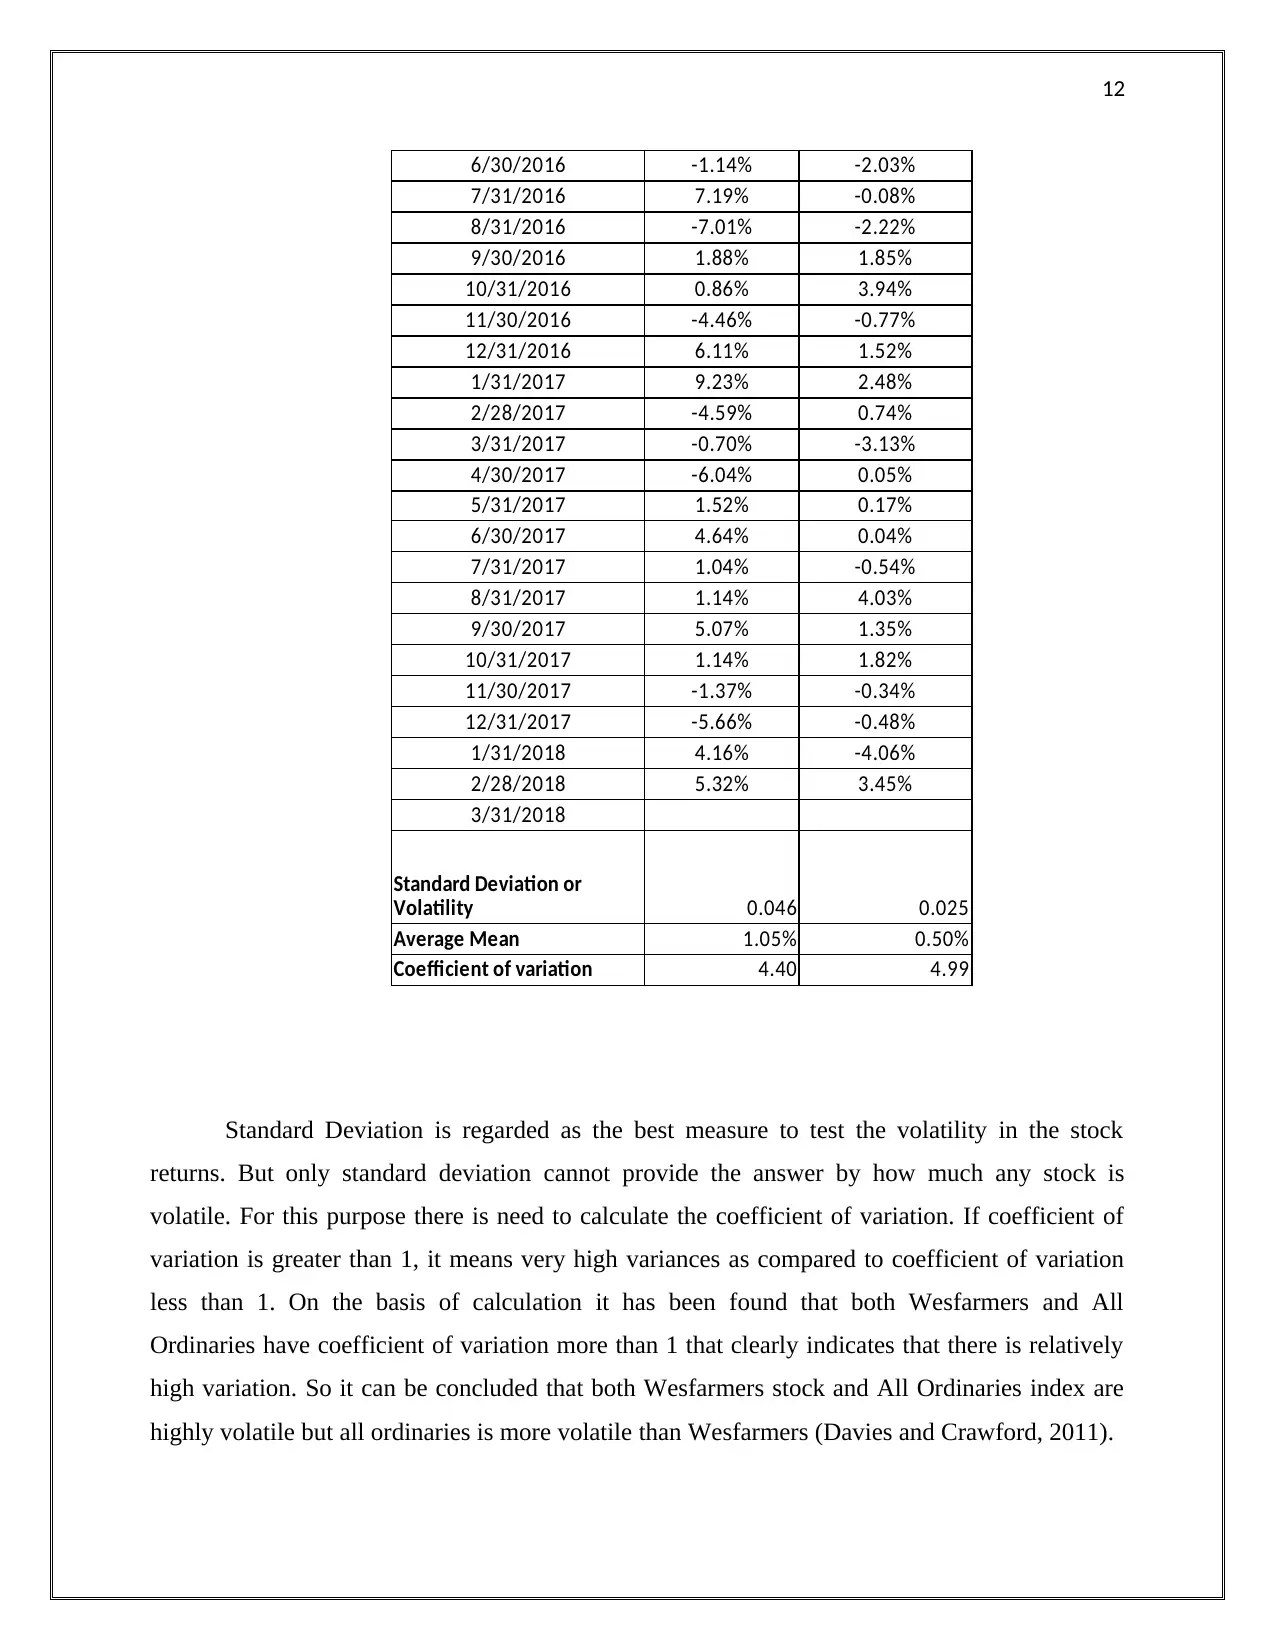
Standard Deviation is regarded as the best measure to test the volatility in the stock
returns. But only standard deviation cannot provide the answer by how much any stock is
volatile. For this purpose there is need to calculate the coefficient of variation. If coefficient of
variation is greater than 1, it means very high variances as compared to coefficient of variation
less than 1. On the basis of calculation it has been found that both Wesfarmers and All
Ordinaries have coefficient of variation more than 1 that clearly indicates that there is relatively
high variation. So it can be concluded that both Wesfarmers stock and All Ordinaries index are
highly volatile but all ordinaries is more volatile than Wesfarmers (Davies and Crawford, 2011).
6/30/2016 -1.14% -2.03%
7/31/2016 7.19% -0.08%
8/31/2016 -7.01% -2.22%
9/30/2016 1.88% 1.85%
10/31/2016 0.86% 3.94%
11/30/2016 -4.46% -0.77%
12/31/2016 6.11% 1.52%
1/31/2017 9.23% 2.48%
2/28/2017 -4.59% 0.74%
3/31/2017 -0.70% -3.13%
4/30/2017 -6.04% 0.05%
5/31/2017 1.52% 0.17%
6/30/2017 4.64% 0.04%
7/31/2017 1.04% -0.54%
8/31/2017 1.14% 4.03%
9/30/2017 5.07% 1.35%
10/31/2017 1.14% 1.82%
11/30/2017 -1.37% -0.34%
12/31/2017 -5.66% -0.48%
1/31/2018 4.16% -4.06%
2/28/2018 5.32% 3.45%
3/31/2018
0.046 0.025
Average Mean 1.05% 0.50%
4.40 4.99
Standard Deviation or
Volatility
Coefficient of variation
Standard Deviation is regarded as the best measure to test the volatility in the stock
returns. But only standard deviation cannot provide the answer by how much any stock is
volatile. For this purpose there is need to calculate the coefficient of variation. If coefficient of
variation is greater than 1, it means very high variances as compared to coefficient of variation
less than 1. On the basis of calculation it has been found that both Wesfarmers and All
Ordinaries have coefficient of variation more than 1 that clearly indicates that there is relatively
high variation. So it can be concluded that both Wesfarmers stock and All Ordinaries index are
highly volatile but all ordinaries is more volatile than Wesfarmers (Davies and Crawford, 2011).
⊘ This is a preview!⊘
Do you want full access?
Subscribe today to unlock all pages.
Trusted by 1+ million students worldwide
1 out of 20
Related Documents


Your All-in-One AI-Powered Toolkit for Academic Success.
+13062052269
info@desklib.com
Available 24*7 on WhatsApp / Email
![[object Object]](/_next/static/media/star-bottom.7253800d.svg)
Unlock your academic potential
Copyright © 2020–2026 A2Z Services. All Rights Reserved. Developed and managed by ZUCOL.