Financial Analysis Report: Wesfarmers Performance and Valuation
VerifiedAdded on 2022/08/22
|10
|1831
|14
Report
AI Summary
This report provides a detailed financial analysis of Wesfarmers, a renowned retail group. It examines the company's performance, including share price movements, which have outperformed the S&P/ASX 200. The report investigates the factors contributing to shareholder value, such as increased revenues and dividend payouts. It analyzes the relationship between Wesfarmers' and ASX 200's returns, and evaluates the company's volatility. Two valuation techniques, the Dividend Discount Model and the PE Model, are employed to assess the share price, along with their respective assumptions and limitations. The report also discusses Wesfarmers' dividend policy, capital structure, and provides an overall assessment of the company's financial health and investment potential, concluding that it presents an attractive investment opportunity. The analysis is supported by relevant financial ratios and data from company reports and external sources.

Running Head: FINANCE 1
FINANCE
FINANCE
Paraphrase This Document
Need a fresh take? Get an instant paraphrase of this document with our AI Paraphraser
Running Head: FINANCE
Contents
Question 1........................................................................................................................................3
Question 2........................................................................................................................................3
Question 3........................................................................................................................................4
Question 4........................................................................................................................................5
Valuation technique 1......................................................................................................................5
Assumptions taken.......................................................................................................................5
Limitations...................................................................................................................................6
Valuation Technique 2.....................................................................................................................6
Assumptions.................................................................................................................................7
Limitations...................................................................................................................................7
Question 5........................................................................................................................................7
Question 6........................................................................................................................................8
Question 7........................................................................................................................................8
References........................................................................................................................................9
Running Head: FINANCE
Question 1
Wesfarmers is one of the most renowned retail group globally, and is a popular name
among the prospective and past stakeholder apart from the present ones. The company has
successfully managed to maximise the shareholder value as listed follows. The share prices of
the company have considerably increased to the tune of 35 per cent in past one year and have
passed the return percentages of the S&P/ASX 200 indices whose overall return was around 19
percent (Donald, 2020). The underlying forces behind the said maximised value of the shares are
the increased revenues, normal dividend payouts of $2.78 per share and additionally a special
dividend payment of $1.00 per share, apart from strategic business decisions. Hence, while the
investors must have bought the shares for a lower amount, the values of the investments have
increased by 35 percent. Recently, the shares traded at an all-time high of $ 42.04 per share (IG
Markets Ltd, 2019).
Question 2
⊘ This is a preview!⊘
Do you want full access?
Subscribe today to unlock all pages.
Trusted by 1+ million students worldwide
Running Head: FINANCE
1/1/2018
3/1/2018
5/1/2018
7/1/2018
9/1/2018
11/1/2018
1/1/2019
3/1/2019
5/1/2019
7/1/2019
9/1/2019
11/1/2019
1/1/2020
-8.00%
-6.00%
-4.00%
-2.00%
0.00%
2.00%
4.00%
6.00%
8.00%
10.00%
12.00%
Share price movements
WESFARMERS
ASX 200
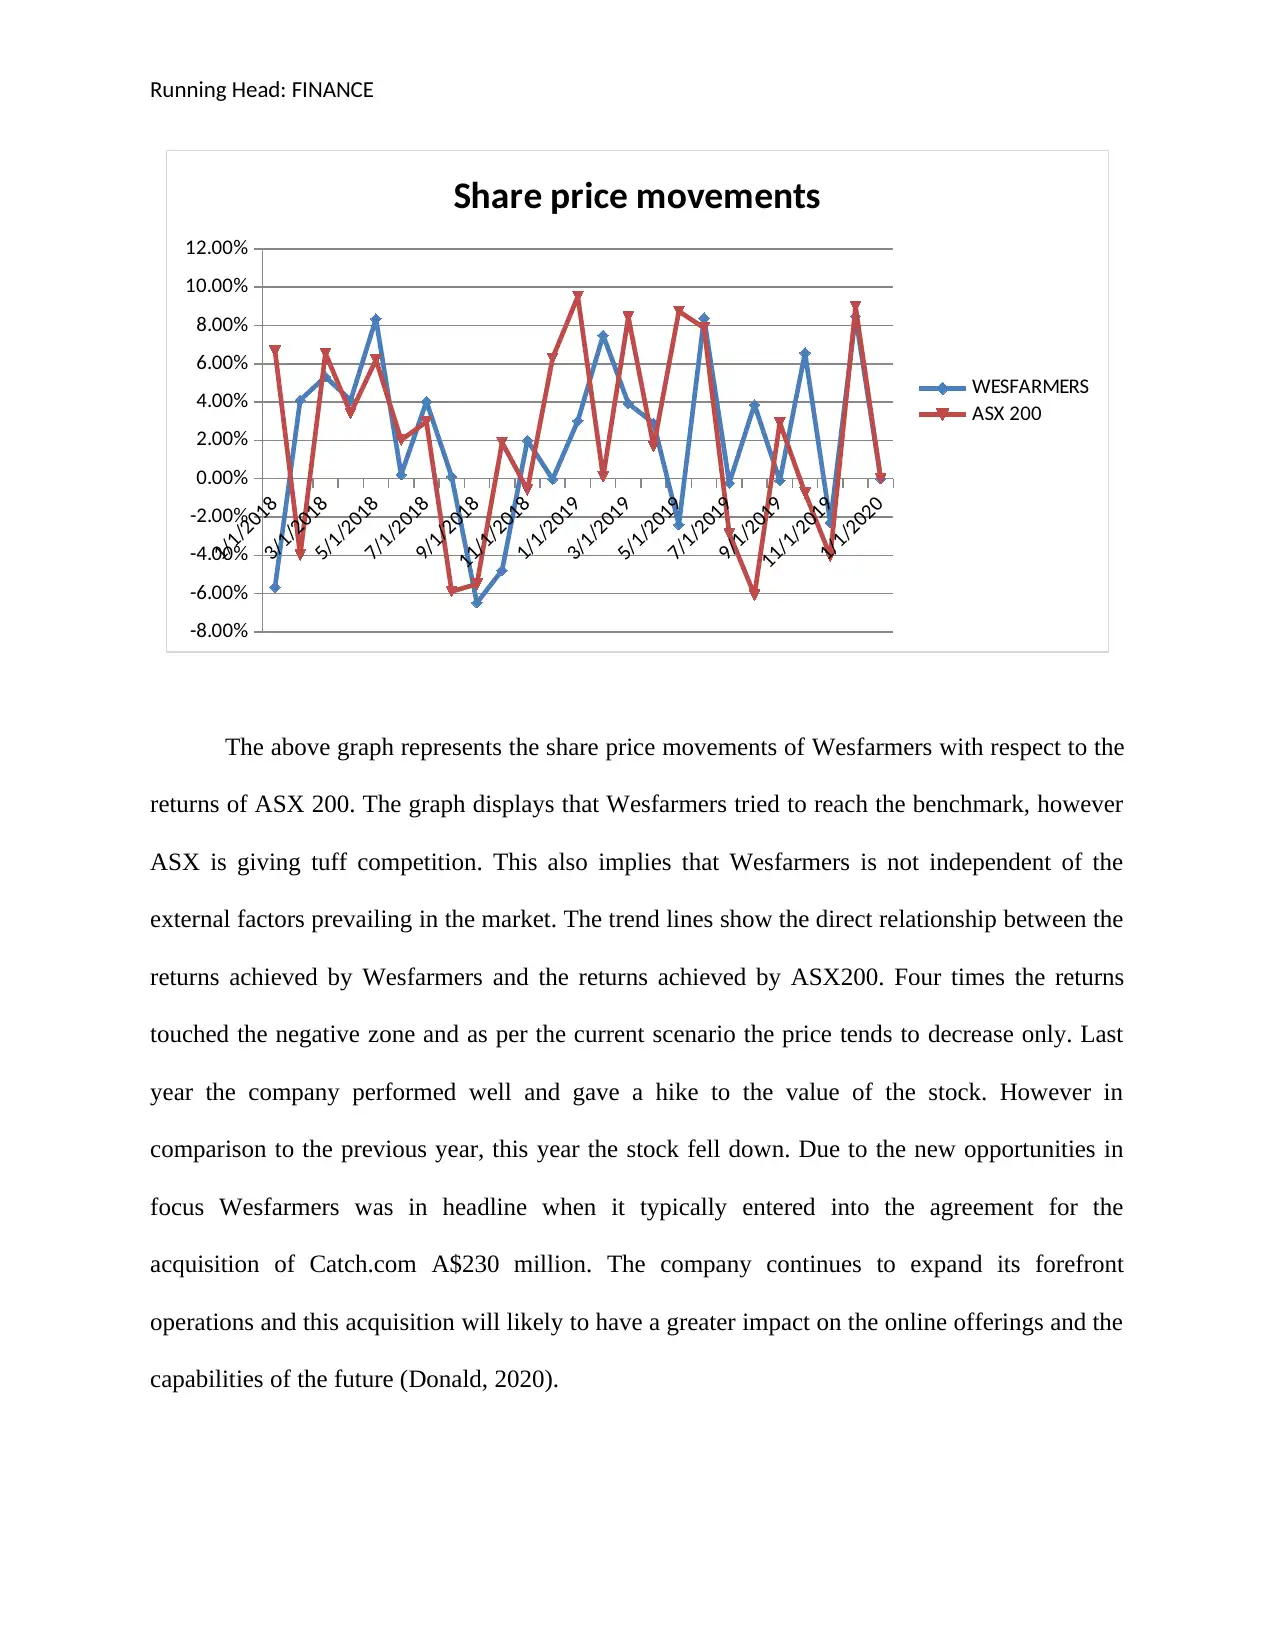
The above graph represents the share price movements of Wesfarmers with respect to the
returns of ASX 200. The graph displays that Wesfarmers tried to reach the benchmark, however
ASX is giving tuff competition. This also implies that Wesfarmers is not independent of the
external factors prevailing in the market. The trend lines show the direct relationship between the
returns achieved by Wesfarmers and the returns achieved by ASX200. Four times the returns
touched the negative zone and as per the current scenario the price tends to decrease only. Last
year the company performed well and gave a hike to the value of the stock. However in
comparison to the previous year, this year the stock fell down. Due to the new opportunities in
focus Wesfarmers was in headline when it typically entered into the agreement for the
acquisition of Catch.com A$230 million. The company continues to expand its forefront
operations and this acquisition will likely to have a greater impact on the online offerings and the
capabilities of the future (Donald, 2020).
1/1/2018
3/1/2018
5/1/2018
7/1/2018
9/1/2018
11/1/2018
1/1/2019
3/1/2019
5/1/2019
7/1/2019
9/1/2019
11/1/2019
1/1/2020
-8.00%
-6.00%
-4.00%
-2.00%
0.00%
2.00%
4.00%
6.00%
8.00%
10.00%
12.00%
Share price movements
WESFARMERS
ASX 200
The above graph represents the share price movements of Wesfarmers with respect to the
returns of ASX 200. The graph displays that Wesfarmers tried to reach the benchmark, however
ASX is giving tuff competition. This also implies that Wesfarmers is not independent of the
external factors prevailing in the market. The trend lines show the direct relationship between the
returns achieved by Wesfarmers and the returns achieved by ASX200. Four times the returns
touched the negative zone and as per the current scenario the price tends to decrease only. Last
year the company performed well and gave a hike to the value of the stock. However in
comparison to the previous year, this year the stock fell down. Due to the new opportunities in
focus Wesfarmers was in headline when it typically entered into the agreement for the
acquisition of Catch.com A$230 million. The company continues to expand its forefront
operations and this acquisition will likely to have a greater impact on the online offerings and the
capabilities of the future (Donald, 2020).
Paraphrase This Document
Need a fresh take? Get an instant paraphrase of this document with our AI Paraphraser
Running Head: FINANCE
Question 3
To evaluate the volatility of Wesfarmers in terms of short term and long term nature, the
short terms returns are calculated above and in order to vouch the long term returns, the ratios of
the liquidity and the profitability have been considered. In the year 2018, net profit of the
company saw a leap in the year 2019 at 19.81% whereas in the previous year the same was
1.80% (Accountingtools.com. 2018). On the other hand, the return on equity is also one of the
ratios that were increasing and this implies that the shareholders will get the greater returns.
Overall the liquidity position has improved but needs more attention and the profitability is
sound and smooths (IG Markets Limited, 2019).
Question 4
Valuation technique 1
Dividend Discount
Model 2018 2019 2020
Price = Expected dividend 2.23 2.78 3.61
(Rate - Growth rate) 25% 30%
Price = 3.61 61.25
0.036
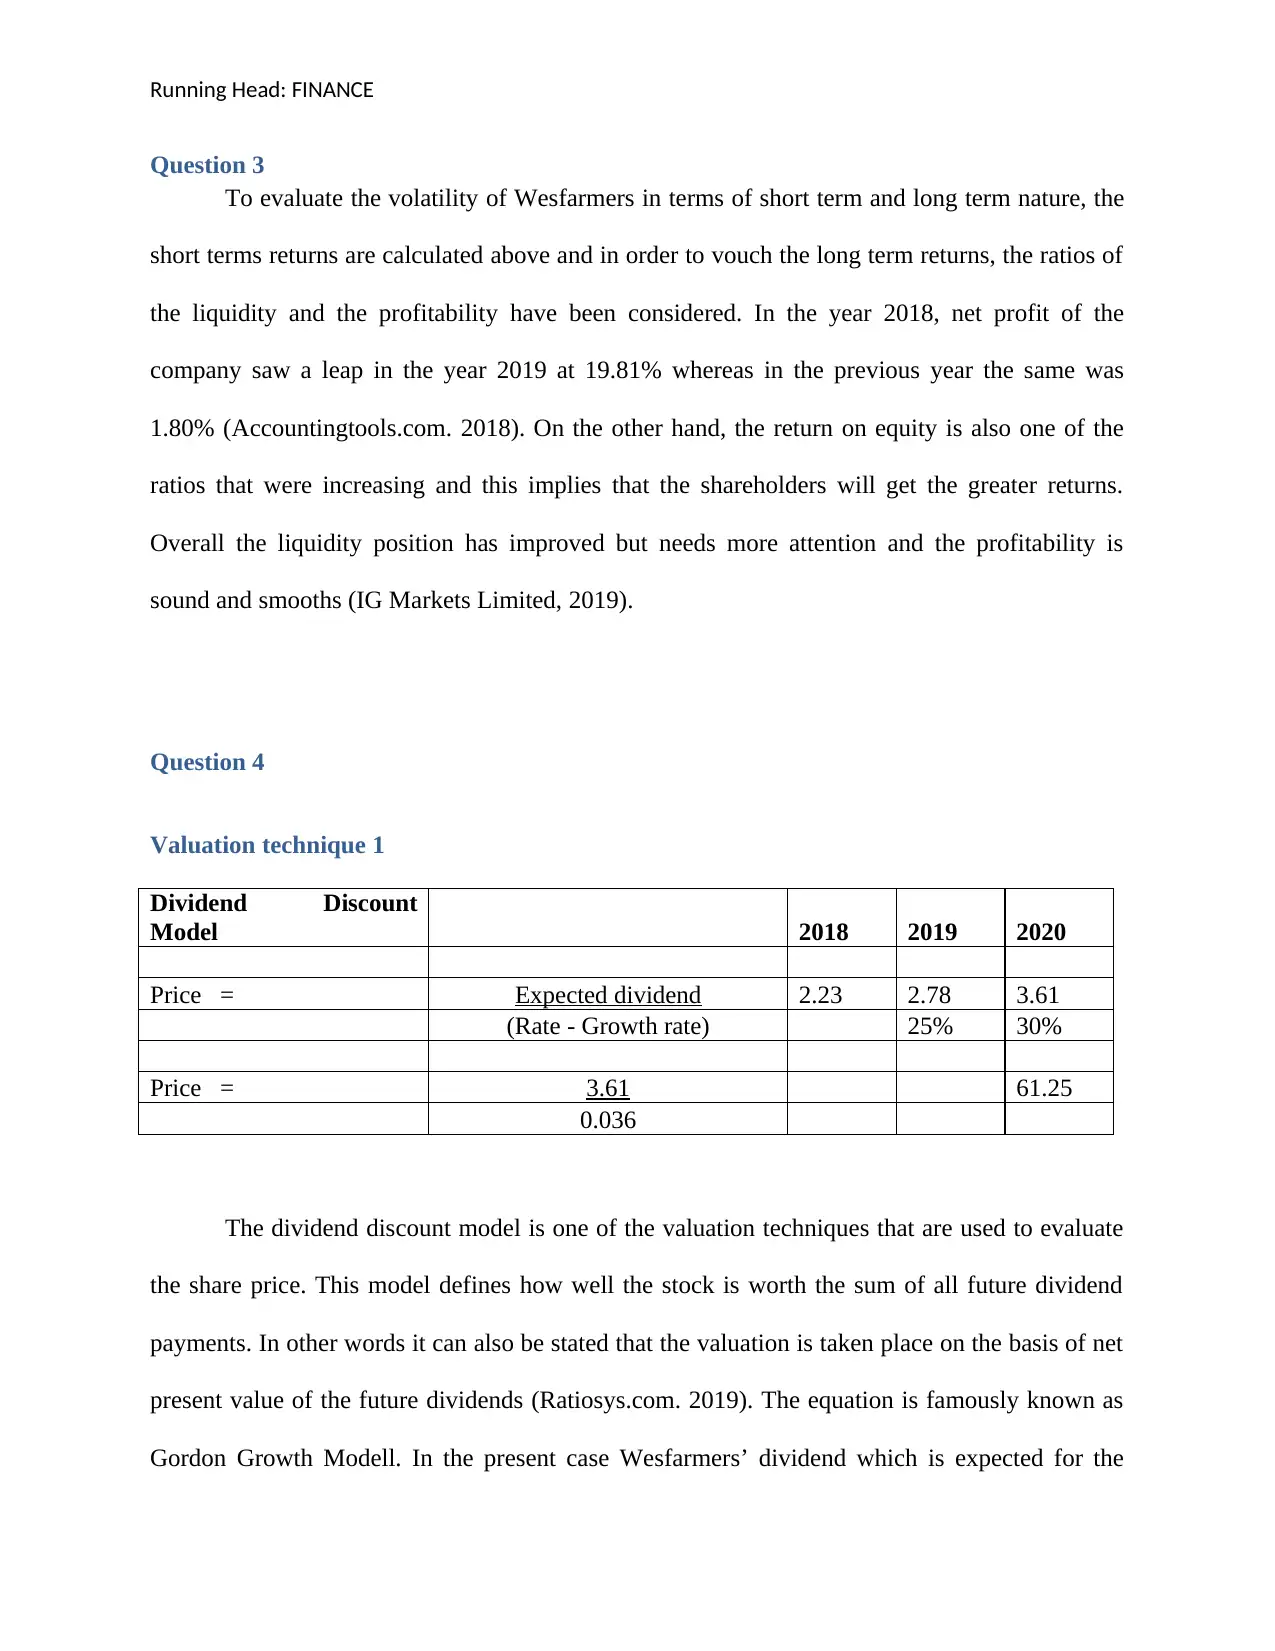
The dividend discount model is one of the valuation techniques that are used to evaluate
the share price. This model defines how well the stock is worth the sum of all future dividend
payments. In other words it can also be stated that the valuation is taken place on the basis of net
present value of the future dividends (Ratiosys.com. 2019). The equation is famously known as
Gordon Growth Modell. In the present case Wesfarmers’ dividend which is expected for the
Question 3
To evaluate the volatility of Wesfarmers in terms of short term and long term nature, the
short terms returns are calculated above and in order to vouch the long term returns, the ratios of
the liquidity and the profitability have been considered. In the year 2018, net profit of the
company saw a leap in the year 2019 at 19.81% whereas in the previous year the same was
1.80% (Accountingtools.com. 2018). On the other hand, the return on equity is also one of the
ratios that were increasing and this implies that the shareholders will get the greater returns.
Overall the liquidity position has improved but needs more attention and the profitability is
sound and smooths (IG Markets Limited, 2019).
Question 4
Valuation technique 1
Dividend Discount
Model 2018 2019 2020
Price = Expected dividend 2.23 2.78 3.61
(Rate - Growth rate) 25% 30%
Price = 3.61 61.25
0.036
The dividend discount model is one of the valuation techniques that are used to evaluate
the share price. This model defines how well the stock is worth the sum of all future dividend
payments. In other words it can also be stated that the valuation is taken place on the basis of net
present value of the future dividends (Ratiosys.com. 2019). The equation is famously known as
Gordon Growth Modell. In the present case Wesfarmers’ dividend which is expected for the
Running Head: FINANCE
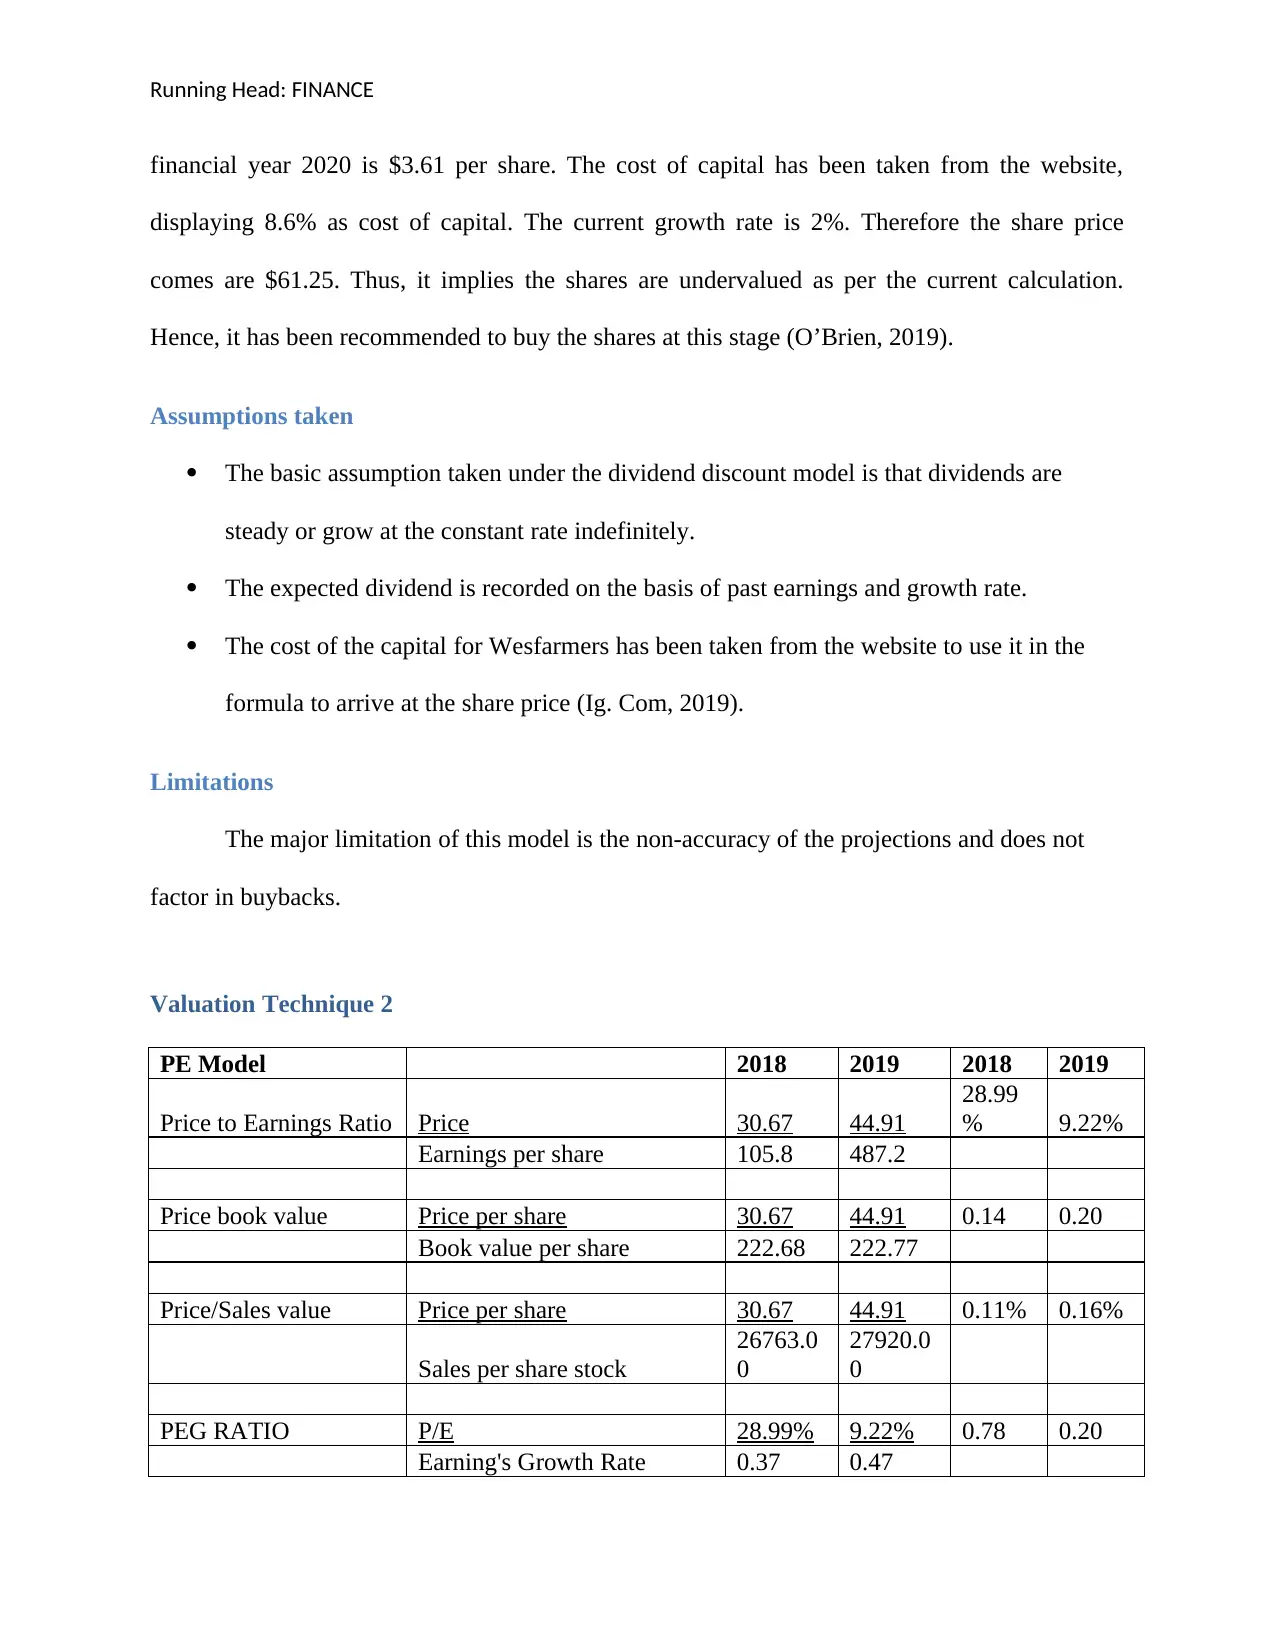
financial year 2020 is $3.61 per share. The cost of capital has been taken from the website,
displaying 8.6% as cost of capital. The current growth rate is 2%. Therefore the share price
comes are $61.25. Thus, it implies the shares are undervalued as per the current calculation.
Hence, it has been recommended to buy the shares at this stage (O’Brien, 2019).
Assumptions taken
The basic assumption taken under the dividend discount model is that dividends are
steady or grow at the constant rate indefinitely.
The expected dividend is recorded on the basis of past earnings and growth rate.
The cost of the capital for Wesfarmers has been taken from the website to use it in the
formula to arrive at the share price (Ig. Com, 2019).
Limitations
The major limitation of this model is the non-accuracy of the projections and does not
factor in buybacks.
Valuation Technique 2
PE Model 2018 2019 2018 2019
Price to Earnings Ratio Price 30.67 44.91
28.99
% 9.22%
Earnings per share 105.8 487.2
Price book value Price per share 30.67 44.91 0.14 0.20
Book value per share 222.68 222.77
Price/Sales value Price per share 30.67 44.91 0.11% 0.16%
Sales per share stock
26763.0
0
27920.0
0
PEG RATIO P/E 28.99% 9.22% 0.78 0.20
Earning's Growth Rate 0.37 0.47
⊘ This is a preview!⊘
Do you want full access?
Subscribe today to unlock all pages.
Trusted by 1+ million students worldwide
Running Head: FINANCE
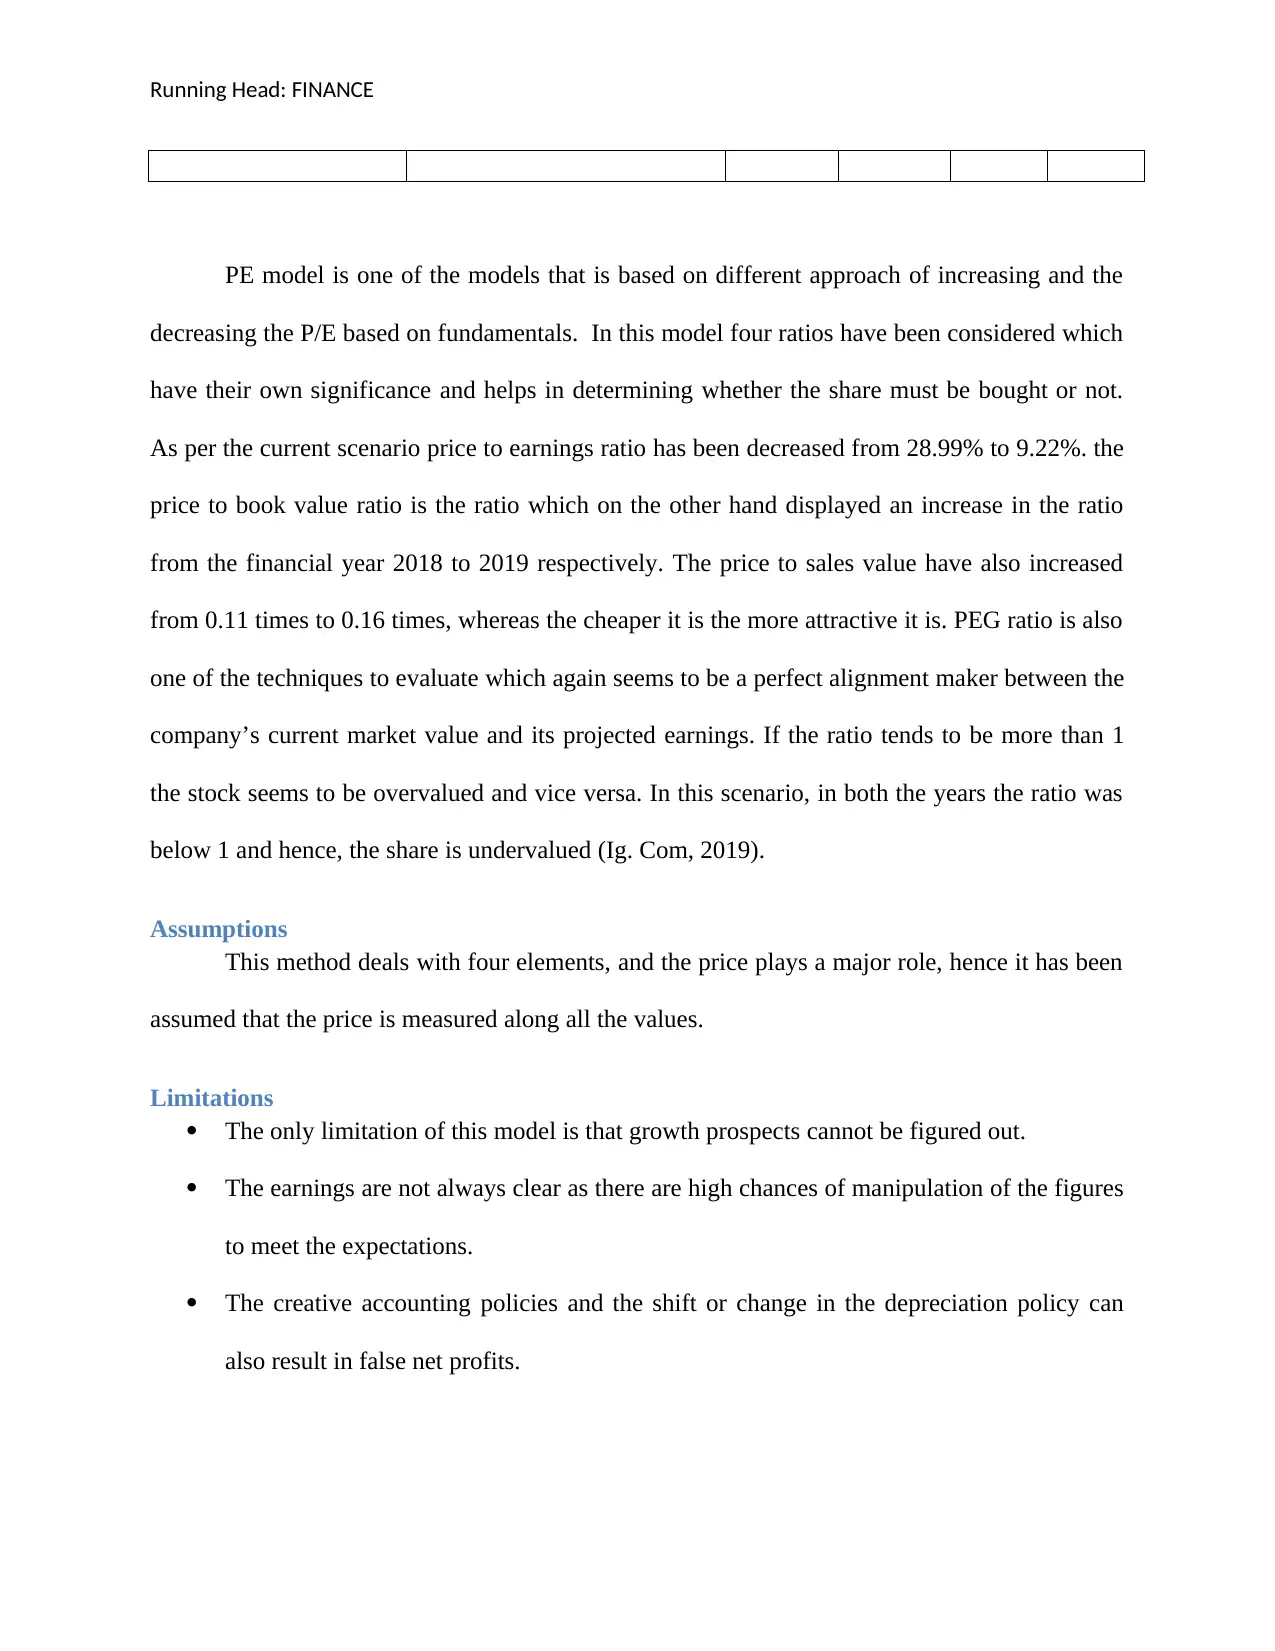
PE model is one of the models that is based on different approach of increasing and the
decreasing the P/E based on fundamentals. In this model four ratios have been considered which
have their own significance and helps in determining whether the share must be bought or not.
As per the current scenario price to earnings ratio has been decreased from 28.99% to 9.22%. the
price to book value ratio is the ratio which on the other hand displayed an increase in the ratio
from the financial year 2018 to 2019 respectively. The price to sales value have also increased
from 0.11 times to 0.16 times, whereas the cheaper it is the more attractive it is. PEG ratio is also
one of the techniques to evaluate which again seems to be a perfect alignment maker between the
company’s current market value and its projected earnings. If the ratio tends to be more than 1
the stock seems to be overvalued and vice versa. In this scenario, in both the years the ratio was
below 1 and hence, the share is undervalued (Ig. Com, 2019).
Assumptions
This method deals with four elements, and the price plays a major role, hence it has been
assumed that the price is measured along all the values.
Limitations
The only limitation of this model is that growth prospects cannot be figured out.
The earnings are not always clear as there are high chances of manipulation of the figures
to meet the expectations.
The creative accounting policies and the shift or change in the depreciation policy can
also result in false net profits.
Paraphrase This Document
Need a fresh take? Get an instant paraphrase of this document with our AI Paraphraser
Running Head: FINANCE
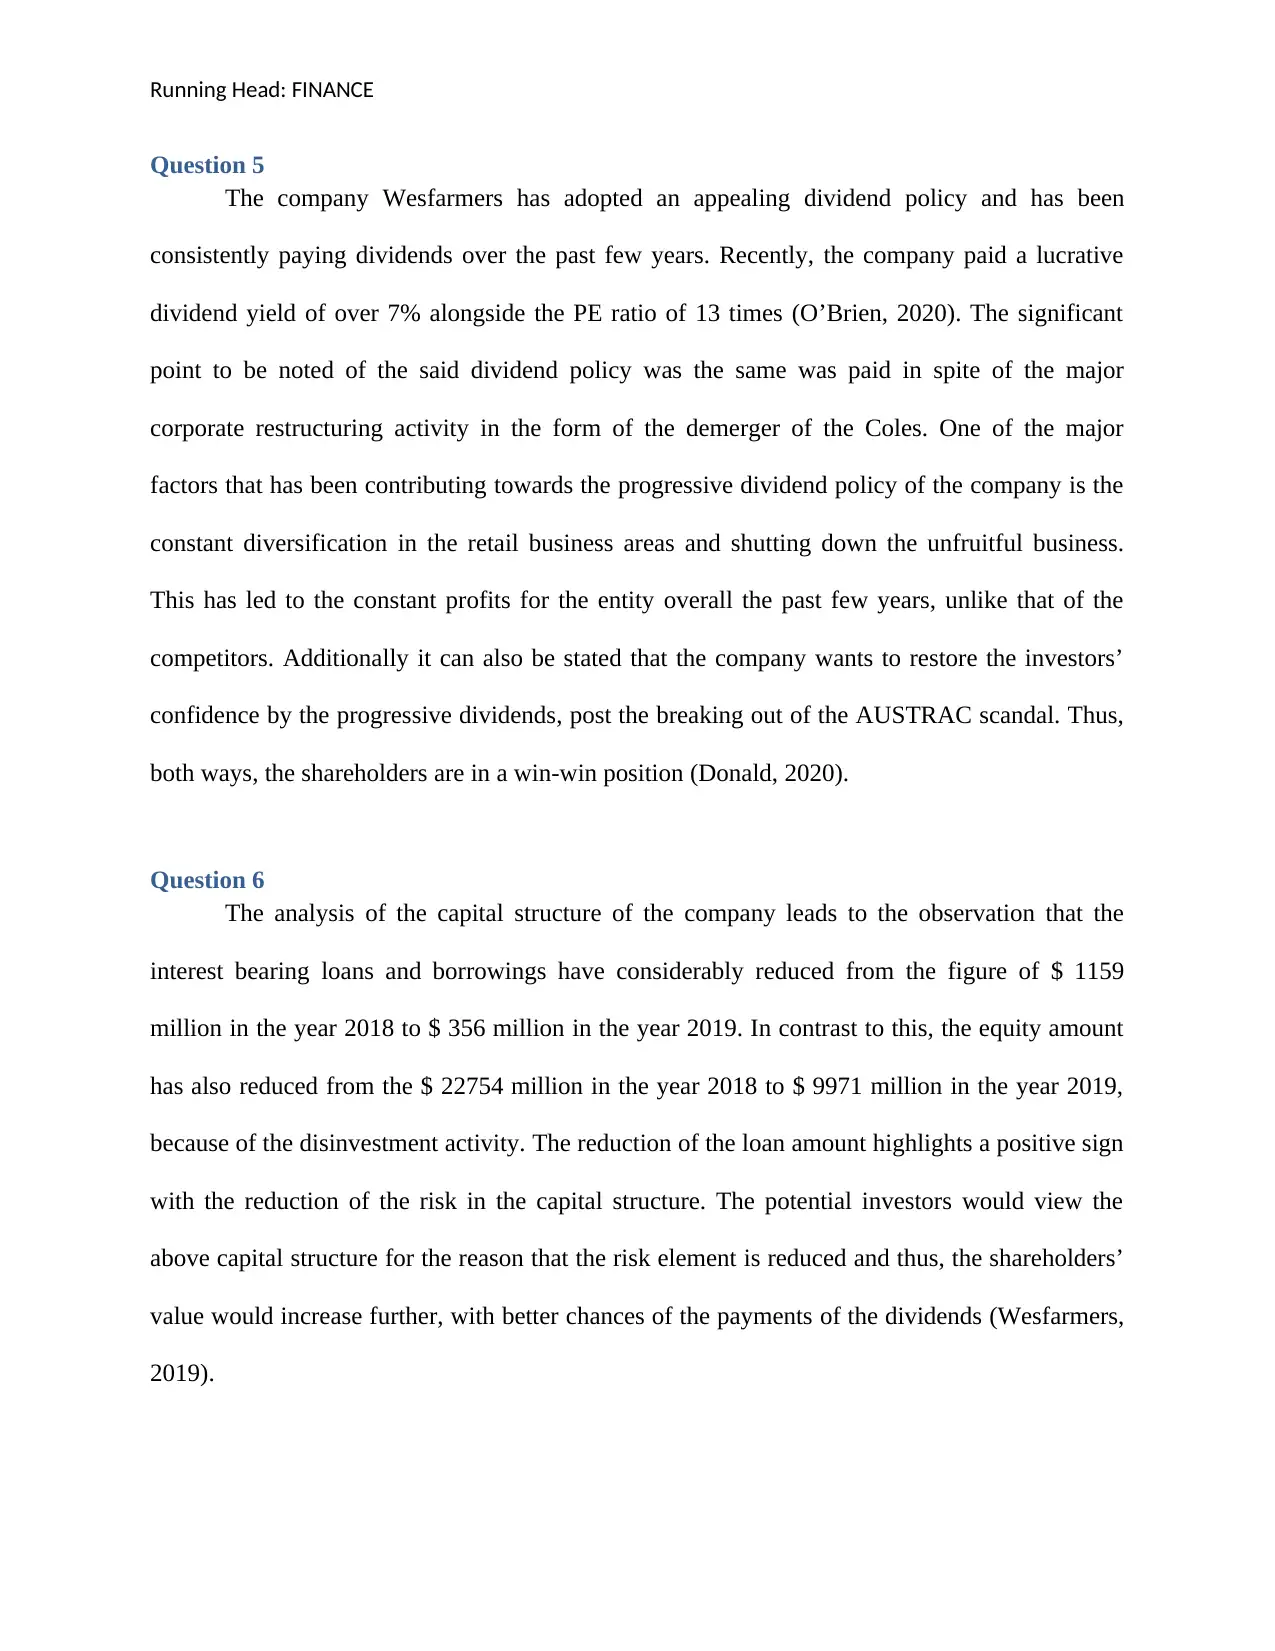
Question 5
The company Wesfarmers has adopted an appealing dividend policy and has been
consistently paying dividends over the past few years. Recently, the company paid a lucrative
dividend yield of over 7% alongside the PE ratio of 13 times (O’Brien, 2020). The significant
point to be noted of the said dividend policy was the same was paid in spite of the major
corporate restructuring activity in the form of the demerger of the Coles. One of the major
factors that has been contributing towards the progressive dividend policy of the company is the
constant diversification in the retail business areas and shutting down the unfruitful business.
This has led to the constant profits for the entity overall the past few years, unlike that of the
competitors. Additionally it can also be stated that the company wants to restore the investors’
confidence by the progressive dividends, post the breaking out of the AUSTRAC scandal. Thus,
both ways, the shareholders are in a win-win position (Donald, 2020).
Question 6
The analysis of the capital structure of the company leads to the observation that the
interest bearing loans and borrowings have considerably reduced from the figure of $ 1159
million in the year 2018 to $ 356 million in the year 2019. In contrast to this, the equity amount
has also reduced from the $ 22754 million in the year 2018 to $ 9971 million in the year 2019,
because of the disinvestment activity. The reduction of the loan amount highlights a positive sign
with the reduction of the risk in the capital structure. The potential investors would view the
above capital structure for the reason that the risk element is reduced and thus, the shareholders’
value would increase further, with better chances of the payments of the dividends (Wesfarmers,
2019).
Running Head: FINANCE
Question 7
From the overall analysis it can be stated that due to the contact diversification and the
reduction of the long term obligations, the company has a great future and potential to provide
better returns in the future. In terms of the share price, fluctuations have been observed due to the
demerger from Coles however the company would pick up the pace and the shareholders will get
the greater returns and margins in the profit value of the company. Further the profitability and
the liquidity position have been improved, which also aligns with the share price and hence, form
the overall analysis it can be concluded that it is an attractive investment opportunity.
⊘ This is a preview!⊘
Do you want full access?
Subscribe today to unlock all pages.
Trusted by 1+ million students worldwide
Running Head: FINANCE
References
Accountingtools.com. (2018). Ratio analysis. Retrieved from
https://www.accountingtools.com/articles/ratio-analysis.html
Donald, M. (2020). Why I think Wesfarmers shares are a buy. Retrieved from:
https://www.fool.com.au/2020/01/10/why-i-think-wesfarmers-shares-are-a-buy/
IG Markets Limited (2019). Wesfarmers share price rises to record highs, brokers remain
bearish. Retrieved from: https://www.ig.com/uk/news-and-trade-ideas/wesfarmers-share-
price-rises-to-record-highs--brokers-remain-bea-191115
Ig. Com, (2019). Wesfarmers share price climbs to all-time high of $39.02 at the open. Retrieved
from https://www.ig.com/en/news-and-trade-ideas/wesfarmers-share-price-hits-all-time-
highs-of--38-89-per-share-190724
O’Brien, K. (2019). 5 top ASX 20 dividend shares to put on your list. Retrieved from:
https://au.finance.yahoo.com/news/5-top-asx-20-dividend-233754059.html
Ratiosys.com. (2019). Ratio Analysis Objectives, Advantages and Limitations. Retrieved from
from. http://ratiosys.com/ratio-analysis/
Wesfarmers, (2019). Annual Report. Retrieved from
https://www.wesfarmers.com.au/docs/default-source/asx-announcements/2019-annual-
report.pdf?sfvrsn=0
1 out of 10
Related Documents


Your All-in-One AI-Powered Toolkit for Academic Success.
+13062052269
info@desklib.com
Available 24*7 on WhatsApp / Email
![[object Object]](/_next/static/media/star-bottom.7253800d.svg)
Unlock your academic potential
Copyright © 2020–2026 A2Z Services. All Rights Reserved. Developed and managed by ZUCOL.