Comprehensive Financial Analysis Report: Westpac Bank Performance
VerifiedAdded on 2022/11/25
|14
|3478
|166
Report
AI Summary
This report presents a financial analysis of Westpac Bank, evaluating its performance through various financial ratios, including profitability and efficiency ratios. The analysis includes calculations of return on equity, return on assets, account receivable turnover, and asset turnover ratios. The report also examines the movement of Westpac's share price, comparing it to the all ordinaries index. Furthermore, it determines the cost of equity using the dividend growth model and identifies the capital structure, calculating the weights of debt and equity. A consulting report is formulated, offering recommendations based on the findings. The analysis covers the company's description, its operational areas, comparative advantages, and trend identification. The report aims to provide a comprehensive financial overview of Westpac Bank's performance and financial standing.
Running head: Business finance 1
Business finance
Business finance
Paraphrase This Document
Need a fresh take? Get an instant paraphrase of this document with our AI Paraphraser
2
Business finance
Abstract
The report is presented on the financial analysis of the company and in that various evaluations
have been made. There has been the identification of the information in relation to the Westpac
and in that coverage is made of all the factors involved. The performance evaluation is then
performed in which the calculation of ratios have been undertaken. There has been the
consideration of the incomes and revenues made by the business and with that profitability is
analyzed. The cost of equity and the weighted average cost of capital has been determined so that
interest expense to be met by the company is identified. The share price movement is determined
and represented by the help of graph. Also, the capital structure and weights of equity and debt in
that have been determined.
3
Business finance
Table of Contents
Abstract............................................................................................................................................2
Introduction......................................................................................................................................4
Financial analysis of Westpac Bank................................................................................................4
Company’s description................................................................................................................4
Calculation of the financial ratios and their analysis...................................................................5
Graph showing share price movement........................................................................................7
Calculation of cost of equity........................................................................................................8
Identification of the capital structure...........................................................................................9
Consulting report...........................................................................................................................11
Introduction................................................................................................................................11
Financial analysis.......................................................................................................................11
Conclusion.................................................................................................................................12
Conclusion.....................................................................................................................................12
References......................................................................................................................................13
⊘ This is a preview!⊘
Do you want full access?
Subscribe today to unlock all pages.
Trusted by 1+ million students worldwide
4
Business finance
Introduction
In this report, there will be carrying out of the financial analysis of the Westpac Bank. The
complete description of the company and its operations will be made. In that, the areas of
operations will be identified which are being undertaken by the Company. The comparative
advantages which are available with the company will have to be discussed and they all will be
discussed in the report. There will be an identification of the trend which is being followed and
for that trend analysis will be carried out. The performance of the company will be evaluated
together with efficiency. There will be an undertaking of the ratio analysis for the same by which
the evaluation will be made and the representation of the same will be made in the report. The
price of the shares in the market keep on changing in a regular manner and for that, it is required
that there shall be the identification of the movement which is taking place. In the report, the
share price movement for the past years will be considered and evaluated with the help of graph.
The comparison will also be made under this with the all ordinaries index. There will be a
calculation of the cost of equity for the company by using the provided information. The capital
structure will be determined and with that, there will be ascertainment of the weighted average
cost of capital. The consulting report will be formulated with the help of all the findings in which
recommendations will also be provided.
Financial analysis of Westpac Bank
Company’s description
In Australia, there are several banks which are operating and the oldest among them is Westpac
and is counted as the big banking organization. It is also operating in New Zealand and there also
is considered as the largest bank. The company is involved in providing several types of financial
and banking services to its customers (Westpac, 2019). In this institutional, consumer and
business banking are involved together with the wealth management services. The main aim of
the company is to provide its consumers with the required services which will help them in
growing further. There will be confidence that money will be safe and that way investment can
be made in an easy manner. The business is classified into five divisions in which unique
Paraphrase This Document
Need a fresh take? Get an instant paraphrase of this document with our AI Paraphraser
5
Business finance
portfolio are being operated (Westpac, 2019). This will be covering the business bank, consumer
bank, Westpac New Zealand, Westpac institutional bank and BT financial group Australia.
The company is working in such a manner that there are several comparative advantages which
are experienced by it. There is a high level of competition in the banking industry and in order to
deal with those innovations were made by Westpac. By the help of that, the company is able to
meet the preferences of the consumers. There is the incorporation of the use of new technology
so that all the services with advanced benefits are provided (King, 2017). There are more
customers who are attracted due to that making the company a successful one. The company is
able to retain its original position in the competitive market also due to its approaches and
systems which are followed.
Calculation of the financial ratios and their analysis
The ratio analysis is performed by the company so that the evaluation of the various aspects is
made possible. In this, it will be possible to determine the various elements which are involved
and then they are compared with each other so that interrelationships can be identified (Pervan
and Kuvek, 2013). There will be an undertaking of the various items in this and by the help of
them, the profitability of the business will be evaluated (Delen, Kuzey, and Uyar, 2013). In
addition to this, there will be consideration of the operating factors also so that operations
efficiency can be evaluated. There will be the calculation of various ratios in this for the
profitability and efficiency and all of them are provided below.
Profitability ratios: These are the ratios with the help of which it will be possible for the
company to check the performance in terms of the profits which are made by it (Liang et al.,
2016). There are several elements which are involved in this and will be considered for making
the calculations. The main ratios which will be calculated are as follows:
Particulars 2016 2017 2018
Revenue 37518 38199
6
Business finance
Net profit 7997 8099
Total equity 61288 64521
Account receivables 9951 7128 5790
Average account receivables 8539.5 6459
Total assets 83920
2
851875 879592
Average assets 845538.5 865733.5
Particulars Formula 2017 2018
Return on equity Net
profit/Equity*100
13.05% 12.55%
Return on assets Net profit/Assets*100 0.94% 0.92%
The ratios which have been calculated shows the earnings which are made by the company on
various items involved in the company. It can be noted that the return which is made on the
equity is high and is decreasing to a certain extent. The earnings which are made on the assets
are identified and it is found that the earnings are less than one percent.
⊘ This is a preview!⊘
Do you want full access?
Subscribe today to unlock all pages.
Trusted by 1+ million students worldwide
7
Business finance
Efficiency ratios: The activities in the company are performed with the help of the abilities that
exist in the company. In these ratios also the manner in which the company is capable to meet its
obligations and also the manner in which they can utilize the assets which are available (Adam,
2014). The calculations which are made for the same are presented below:
Particulars Formula 2017 2018
Account receivable turnover Revenue/Average Account receivable 4.39 5.91
Asset turnover ratio Revenue/Average Total assets 0.04 0.04
It can be seen that the turnover in relation to the account receivable is quite good. There is an
increase in this from 4.39 to 5.91 which is good. This shows that the company will be able to
recover the amount from debtors and there is coverage at a high level. The sales are around five
times of the receivables. The asset turnover is quite low and this shows that the company is not
able to utilize the assets in an adequate manner. Therefore it is required that proper utilization
shall be made of all the available resources.
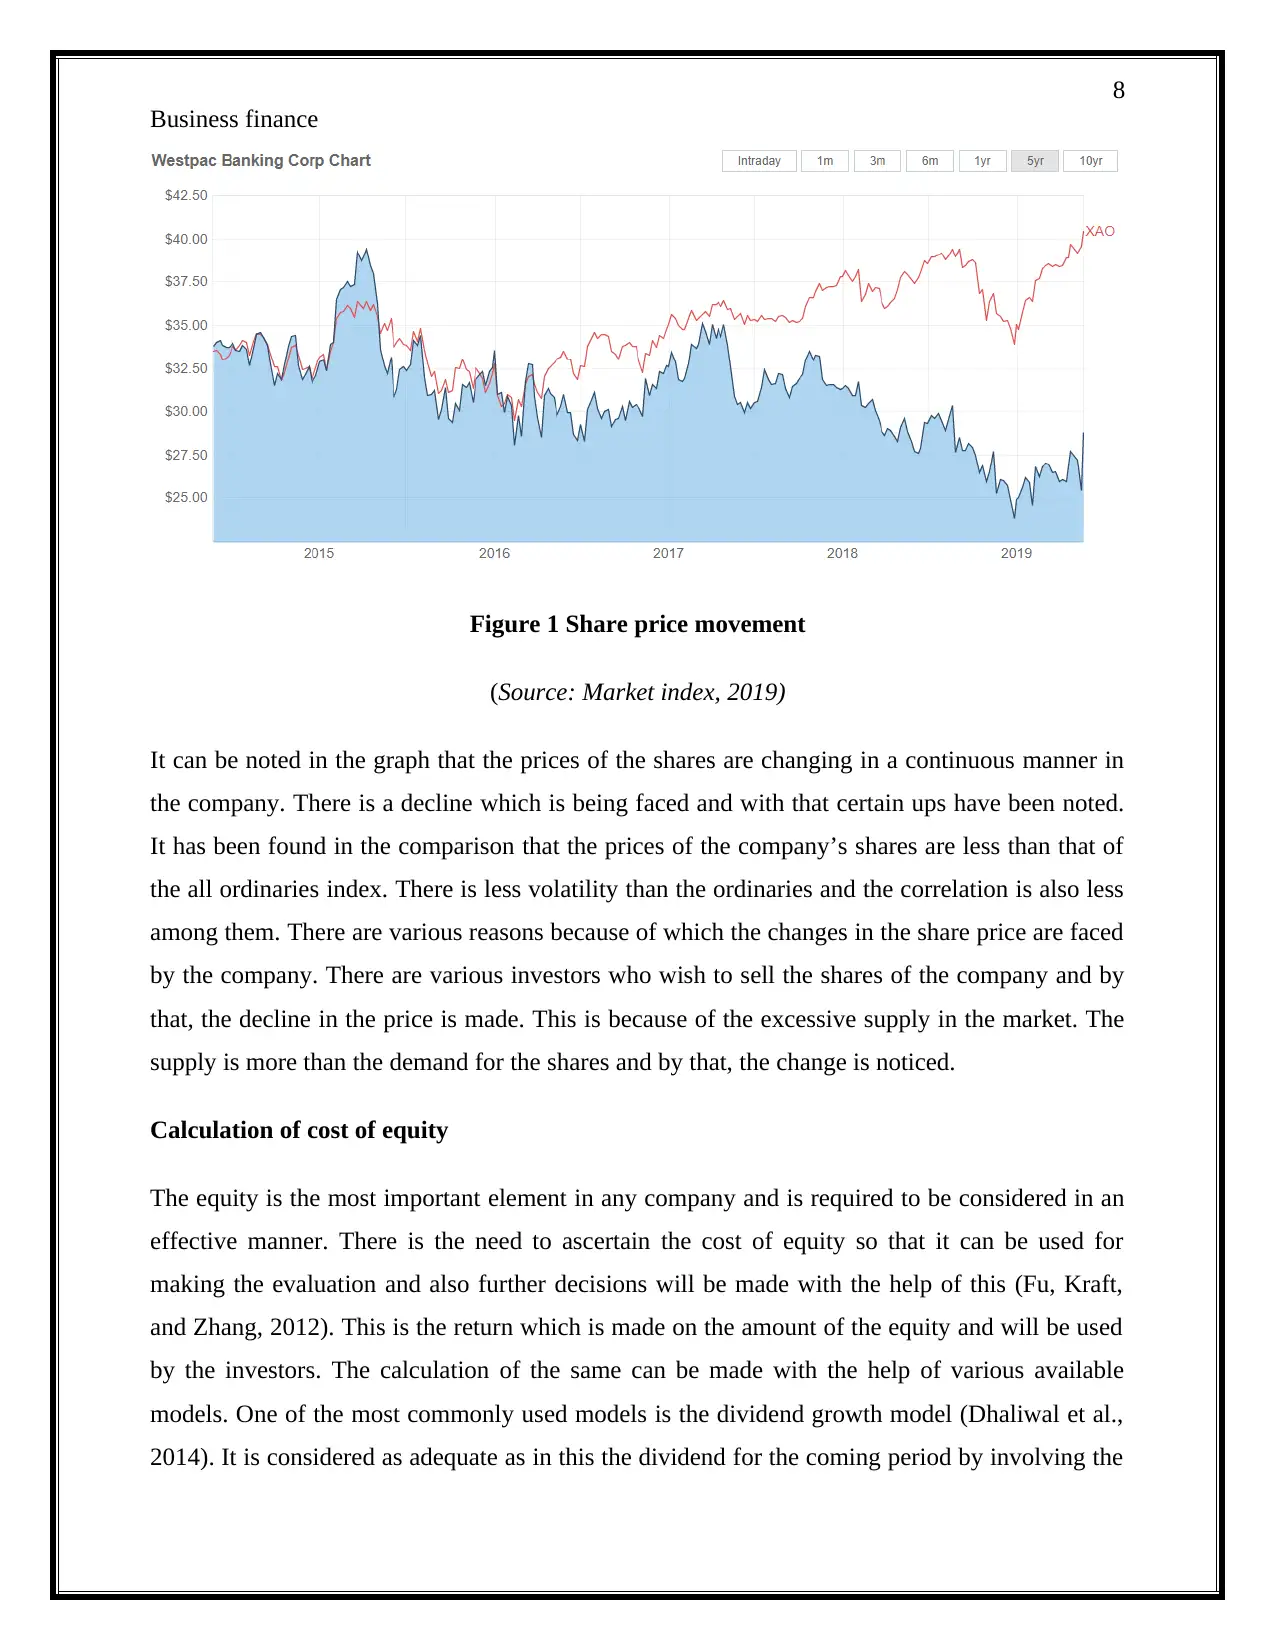
Graph showing share price movement
The share price of the company keeps on changing from time to time and there are several
factors which are responsible for the same. It is required that the analyzation shall be made so
that all the changes can be identified. By the help of this, it will be possible to identify the trend
which is prevailing so that future aspects can be taken into consideration (Shum et al., 2015).
There is the need to make a comparison with the all ordinaries index so that the analyzation can
be made in an effective manner. The changes in accordance with all ordinaries will be made so
that a decision can be made properly. The graph showing all the changes is presented below for
better understanding.
Business finance
Efficiency ratios: The activities in the company are performed with the help of the abilities that
exist in the company. In these ratios also the manner in which the company is capable to meet its
obligations and also the manner in which they can utilize the assets which are available (Adam,
2014). The calculations which are made for the same are presented below:
Particulars Formula 2017 2018
Account receivable turnover Revenue/Average Account receivable 4.39 5.91
Asset turnover ratio Revenue/Average Total assets 0.04 0.04
It can be seen that the turnover in relation to the account receivable is quite good. There is an
increase in this from 4.39 to 5.91 which is good. This shows that the company will be able to
recover the amount from debtors and there is coverage at a high level. The sales are around five
times of the receivables. The asset turnover is quite low and this shows that the company is not
able to utilize the assets in an adequate manner. Therefore it is required that proper utilization
shall be made of all the available resources.
Graph showing share price movement
The share price of the company keeps on changing from time to time and there are several
factors which are responsible for the same. It is required that the analyzation shall be made so
that all the changes can be identified. By the help of this, it will be possible to identify the trend
which is prevailing so that future aspects can be taken into consideration (Shum et al., 2015).
There is the need to make a comparison with the all ordinaries index so that the analyzation can
be made in an effective manner. The changes in accordance with all ordinaries will be made so
that a decision can be made properly. The graph showing all the changes is presented below for
better understanding.
Paraphrase This Document
Need a fresh take? Get an instant paraphrase of this document with our AI Paraphraser
8
Business finance
Figure 1 Share price movement
(Source: Market index, 2019)
It can be noted in the graph that the prices of the shares are changing in a continuous manner in
the company. There is a decline which is being faced and with that certain ups have been noted.
It has been found in the comparison that the prices of the company’s shares are less than that of
the all ordinaries index. There is less volatility than the ordinaries and the correlation is also less
among them. There are various reasons because of which the changes in the share price are faced
by the company. There are various investors who wish to sell the shares of the company and by
that, the decline in the price is made. This is because of the excessive supply in the market. The
supply is more than the demand for the shares and by that, the change is noticed.
Calculation of cost of equity
The equity is the most important element in any company and is required to be considered in an
effective manner. There is the need to ascertain the cost of equity so that it can be used for
making the evaluation and also further decisions will be made with the help of this (Fu, Kraft,
and Zhang, 2012). This is the return which is made on the amount of the equity and will be used
by the investors. The calculation of the same can be made with the help of various available
models. One of the most commonly used models is the dividend growth model (Dhaliwal et al.,
2014). It is considered as adequate as in this the dividend for the coming period by involving the
9
Business finance
growth will be used and by that the cost will be calculated (Golez, 2014). As dividend is the
income earned by the investors on their investment so, that is the most important aspect for them
which shall be involved in the calculation of the cost of equity. The formula which will be used
for the same is as follows:
Ke = (D1/P0) + G
Where,
D1 = Dividend for coming period
P0 = Current share price
G = Growth rate
Ke = [(1.88 + 4%)/28.81]+ 0.04
= (1.9552/28.81) + 0.04
= 0.0679+0.04
= 0.1079
= 10.79%
So as per the calculations made using the available information there is the cost of equity of
10.79% in Westpac Bank.
Identification of the capital structure
In every company, there are various sources with the help of which the company is collecting its
required funds. The combination of all the elements in this is identified as the capital structure of
the company. There are mainly two sources which are included in this and that include debt and
equity (Fan, Titman and Twite, 2012). They are both are held in some proportion and that is to
be taken into account to identify the weight of each in the capital structure (Robb and Robinson,
2014). The weights of both equity and debt are to be calculated and they are as follows:
⊘ This is a preview!⊘
Do you want full access?
Subscribe today to unlock all pages.
Trusted by 1+ million students worldwide
10
Business finance
Total debt = 17265
Total equity = 64521
Total capital = 17265 + 64521
= 81786
Weight of debt = 17265/81786
= 0.21
Weight of equity = 1 – Weight of debt
= 1 – 0.21
= 0.79
From the calculation, the division of the capital structure has been understood. It can be noted
that in complete structure 21% is held by debt and the remaining balance is for the equity. So the
weights in respect of the two in capital structure are obtained and will be used for further
calculations.
The weighted average cost of capital is the one in which the rate will be derived by considering
the weights of debt and equity (Frank and Shen, 2016). This will be the cost or rate that will be
applicable on all the amounts included in the company on an average basis. The amount which is
to be paid by the company on its capital in any period will be determined with the help of this.
The formula for the calculation of this is as provided hereunder:
WACC = Kd *weight of debt + Ke * Weight of equity / (Weight of debt + Weight of equity)
= (0.05 * 0.21) + (0.1079 * 0.79) / (0.21 + 0.79)
= 0.0105 + 0.0852
= 0.0957
Paraphrase This Document
Need a fresh take? Get an instant paraphrase of this document with our AI Paraphraser
11
Business finance
= 9.57%
The weighted average cost of capital of the company is derived to be 9.57% and this will be used
in identifying the amount that is required to be paid by the company in the coming period.
There are certain changes which have been noted in the capital structure of the company. There
may be various reasons which are responsible for this. It is seen that equity is changing due to
the net profit which is made in the year (Hou, Van Dijk and Zhang, 2012). The dividend has
been paid by the company and with that, all the preference shares are also converted which lead
to the change.
Consulting report
Table of content
Introduction 11
Financial analysis 11
Conclusion 12
Introduction
In this report, the financial analysis of the Westpac and the results attained by this will be
discussed. There will be an undertaking of various calculations using the techniques which are
available.
Financial analysis
The ratio analysis is performed and with that, the performance of the company is evaluated.
There is the identification of the profitability and also the efficiency with which all the
operations are performed is identified. Company is maintaining its profits and the movement in
the share price is also there. The graph shows that the company is having the movement and they
are less than that of the all ordinaries index. The cost for equity is identified and it is derived to
be 10.79% for the company. The capital structure of the company involves equity and debt and
12
Business finance
they are in the proportion of 79 and 21% respectively. The changes in the capital structure of the
company are also identified.
Conclusion
From the report the position of Westpac is determined and with that, the weighted average cost
of capital is also identified. The company will be paying all the interest on the rate which is
calculated. The company is in a good position and will be maintaining the same by working
effectively.
Conclusion
The report that is presented above involved all the important aspects in relation to the financial
analysis. All the important elements in this have been identified in relation to Westpac and there
is the evaluation of the performance made. The information about the company and the functions
which are undertaken by it has been identified and they have been discussed in the report in a
detailed manner. The financial ratios have been calculated in which two categories which involve
profitability and efficiency has been considered. With the help of that, the performance made by
the company in the past few years has been evaluated. After that, the movement which the
company has experienced in the past few years on the share price has been identified. This has
also been compared with the all ordinaries index so that comparison can be made in a better
manner. The calculations have been made in which the equity cost and weights of debt and
equity in capital structure have been determined. By using all of them the weighted average cost
of capital has been derived. A consulting report has been prepared in the last part in which all the
evaluations made have been incorporated.
⊘ This is a preview!⊘
Do you want full access?
Subscribe today to unlock all pages.
Trusted by 1+ million students worldwide
1 out of 14
Related Documents


Your All-in-One AI-Powered Toolkit for Academic Success.
+13062052269
info@desklib.com
Available 24*7 on WhatsApp / Email
![[object Object]](/_next/static/media/star-bottom.7253800d.svg)
Unlock your academic potential
Copyright © 2020–2026 A2Z Services. All Rights Reserved. Developed and managed by ZUCOL.